
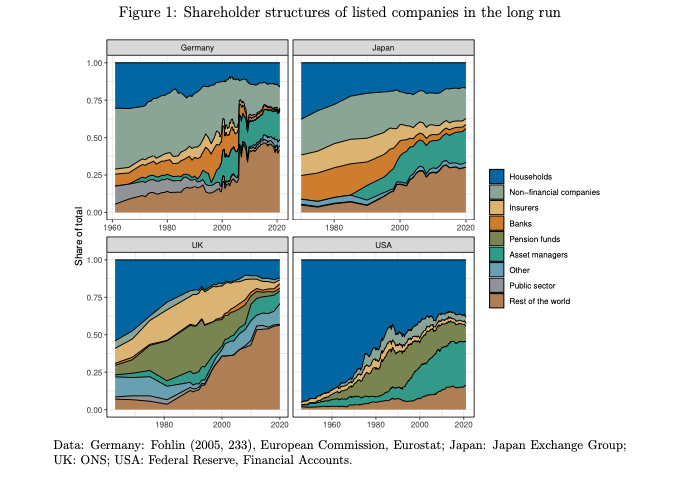
The observation that “ownership of large listed companies is dispersed [...] in the U.S. and concentrated in most other countries” was considered “one of the best established stylized facts” in the corporate finance literature (Franks, Mayer and Rossi, 2009, 4009).
The purpose of this paper is to challenge this stylized fact. Since the turn of the century, the shareholding landscape has undergone a radical transformation, driven by the rapid growth of institutional capital pools. This category, comprises both asset owners—such as pension funds, endowments, or insurers—and asset managers, primarily providers of mutual funds and index funds (Fichtner, Heemskerk and Garcia-Bernardo, 2017; Braun, 2021). Their growth has been fueled, in turn, by the expansion of funded pension systems. Today, these institutional capital pools have become a source of shareholder concentration—in stark contrast to their customary association, in the CPE literature, with dispersed share ownership. At the same time, the rise of extreme wealth inequality points to increased shareholder concentration also amongst individuals and families, the traditional blockholders. As several authors have observed, this configuration resembles the “finance capital” configuration diagnosed by Rudolf Hilferding, under which large banking conglomerates, together with a small number of industrial tycoons (in the United States: ‘robber barons’) dominated the US and German corporate sectors at the turn of the 19th century (Davis, 2008; Maher and Aquanno, 2022; Braun, 2022). Are we living through the emergence of a finance capital 2.0 configuration? To examine this question, we marshal the Bureau van Dijk’s ORBIS dataset, which provides global, firm-level information on share ownership for both listed and unlisted companies. ORBIS is notoriously patchy and difficult to handle for research purposes (Garcia-Bernardo and Takes, 2018; Kalemli-Ozcan et al., 2022; Liu, 2020; Bajgar et al., 2020). This paper is therefore based on a dataset that takes into account the state of the art of the ORBIS literature and extends the data in several regards to make it usable for our analysis of ownership concentration. Among other data preparation steps, detailed in section 4, we have assembled a novel, more reliable dataset of institutional shareholder categories, as well as a dataset of super-rich families with net wealth in excess of USD 250 million.
Our descriptive results show that liberal market economies have switched from quintessential dispersed-ownership societies to concentrated shareholder structures. The dominance of foreign shareholders, meanwhile, is most extreme in continental Europe—largely because the centers of the global asset management sector lie outside of Europe. Across the advanced world, the effect of controlling stakes held by super-rich individuals on the size of minority holdings by diversified asset managers is neutral. Direct holdings by institutional asset owners, such as pension funds, are minimal, while having large funded pension systems does not afford countries domestic shareholder majorities.
A principal component analysis shows that ownership concentration comes in at least four different varieties ([1.] finance-dominated English-speaking countries; [2.] foreign-dominated, small and open economies; [3.] rich oligarchies; and [4.] developmental economies). We uncover that only a minority of variance plays at the country level (when compared to the firmor sector level). Common-Law regimes are associated with all kinds of institutional ownership, particularly asset manager capitalism, Scandinavians mostly with banks and pension funds, and Roman-law systems mostly with public ownership. Super-rich families and individual corporate owners are also systematically different from asset managers (and other institutional shareholders) because their assets are much more concentrated, have a stronger focus on manufacturing and carbon-emission-intensive sectors.
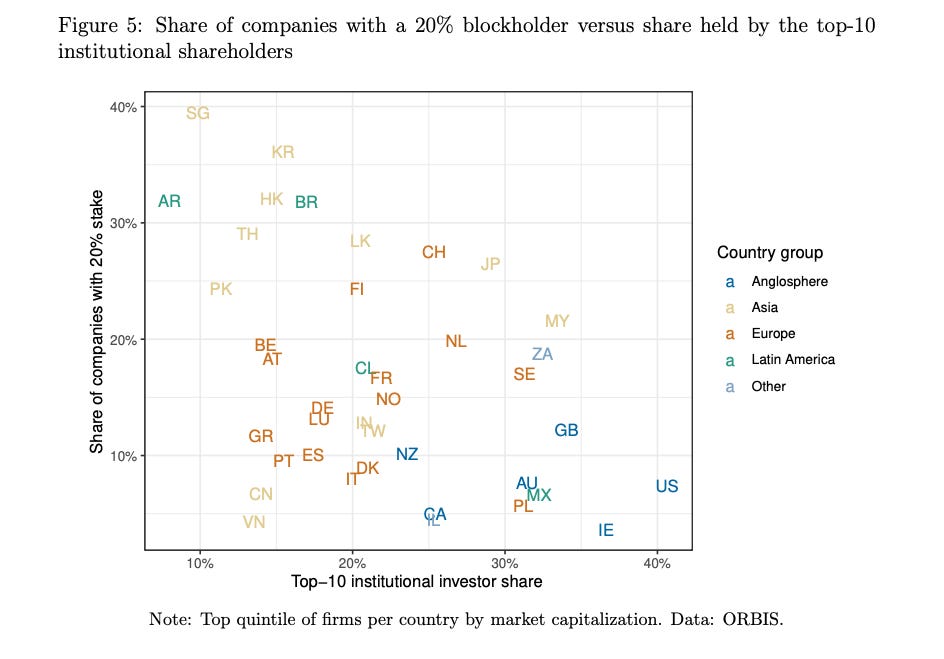
Given this dominant position of the largest asset managers, attempts to measure shareholder concentration need to capture both varieties of concentration—strategic blockholders with concentrated portfolios and global asset managers with diversified portfolios. Figure 5 does precisely that, plotting the share of companies with a 20% stake on the y-axis and the share held by the ten largest institutional shareholders on the x-axis (i.e., any shareholder that is not an individual, corporation, or state entity). The plot shows data only for the largest quintile of companies, but results look similar for the full sample. The results suggest that there are three distinct worlds of share ownership concentration: [1.] strategic blockholder dominance in countries such as Argentina, Brazil, Korea, and Hong Kong; [2.] institutional capital pool dominance in English-speaking countries; and [3.] a combination of moderate levels of both in Western European countries. In other words, while it is true that those (Anglophone) countries whose shareholder structures are conventionally described as dispersed have few blockholders, they have the highest degree of institutional shareholder concentration. European countries combine moderate levels of both types of concentration.
Source: “Linking Wealth and Power: Unity and Political Action of the World’s Wealthiest Capitalist Families and the Corporate Elite” by Hans Lukas Richard Arndt (2023)
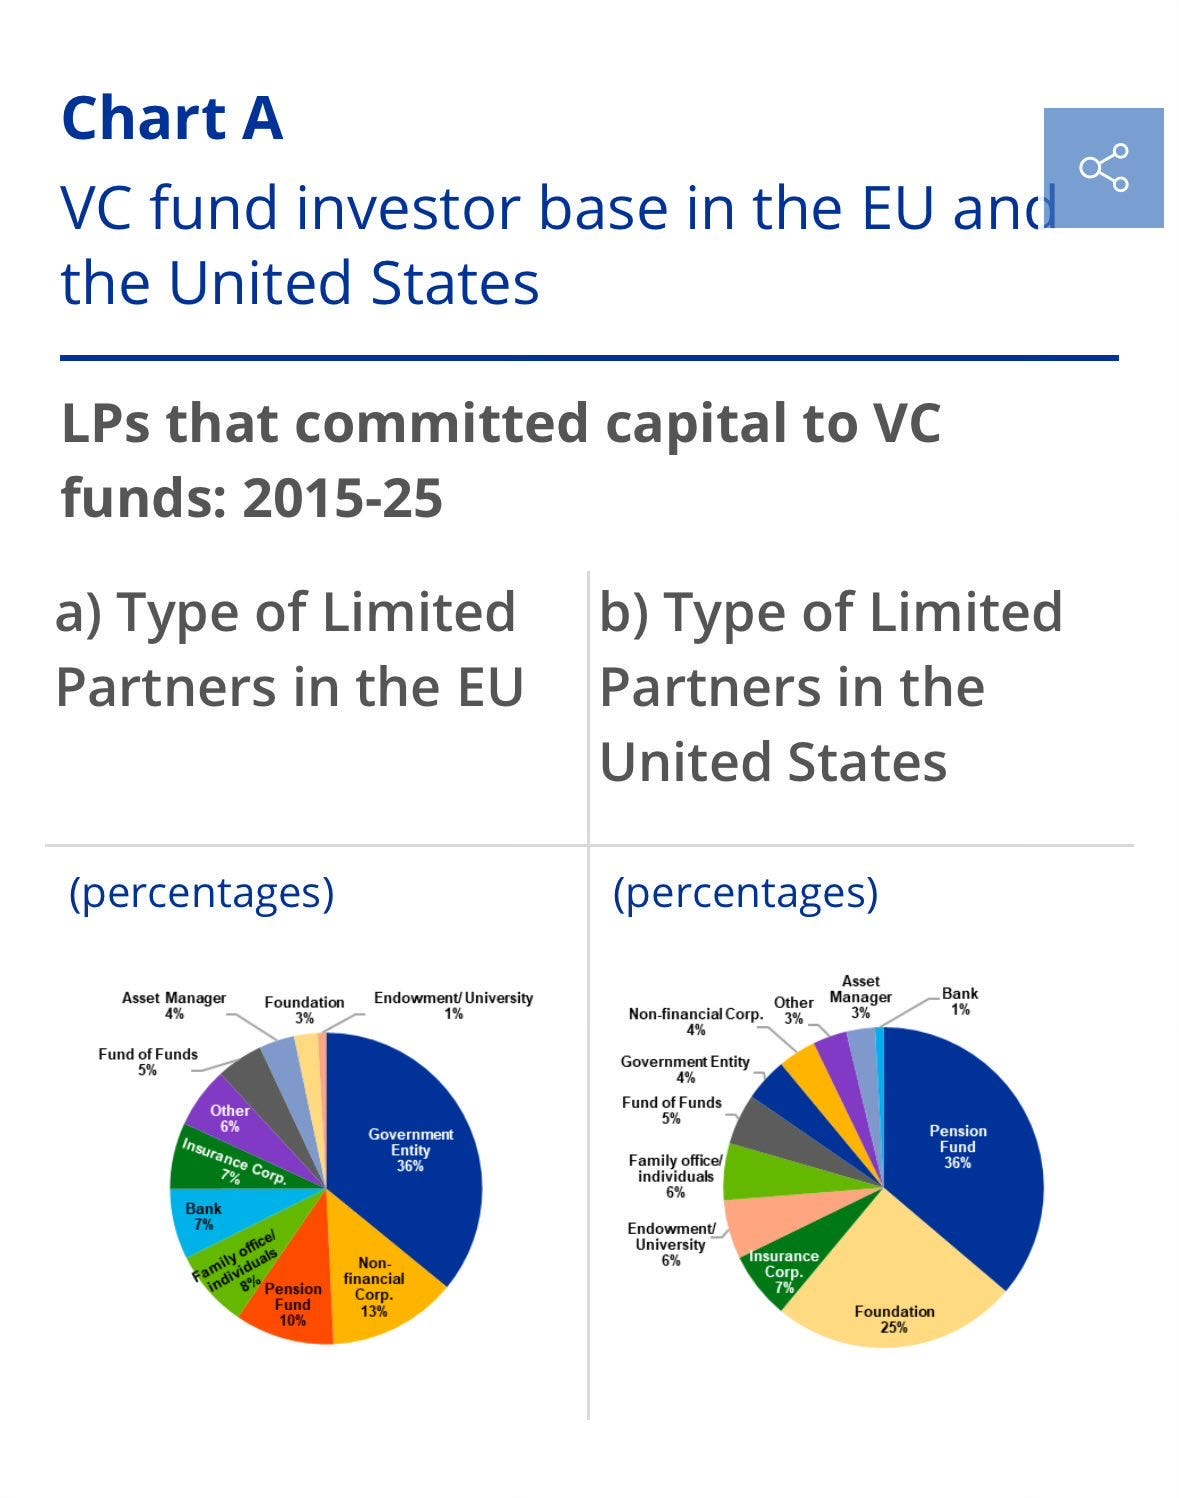
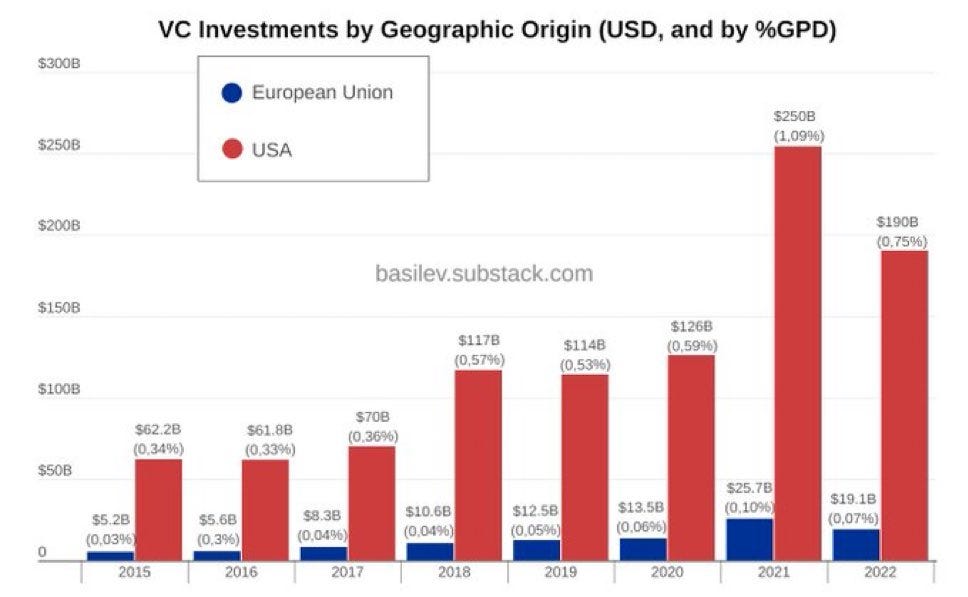
Why is US venture capital bigger than European venture capital?
Pension funds.
Because US pension funds are legally allowed to invest in riskier bets, in need of higher returns for underfunded pensions, and vulnerable to corruption.
Stanford:
Between 2001 and 2021, allocations to alternative assets went from 14% of pensions’ “risky” investments to 39%.
The researchers say the main reason for this shift is pension managers’ belief that alternative investments can yield superior returns — so-called alpha — compared to traditional investments. “Beliefs have played a central role in this crazy, giant shift in investment portfolios toward alternative assets,” Begenau says. “This goes against what many people thought: Because public pensions are underfunded and are facing a low return investment environment, they are taking on more risks and gambling with retirement savers’ money.”
UCSC Professor Bill Domhoff:
Something even bigger popped up in March 2013, when the former chief executive of the California Public Employees Retirement System (CalPERS) was indicted for stealing $14 million from one of the private firms (Apollo Global Management) that invested money for CalPERS. Apollo had been paying one of the CalPERS chief’s buddies to steer at least $48 million in CalPERS business its way, which gave Apollo the opportunity to make hundreds of millions from investing some of the pension fund’s billions. But that was apparently not enough for the chief and his partner in crime, so they perpetrated the $14 million fraud. When the chief exec left CalPERS in 2008, he too became a “placement officer” for investment firms, but the law finally caught up with him five years later.
The New York Times called the March 2013 indictment the latest in “a nationwide pay-to-play scandal that erupted several years ago. Regulators from numerous states, including California and New Mexico, have cracked down on widespread influence peddling in how their state pension funds were invested.”
Sources: European Central Bank, Basile Verhulst (Article), Stanford, Bill Domhoff
If one looks carefully at these holders of competitive, capitalist company securities, one thing jumps out distinctly: they are not themselves competitive, capitalist organizations. Virtually all of them share a single form: a monopoly enforced by government regulation. As a Canadian, I have no choice as to where the pension contributions that are legally deducted from my paycheck go. Whether I like it or not they are sent to the Canadian Pension Plan Investment Board. CPPIB is granted a monopoly right by the Government of Canada to serve me (except in Quebec, where the relevant and equivalent monopoly body is the Caisse de Dépôt et Placement du Québec).
Drucker was right, especially if you lump traditional pension funds along with their sovereign wealth fund cousins. The top 350 pension and sovereign wealth funds control just under $20 trillion of assets. They are the largest holders of securities in for-profit organizations competing in democratic capitalist environments. Of course, the funds have holdings in securities in non-competitive vehicles too, such as government issued securities. But Drucker was principally concerned about their holdings of the means of capitalist production.
Drucker was right, especially if you lump traditional pension funds along with their sovereign wealth fund cousins. The top 350 pension and sovereign wealth funds control just under $20 trillion of assets. They are the largest holders of securities in for-profit organizations competing in democratic capitalist environments. Of course, the funds have holdings in securities in non-competitive vehicles too, such as government issued securities. But Drucker was principally concerned about their holdings of the means of capitalist production.
…
Capitalism has broad support because of a general belief in the power of competition, free entry to industries, and customer choice to produce increasing productivity and high levels of innovation. However, the ownership of those actively competing companies is increasingly in the hands of organizations that face zero competition, no threat of entry, and have customers who are forced to use them.
Why is putting the economy in the hands of regulated monopolists is a good idea?
…
But the broad history of regulated monopolies is not inspiring. Without the forcing mechanisms of competition, entry, and choice, monopolies slowly but surely gravitate to serving themselves, not their customers. That is why your cable TV provider probably won’t tell you specifically when between 9 am and 1 pm the repairman will arrive to fix your defective cable connection. Although the company caused the problem, you are responsible for accommodating a schedule that is convenient to them not you, or they won’t fix their error. Who is being served here?
If we really believe in competition and choice, then a big question we should all be asking ourselves today is what should be done about our monopolistic pension system?
Source: Harvard Business Review
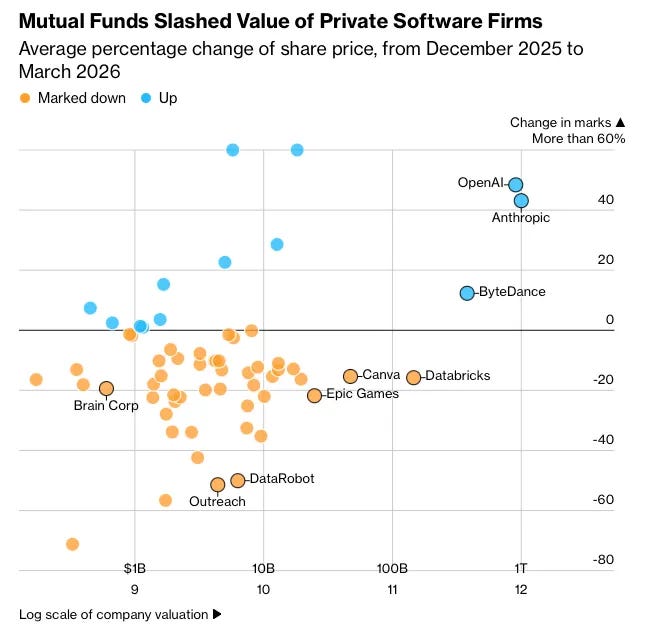
Private software markdowns are piling up across mutual funds.
Mutual funds marked down ~50 private software companies by an average of 20% in Q1, suggesting tens of billions in paper losses across private markets.
Steepest markdowns:
- Outreach: -51.4%
- DataRobot: -50.8%
- Epic Games: -22% (KKR)
- Databricks: -16% (BlackRock, Tiger Global, Insight)
- Canva: -15% (Coatue)
Meanwhile, AI + semi companies were marked up 40% on average.
Source: Wall Street Rollup
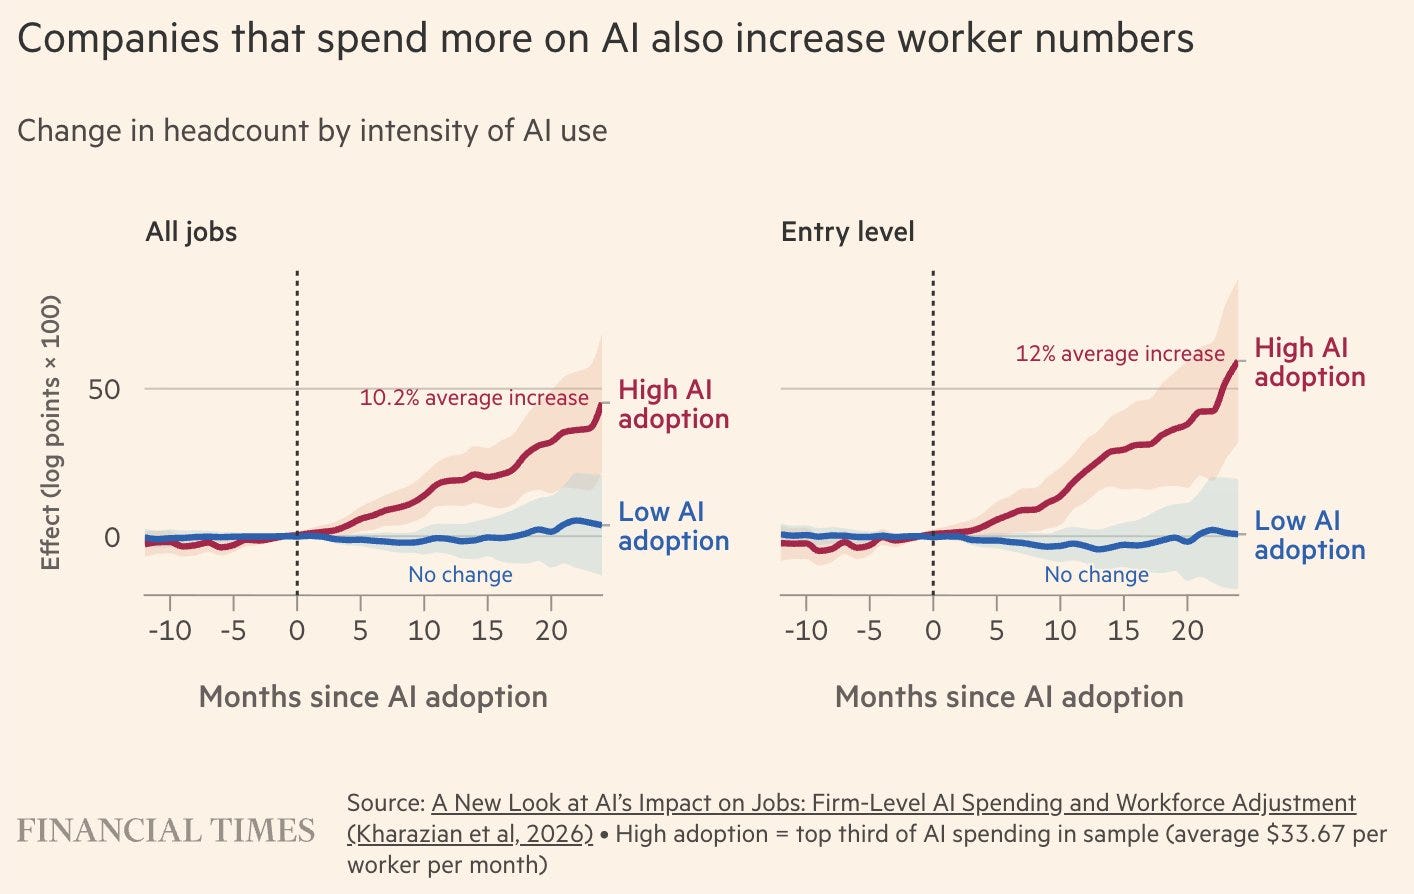
You may have seen a variety of tech bros praise the latest study from Ramp that was featured in the Financial Times. It claimed that the firms who adopt AI the most also hire the most, whereas firms who adopt AI the least also have relatively stagnant employment growth. The takeaway is that AI critics are wrong in their fears about AI taking away jobs. If AI produces more jobs, then there’s even more of a reason to adopt AI even faster.
However, while this study’s raw data is fine, the study’s final analysis, presentation and marketing are terribly biased and misinterpreted.
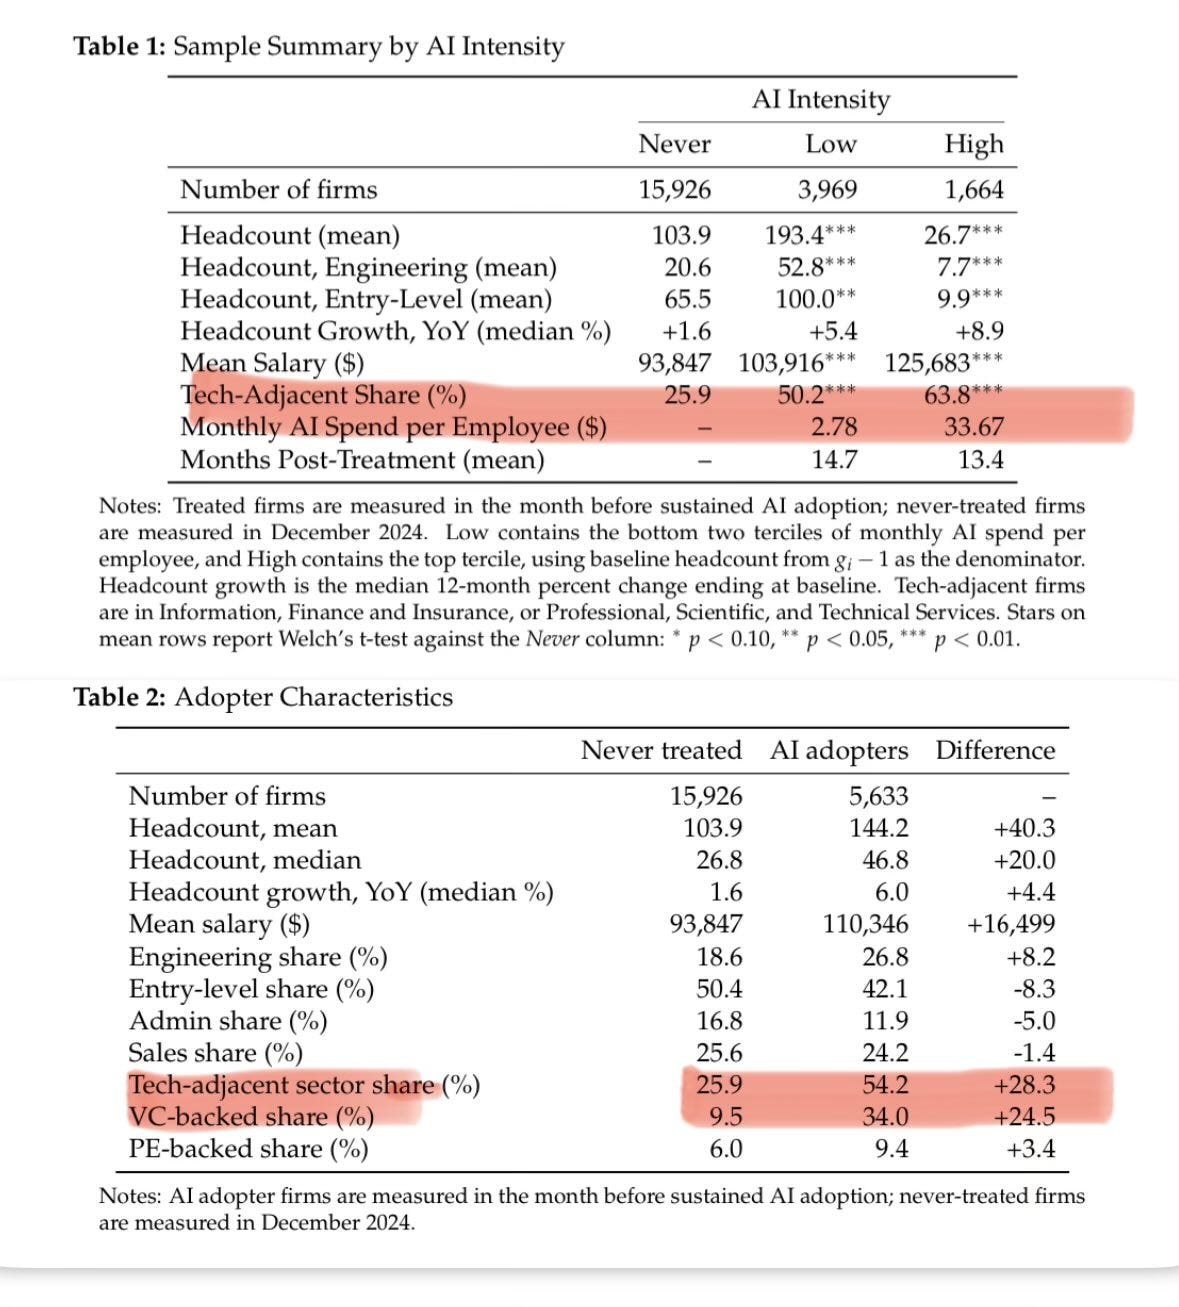
All this study did was compare Silicon Valley venture-backed startups to the rest of the economy. High relative employment growth is baked into the cake because that’s what tiny startups do when they get millions of dollars in venture capital.
The study simply showed venture capital fueled headcount expansion in tiny firms, as the high AI intensity firms. Those firms are 1/8 the mean headcount of low AI intensity firms (or normal companies), according to the study’s own data.
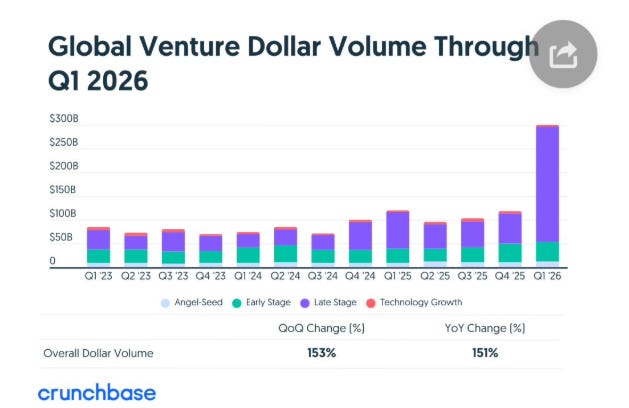
The literal figures used are actually a comparison of high intensity early adopters to late adopters not raw headcount growth. This shows the bifurcation of Silicon Valley into AI bubble startups and non-AI startups that got atrophied on the vine. Venture capital funding into AI startups reached an all-time-high of 80 percent of total global venture capital funding in Q1 2026.
The low intensity cohort (normal companies) is so big that the comparison figure is diluted and thus there’s no stark difference between early and late adopters. Thus, this is a methodology that artificially gooses up the high intensity AI cohort and gooses down the low intensity AI cohort. The study’s summary statistics also stated raw median YoY headcount growth was 1.6% for never adopted AI, 5.4% for low intensity AI adoption, and 8.9% for high intensity AI adoption. Not nearly as stark a contrast.
The FT article that publicized this study even included an economist moderately hinting at this:
One labour economist told the FT that the results, while interesting, should be interpreted with caution, particularly as the groups using AI most in the sample tended to be smaller. “‘Intense AI adopters grow faster’ and ‘small fast-growing start-ups buy a lot of AI quite early’ seems hard to separate here,” he said.
In other words, the Ramp study is a rump.
Sources: Ramp, Financial Times
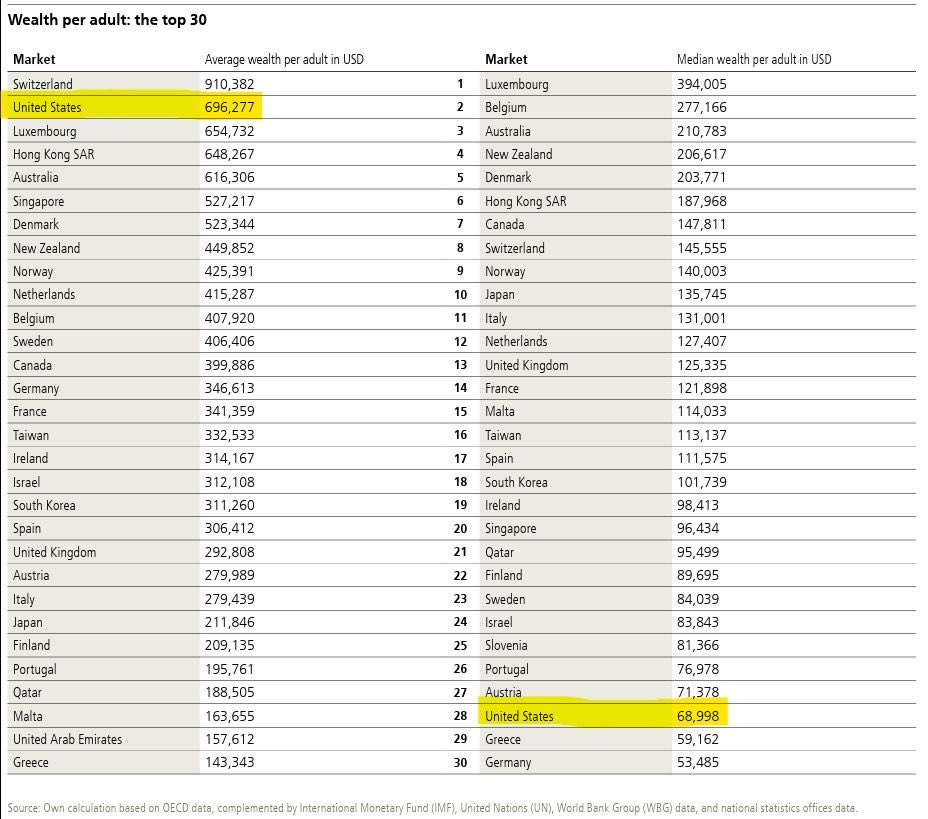
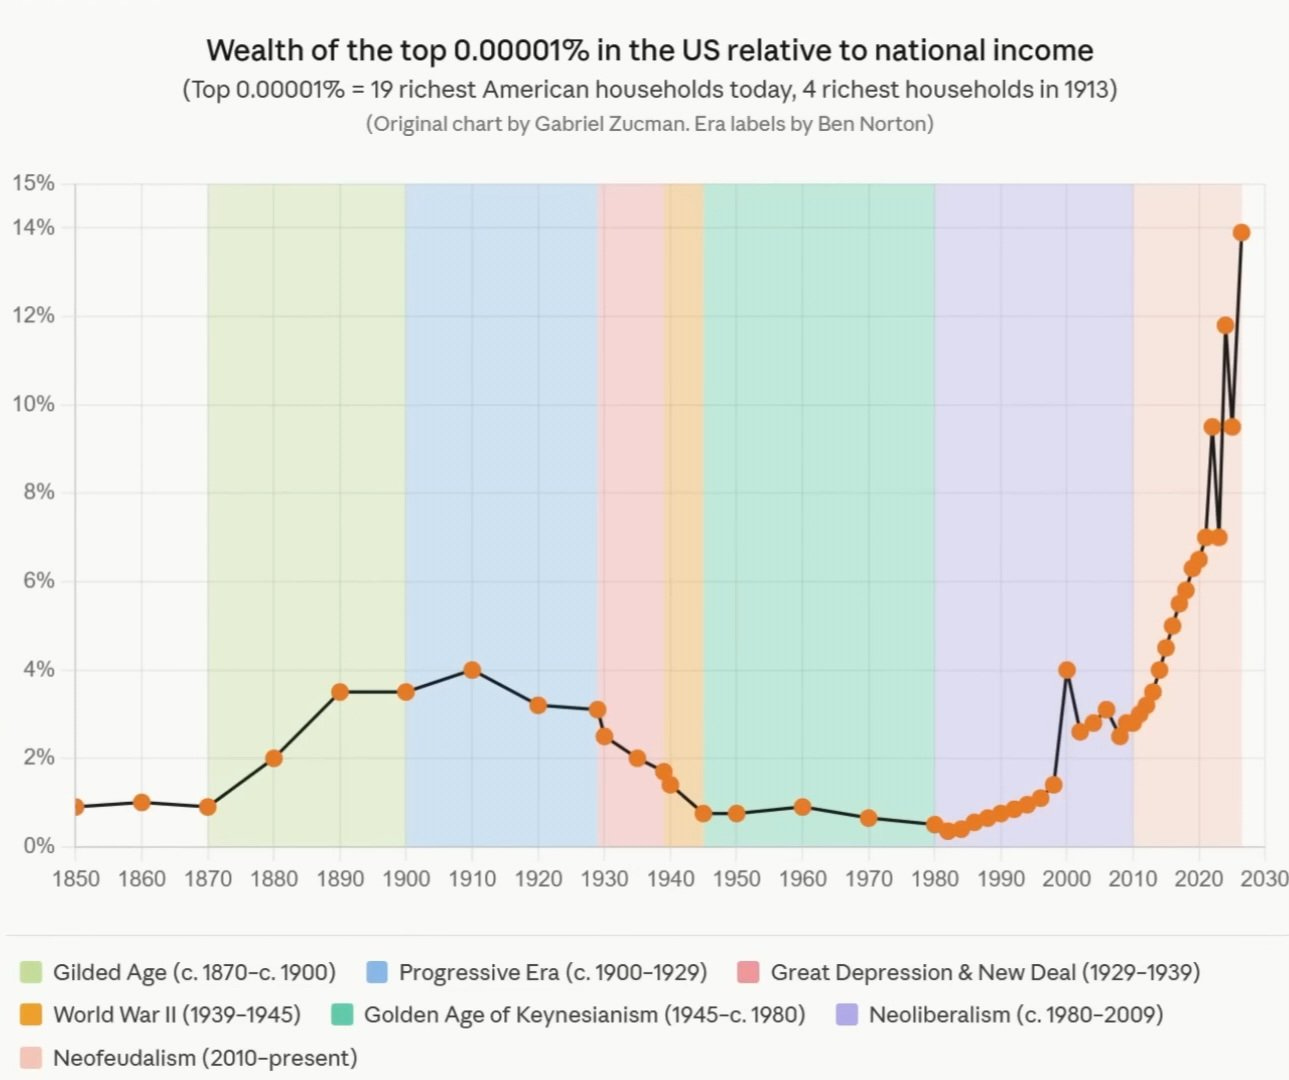
Source: Ben Norton (Post)
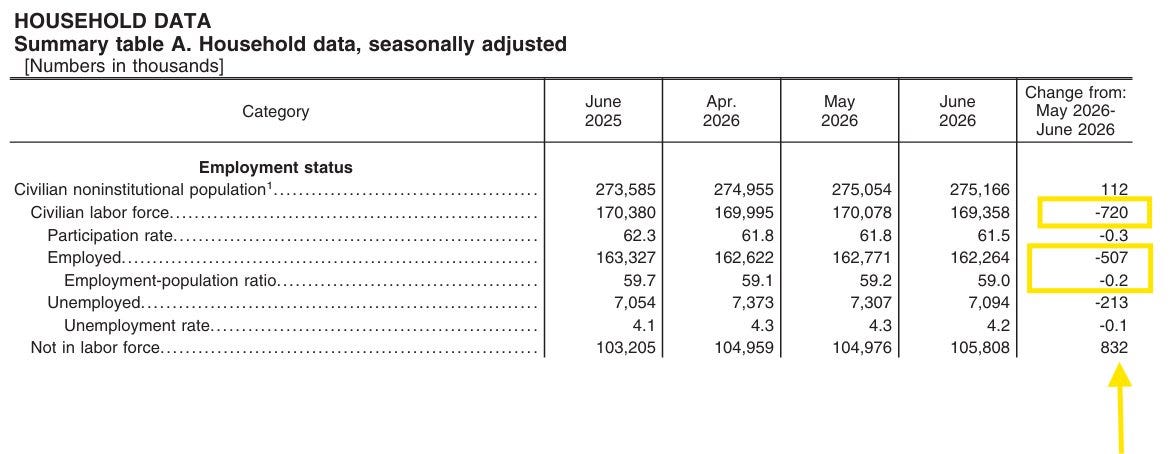
The unemployment rate fell to 4.2%, the lowest in a year.
Normally that’s good news, but not this time.
-720,000 people left the labor force. They aren’t even looking for jobs anymore.
-507,000 people are no longer employed.
The employment-to-population ratio fell to 59%, the lowest in about 5 years (since Oct. 2021).
Source: Heather Long
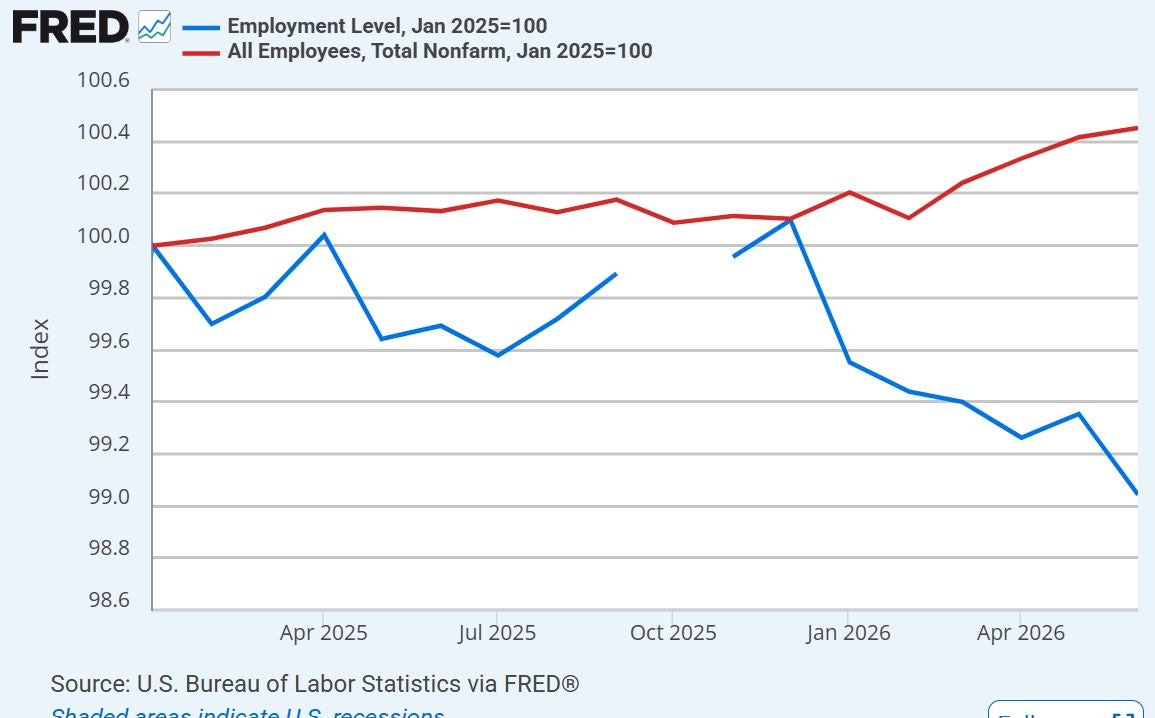
Source: Bob Elliott (Post)
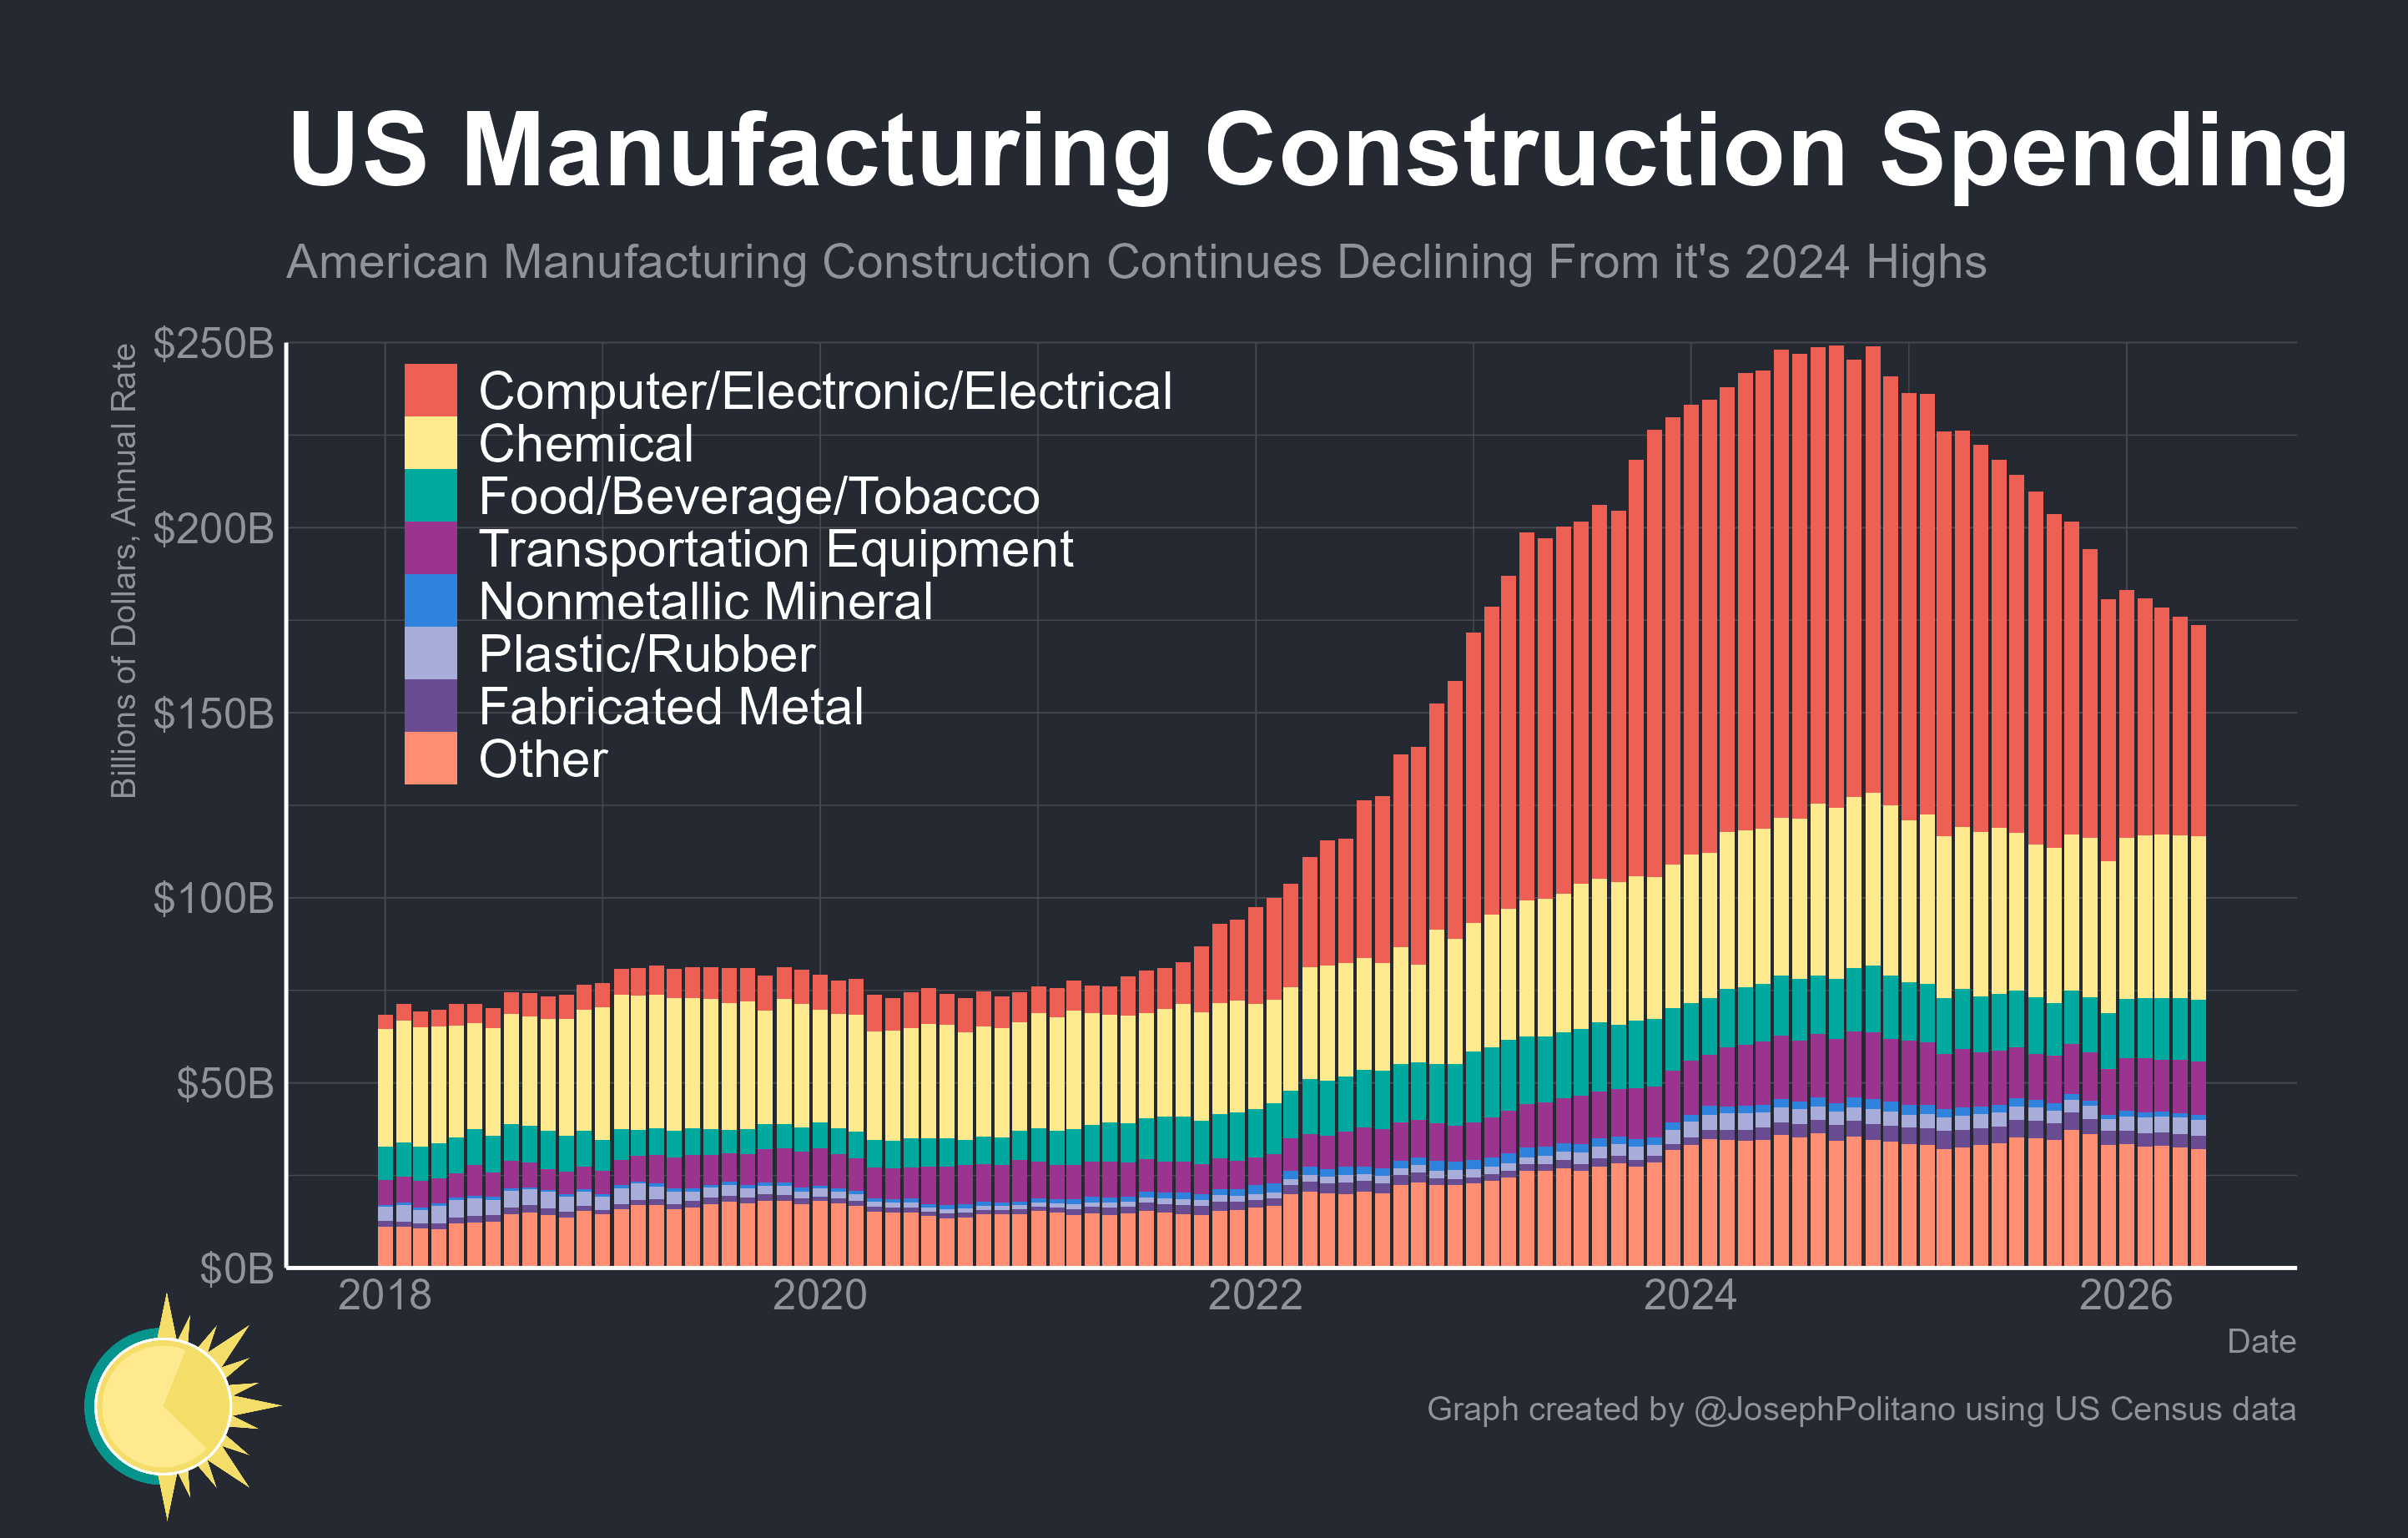
American factory construction continued declining in official data released today as CHIPS Act projects finish, IRA projects get cancelled, and tariffs weigh on nearly all industries
Total US factory construction is down 30% from its 2024 highs and 20% over the last year alone
Source: Joseph Politano (Post)
In setting liquidity requirements for stablecoin issuers, the policy question is less about whether they need liquidity requirements (they plainly do) than about how those requirements should be designed. The dominant approaches in existing financial regulation offer two broad templates: uniform portfolio composition standards, as in SEC Rule 2a-7 governing money market funds, and stress-based buffer requirements calibrated to each institution’s risk profile, as in the Basel III Liquidity Coverage Ratio (BCBS, 2013).
…
The GENIUS Act establishes a reserve asset menu for stablecoin issuers: cash, Federal Reserve balances, demand deposits at insured depository institutions (not the same thing as insured deposits), short-term Treasuries, Treasury-backed repurchase agreements, and shares of government MMFs investing in these assets. Congress left it to the primary federal stablecoin regulators to establish liquidity requirements, leaving the form of those requirements to regulatory discretion.
…
MMF-style rules create predictable, uniform minimum portfolio compositions rather than risk-sensitive, institution-specific buffers. That approach has logic in a mature, homogeneous industry. But stablecoins are an emerging and evolving market, and issuers may turn out to vary considerably in their business models, risk profiles, and funding structures. A one-size-fits-all standard may be harder to justify as that diversity becomes clearer
…
The OCC’s 10 percent daily floor is lower than the 25 percent required of government MMFs, but that comparison understates other aspects of the proposed stablecoin framework. The qualifying asset definitions, WAM cap, and maximum maturity limits are all considerably more restrictive than their MMF equivalents, although redemption timing is somewhat more lenient, allowing up to T+2 versus T+1 for government funds.
Of those differences, the qualifying asset definitions may have the most consequential practical effect. Under SEC Rule 2a-7, government MMFs can count cash, bank deposits, U.S. Treasury securities of any maturity, and securities maturing within one business day toward their daily liquidity requirement. By contrast, stablecoin issuers can count only demand deposits at banks or credit unions and Federal Reserve balances.
…
Deposit concentration. Although the OCC’s concentration limit requires issuers to keep less than 50 percent of their daily reserve at any one bank (and 40 percent of all reserves), they likely will gravitate toward the largest banks, which have the most robust operational infrastructure, the deepest relationships, and the implicit market expectation of too-big-to fail protection that makes uninsured deposits as good as insured. Stablecoin reserves likely will concentrate at the top of the banking system.
Credit disintermediation of community banks. Community banks rely on deposit funding to originate small-business loans, mortgages, and other local credit. A regulatory structure that channels stablecoin reserves toward large institutions could disadvantage community lenders and their customers. As stablecoin issuance grows and depositors substitute toward stablecoins, reserves concentrate at large banks. Community banks that would otherwise hold those deposits lose a corresponding funding base, which could constrain their lending capacity.
…
Deposit placement networks address the distributional and credit-risk consequences of the qualifying asset definition and the always-on nature of the policy. They do not resolve the underlying question of whether uniform thresholds are the right calibration instrument for a sector this heterogeneous; a question the OCC’s own capital framework, with its issuer-by-issuer approach, implicitly acknowledges.
…
Bottom Line
The OCC’s stablecoin liquidity framework reflects a reasonable first instinct: stablecoins are demandable at par, and reserve assets must be genuinely liquid. But the instrument chosen is blunt. By restricting daily liquidity to bank deposits and Fed balances, the framework risks pushing issuers toward large, uninsured deposit concentrations with predictable consequences for credit risk and the competitive position of community banks. The always-on ratio design compounds this problem; because issuers at the threshold cannot draw on their daily liquid assets to fund redemptions without immediately falling into breach, prudent issuers will hold deposits above the stated minimum as a precautionary buffer, further increasing uninsured deposit exposure beyond what the rule’s face terms imply.
Both problems are better addressed under Option A’s principles-based safe harbor, which preserves the regulatory discretion to treat buffer drawdowns in genuine stress as prudent rather than non-compliant, than under Option B’s binding minimums. Deposit placement networks offer a practical complement, maximizing FDIC coverage and redistributing reserves toward the smaller banks most exposed to stablecoin-driven outflows. As issuance grows, the case for recalibrating these thresholds to reflect each issuer’s actual risk profile will only strengthen.
Source: Rashad Ahmed (Andersen Institute for Finance & Economics)

Albert Pinto@70sBachchan
Industrial policy sometimes has "Governments picking winners." But it just as often has "Losers picking Governments" US AI companies losing to open-source Chinese AI companies are likely to go to US govt to create themselves a 'moat'

5:11 PM · Jun 26, 2026 · 3.04K Views
1 Reply · 10 Reposts · 28 Likes
Source: Tim Sahay
Has Ireland factored in the risk of its exposure to US dollar-denominated assets as countries turn away from the once safe asset amid an escalating geopolitical conflict in the Middle East, the risk of an AI bubble and an economic war that essentially upended the hitherto unimpeded post-Cold War free trade model?
Ireland’s economic miracle has never been purely Irish but rather a mirage of American statecraft. It has been embedded within an American financial order that encouraged capital to flow abroad in search of higher returns, to the detriment of the US worker and benefit of asset holders. If that order changes either through geopolitics, protectionism or the erosion of dollar dominance, Ireland may discover that its greatest economic strength has also been its greatest vulnerability.
It’s safe to say that Ireland has largely benefited from Pax Americana, but it may soon wake up from its American dream to a pretty bad hangover.
Source:
Thanks for reading Ryan Research! This post is public so feel free to share it.
Economics of Soccer
·
Jul 10

The US men’s soccer team disappointed fans in the 2026 World Cup which produced a debate over why they regularly under-perform. One of the biggest reasons given is that US youth soccer is so expensive that only “rich kids” can play and thus a smaller talent pool of pay-to-play players get pushed t…
Ireland's Tech Fork in the Road
·
Jun 19

Ireland stands at a tech fork in the road: double down on its reliance on American tech giants, or begin the difficult shift towards European tech sovereignty. One well-trodden path leads to dependence and distortion. The other calls for radical change but points towards independence and development. Ireland’s choice will determine the success or failur…
Piketty vs. Reinert on Economic Development
·
Jun 9

Recently, famous economist Thomas Piketty (known for his 2013 book, Capital in the Twenty-First Century) and his collaborators at the World Inequality Lab published the Global Justice Report. The report advocates decreasing material sectors and increasing immaterial sectors across the globe while conducting …
No posts
Comments
Nothing yet. Say the first thing.
Sign in to join the conversation.