
With the national average gas price hitting $4.48 per gallon this morning – higher than it has been in nearly four years – we wanted to step back and assess the broader impact of Trump Administration policy choices on household budgets.
This year, three prominent, quantifiable policies are affecting household budgets: higher gas prices from the war with Iran; higher goods prices from tariffs, which the Administration has scrambled to keep in place after the Supreme Court invalidated the original authority; and increased tax refunds from the One Big Beautiful Bill Act, Trump’s signature tax law.
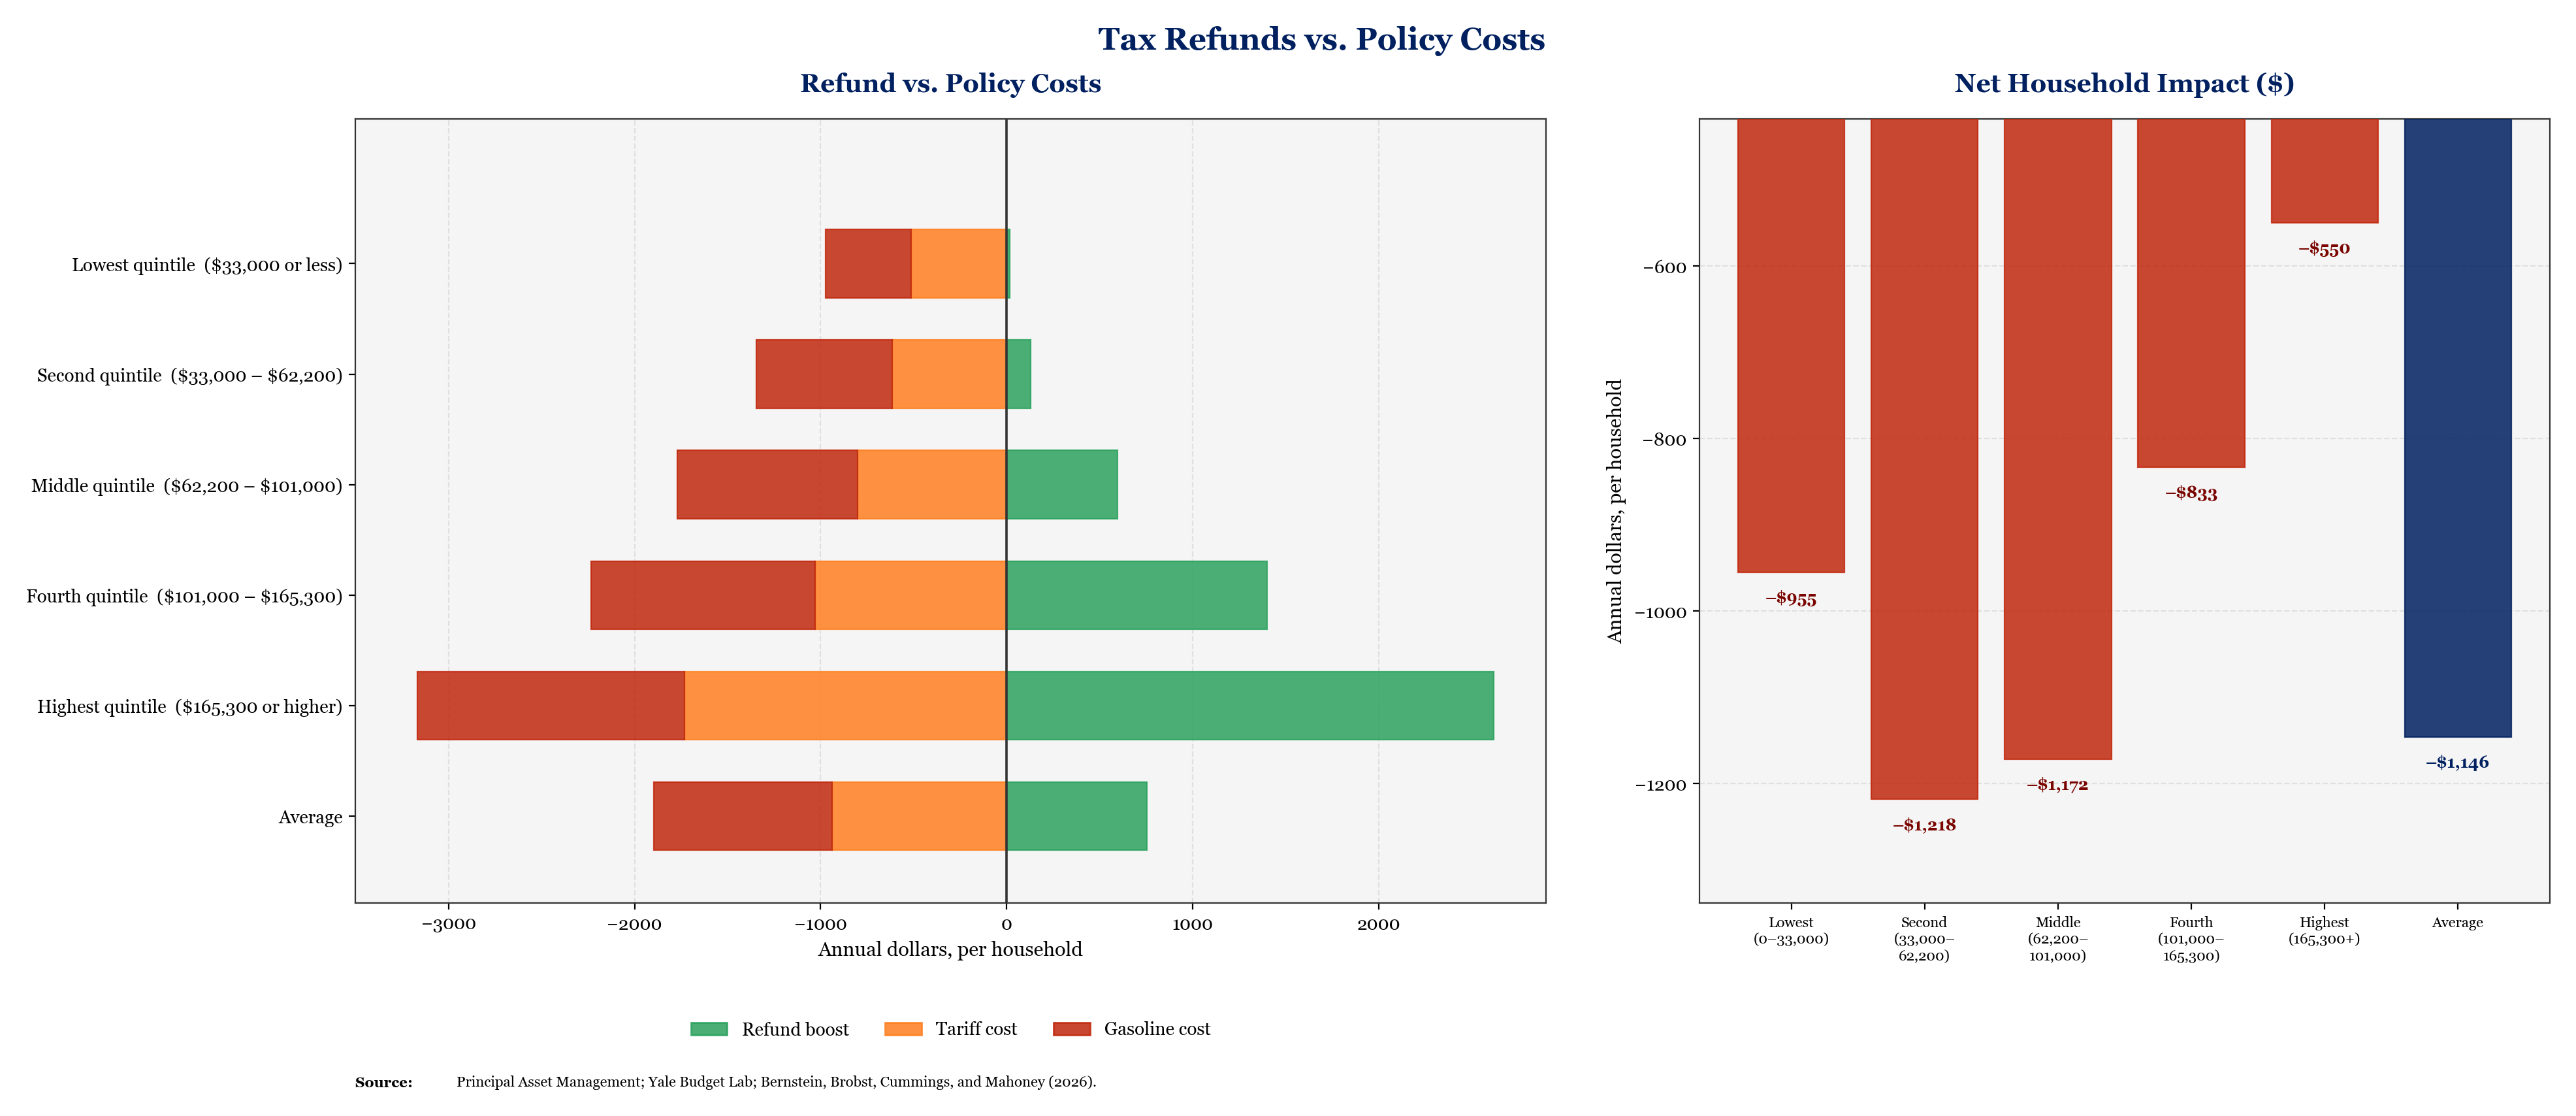
We estimate the combined impacts of these three policies for the average household and separately by household income group. We find that the average household will have its budget squeezed by more than $1,100 this year due to these three policies, with the biggest impacts for middle-class families and the smallest impacts for the top 20 percent.
Details
To measure the impact of higher gasoline prices, we created a statistical model to estimate the relationship between crude oil and gasoline prices, and use Goldman Sachs’ most recent crude oil price forecast to predict retail gas prices.[1] Because Goldman expects oil prices to be elevated throughout the year, we anticipate that gasoline prices will, on average, be roughly a dollar/gallon higher than they would have been without the war.
For the impact of tariffs, we use an analysis from the Yale Budget Lab (YBL), which models the impact of tariffs on prices and applies those estimates to consumer spending patterns to compute the dollar burden by income group.
For the impact of the OBBBA refunds, we use an analysis by Principal Asset Management (PAM), which estimates the additional tax refunds by income group.
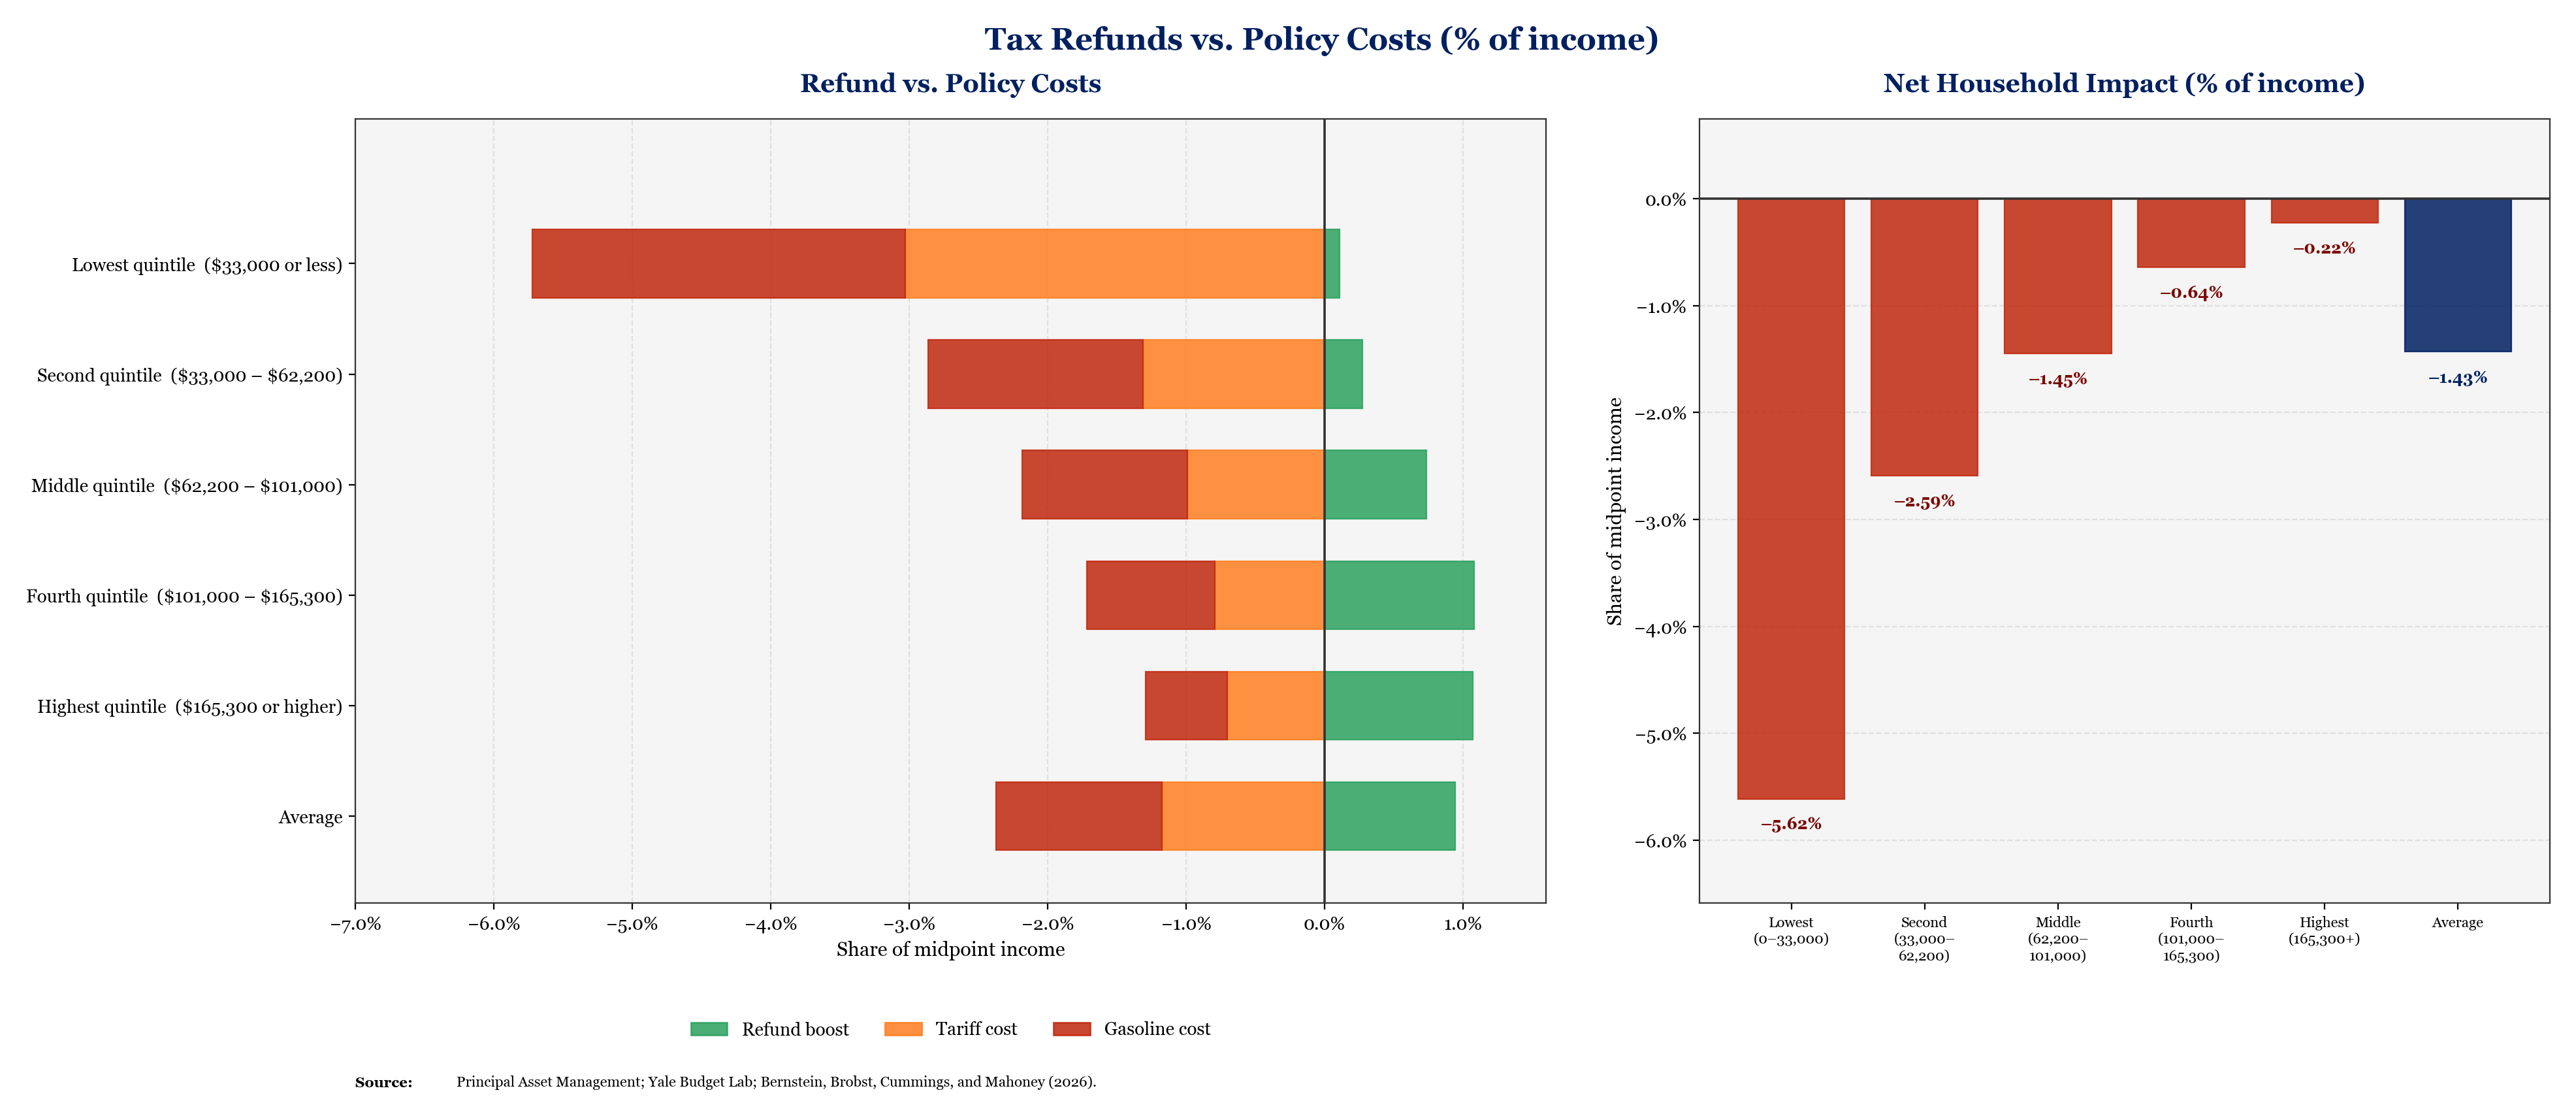
As the chart above shows, the combined impacts in dollars are largest for the middle-income households and lowest for the top quintile. When represented as a share of income, the pattern becomes highly regressive, with losses of more than 5% of income for the lowest quintile and less than 0.5% for the top quintile.
[1] To estimate impacts by income quintile, we combine our price forecast with expenditure data from the Consumer Expenditure survey by income group. On an aggregate basis, our estimates imply that households will collectively spend roughly $129 billion more on gasoline this year than they would have without the war.
No posts
Comments
Nothing yet. Say the first thing.
Sign in to join the conversation.