
Welcome to the first post of “Sunny Sci’d Up”! I’m Dr. Ryan French, an astrophysicist researching the Sun for a career. I am also a science communicator and author, sharing the wonders of the Sun and space to anyone who will listed (if you’re reading this – I suppose that includes you!)
This Substack is designed to be a monthly newsletter updating you on the comings and goings of the Sun. Solar flares, eclipses and progression of the solar cycle – we’ll cover that all here. This first post will be somewhat experimental, with the custom graphics and information included below likely to change in the coming months. I welcome feedback on what works and what doesn’t. Enjoy!
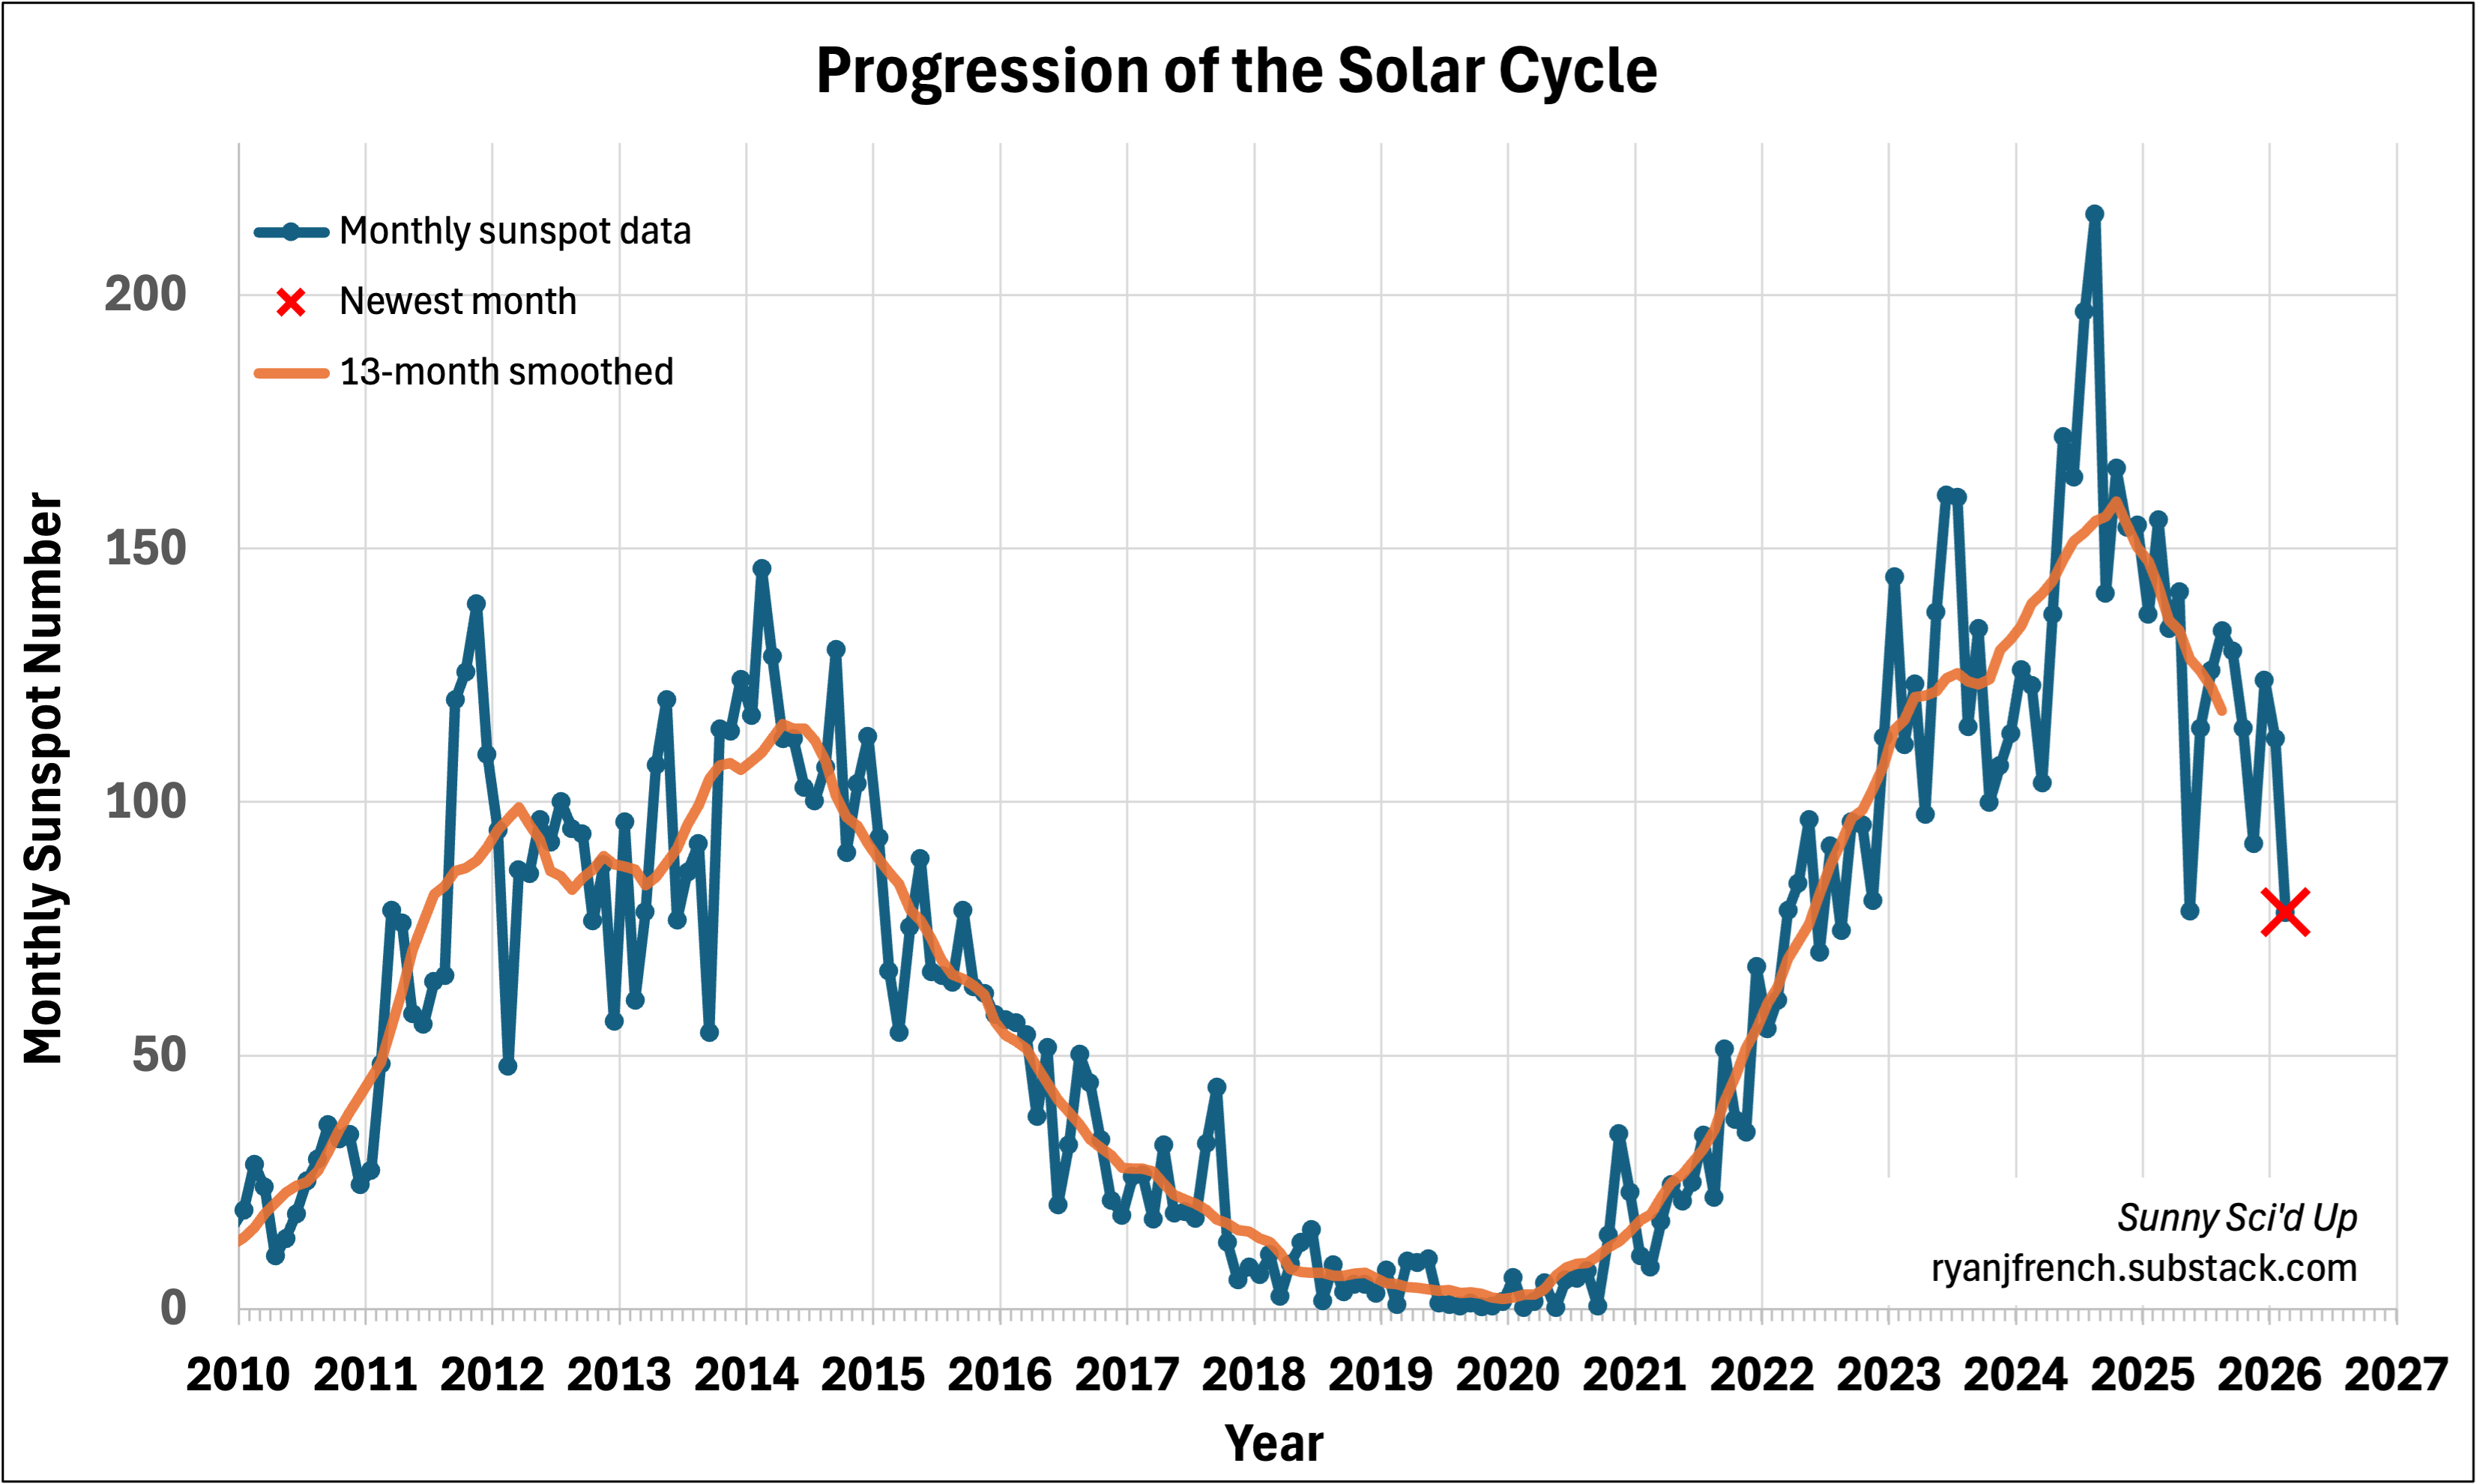
The Sun follows an 11-year cycle of increasing and decreasing activity, most easily followed by simply counting the number of sunspots on the Sun each month. This is shown as the blue curve in the graph below, with February 2026’s count marked by the red ‘X’. Last month saw a dramatic drop in sunspot numbers (due mainly to low activity during the second half of the month), resulting in the lowest monthly sunspot number since November 2022. This reinforces the clear picture that we are now well inside the ‘declining phase’ of the solar cycle, heading towards solar minimum in a few years. Strong solar flares and solar storms will still happen during this phase (perhaps even bringing the strongest activity of this cycle so far), but they’ll be less of them.
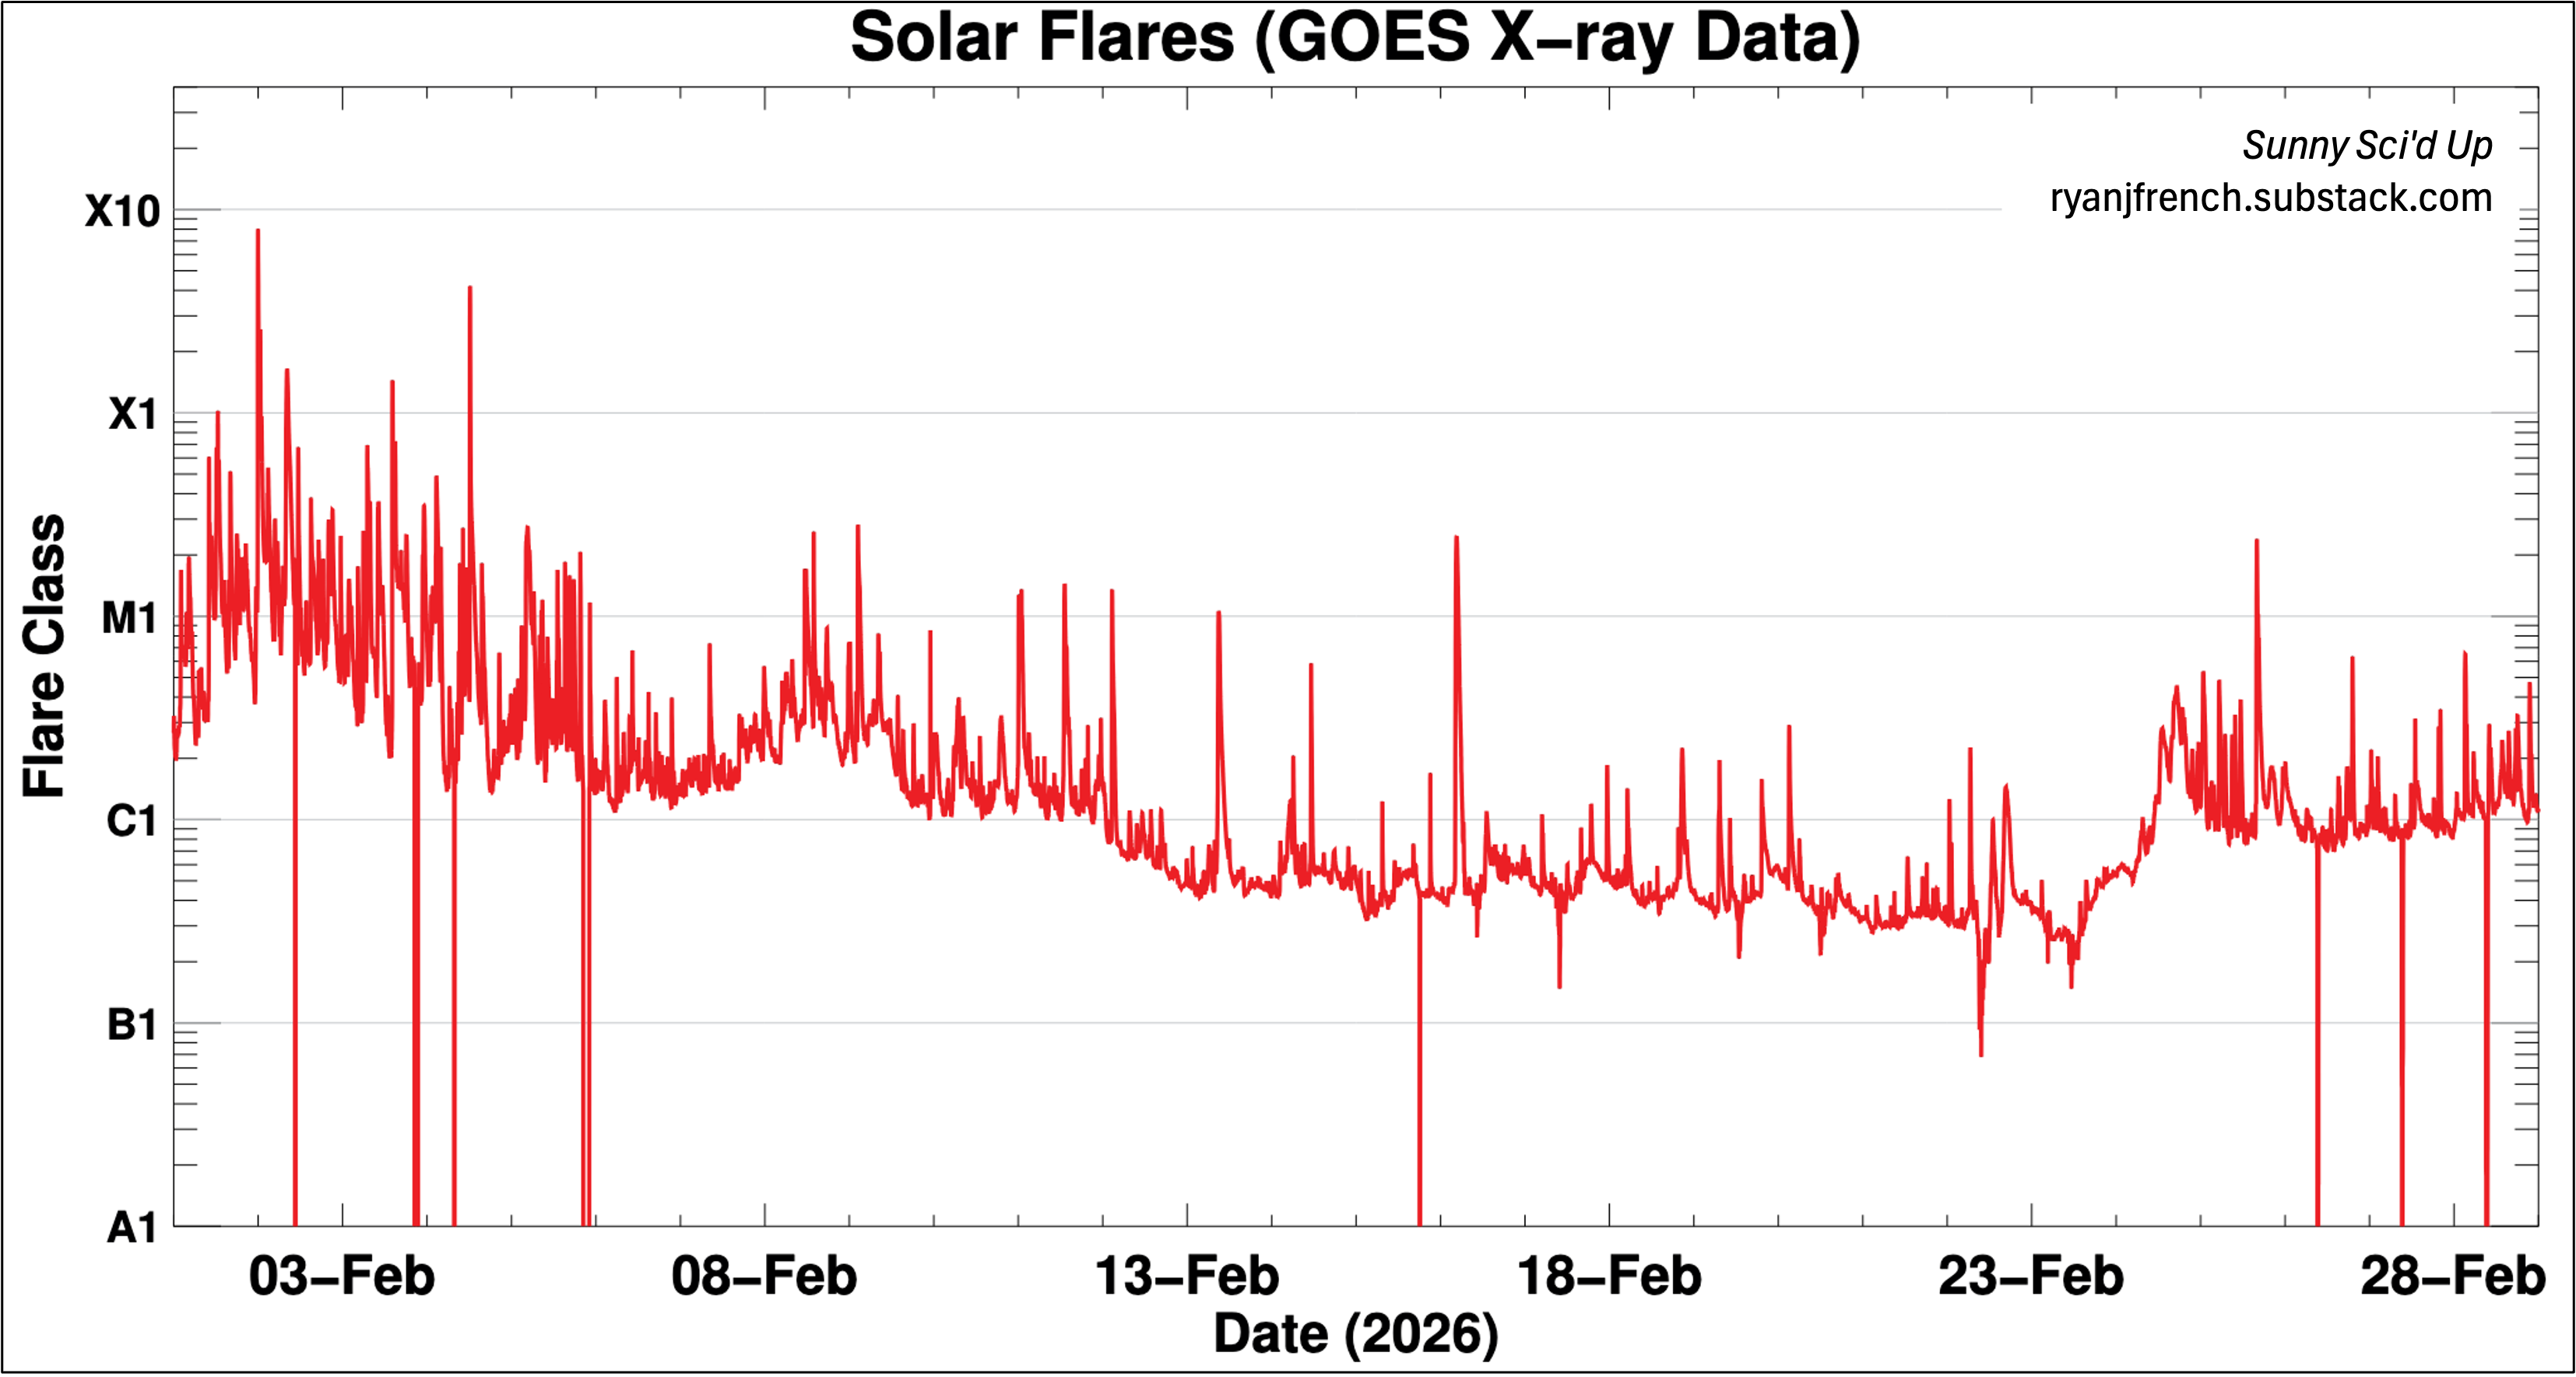
February 2026 was very much a month of two halves on the Sun. The first week of the month brought a number of strong flares, including an X8.11-class event – the strongest of 2026 (and third largest since 2017). This event was joined by five other X-class events (six in total), and many M-class flares. Each solar flare is measured by a spike in X-rays observed from the Sun, shown in the graph below. As you can see by the decline in the red line, solar activity did not persist for long. By the middle of the month, the Sun was bare (giving us the first ‘sunspot-less’ day in many years) – producing only two M-class flares over the latter half of the month.
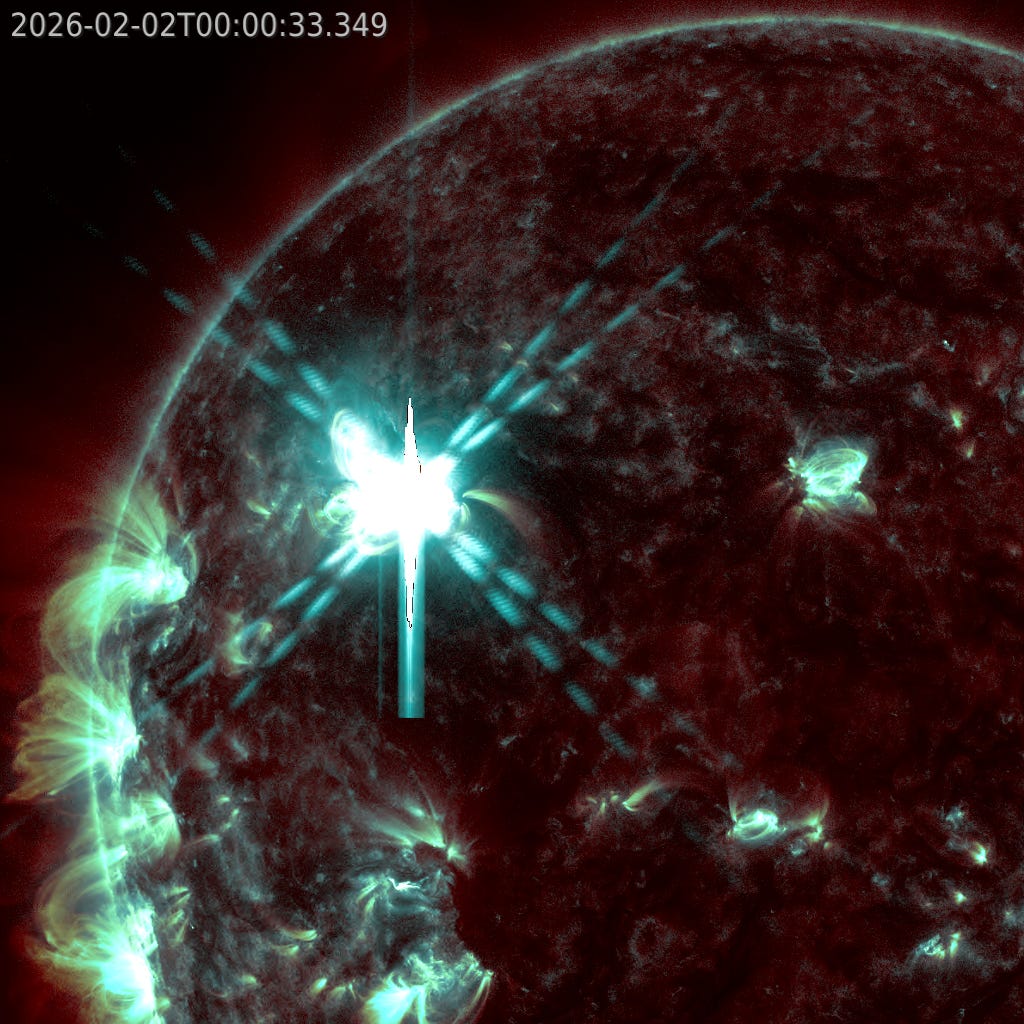
Here is an image of the X8.11-class on February 1st/2nd. The image shows a composite of data from NASA’s Solar Dynamics Observatory, processed by me. The turquoise colour shows emission from hot material at temperatures of 10 million ˚C, and red much emission from ‘cooler’ (relatively) plasma of 1 million ˚C. The ‘X’ shape is caused by diffraction within the telescope (and not a real feature on the Sun).
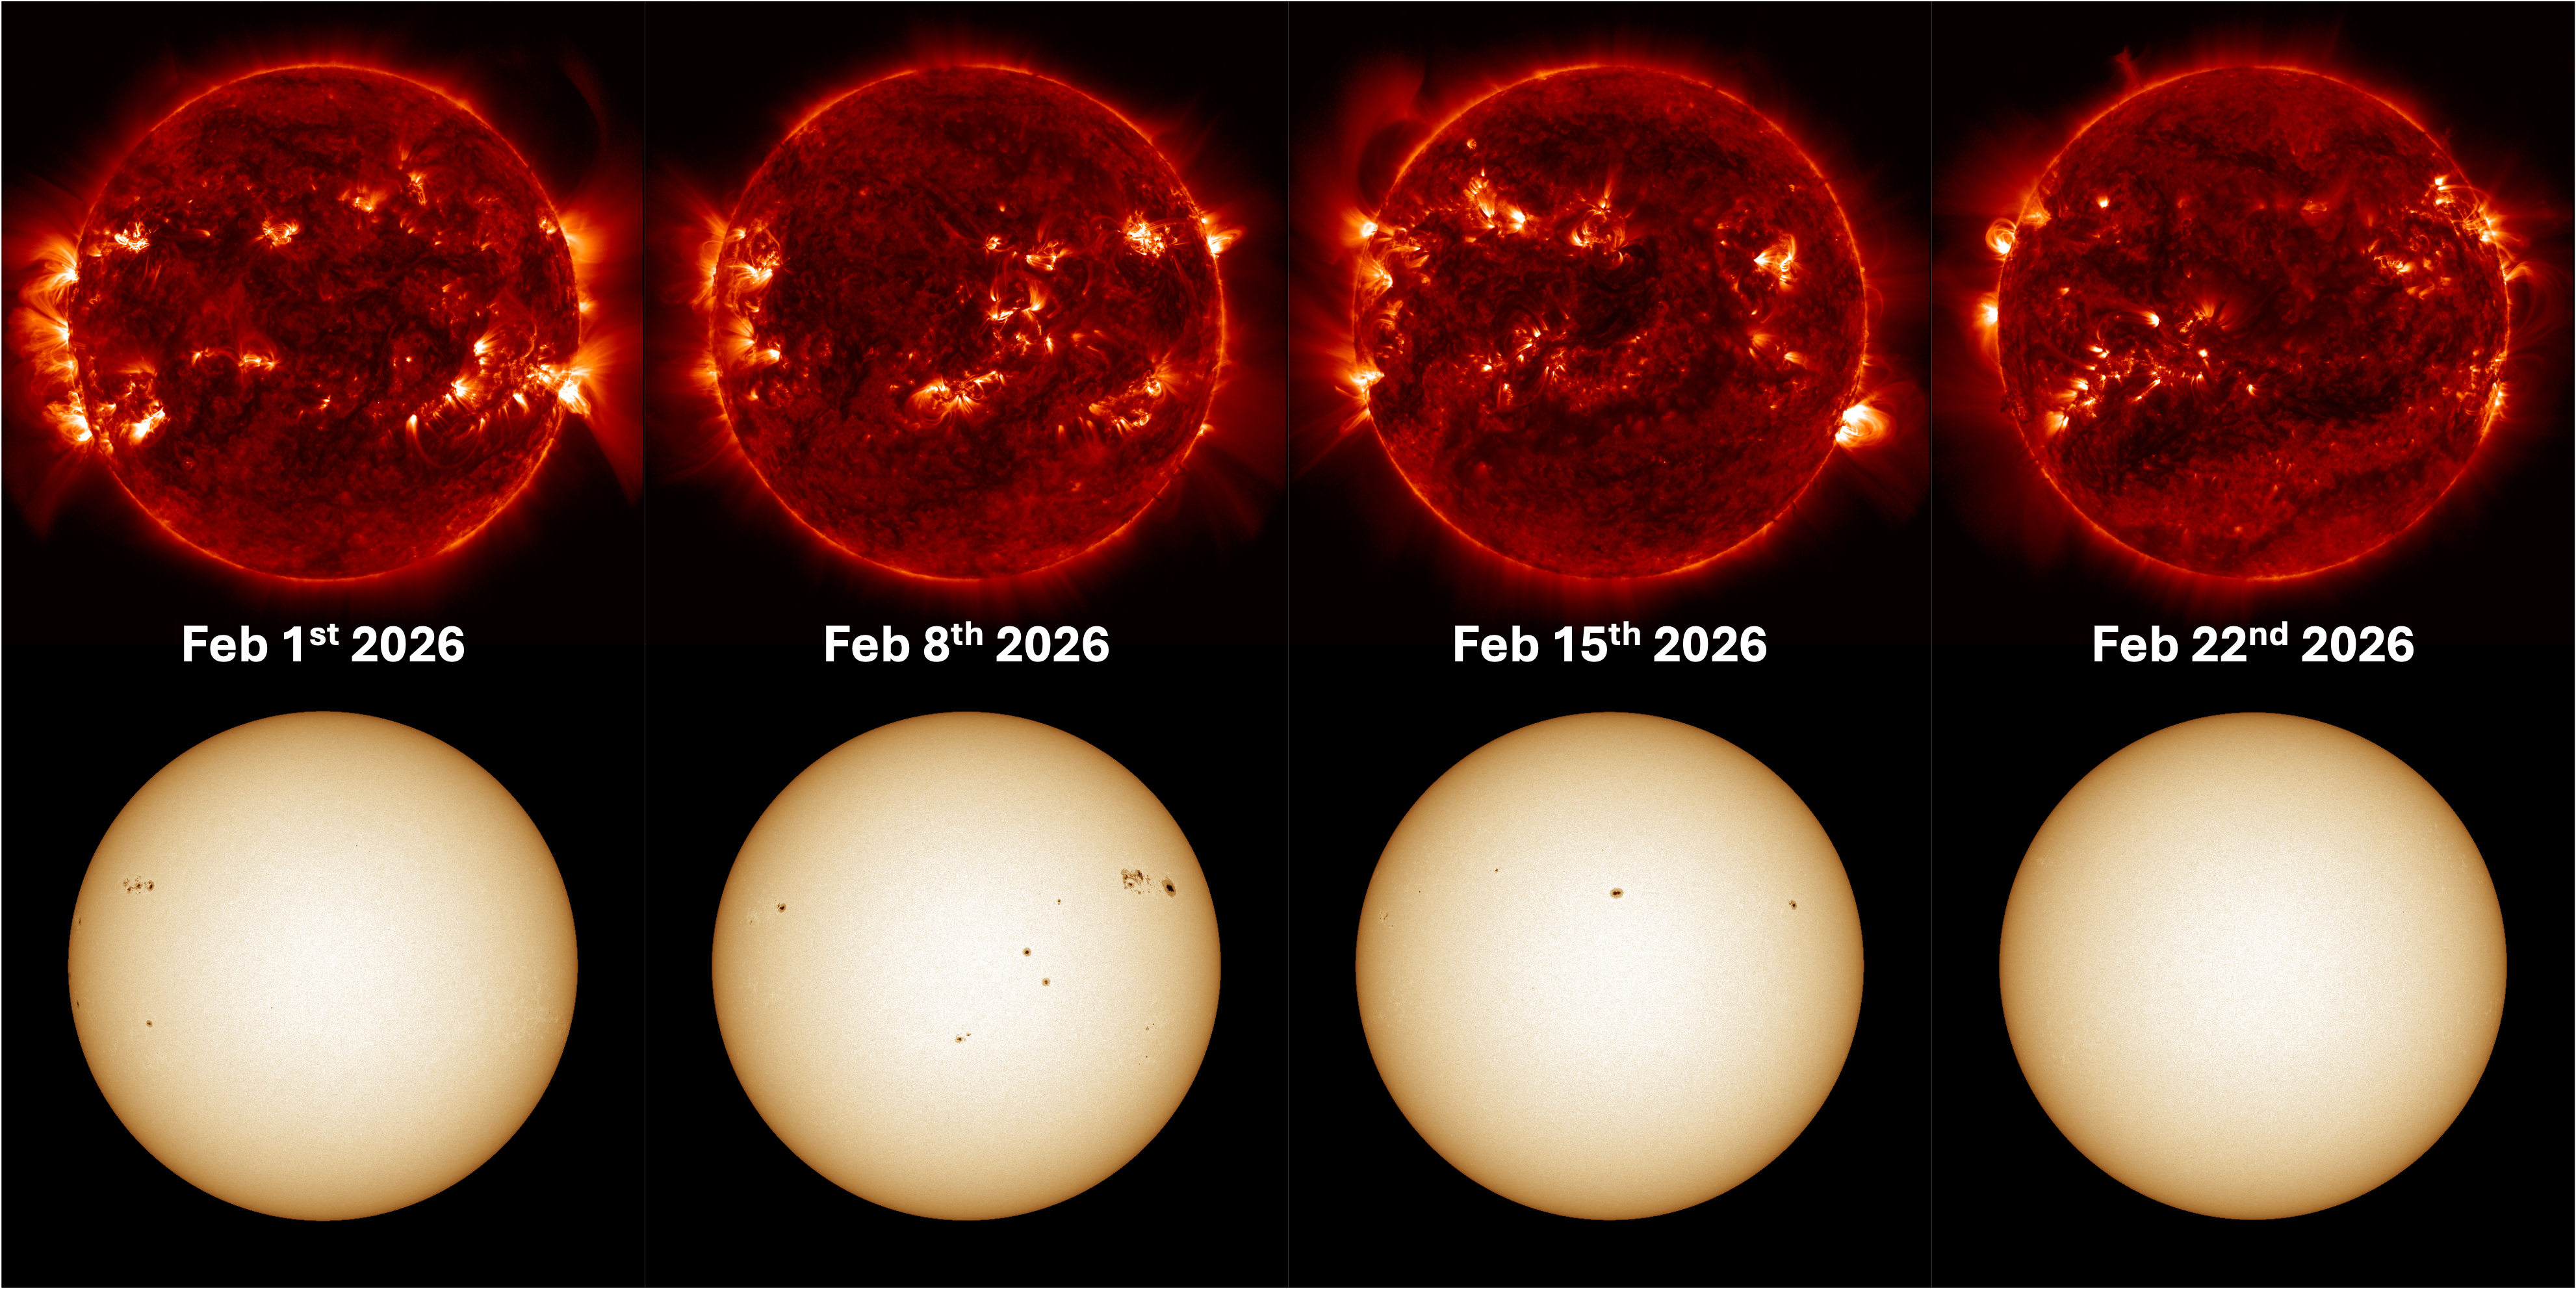
The sequence of images below reinforce the fact that February 2026 was truly a month of two halves on the Sun. Take a look at how sunspots (in the top row) and their associated active regions (bottom row) evolve over the month. Many of the regions rotate off the edge of the Sun, with nothing coming around to replace them. The sunspot-less Sun is a view we expect to see frequently later in the solar cycle, but a little surprising for now. However, despite the absence of sunspots, the Sun remains much brighter in extreme ultraviolet light (top row) than it would at solar minimum.
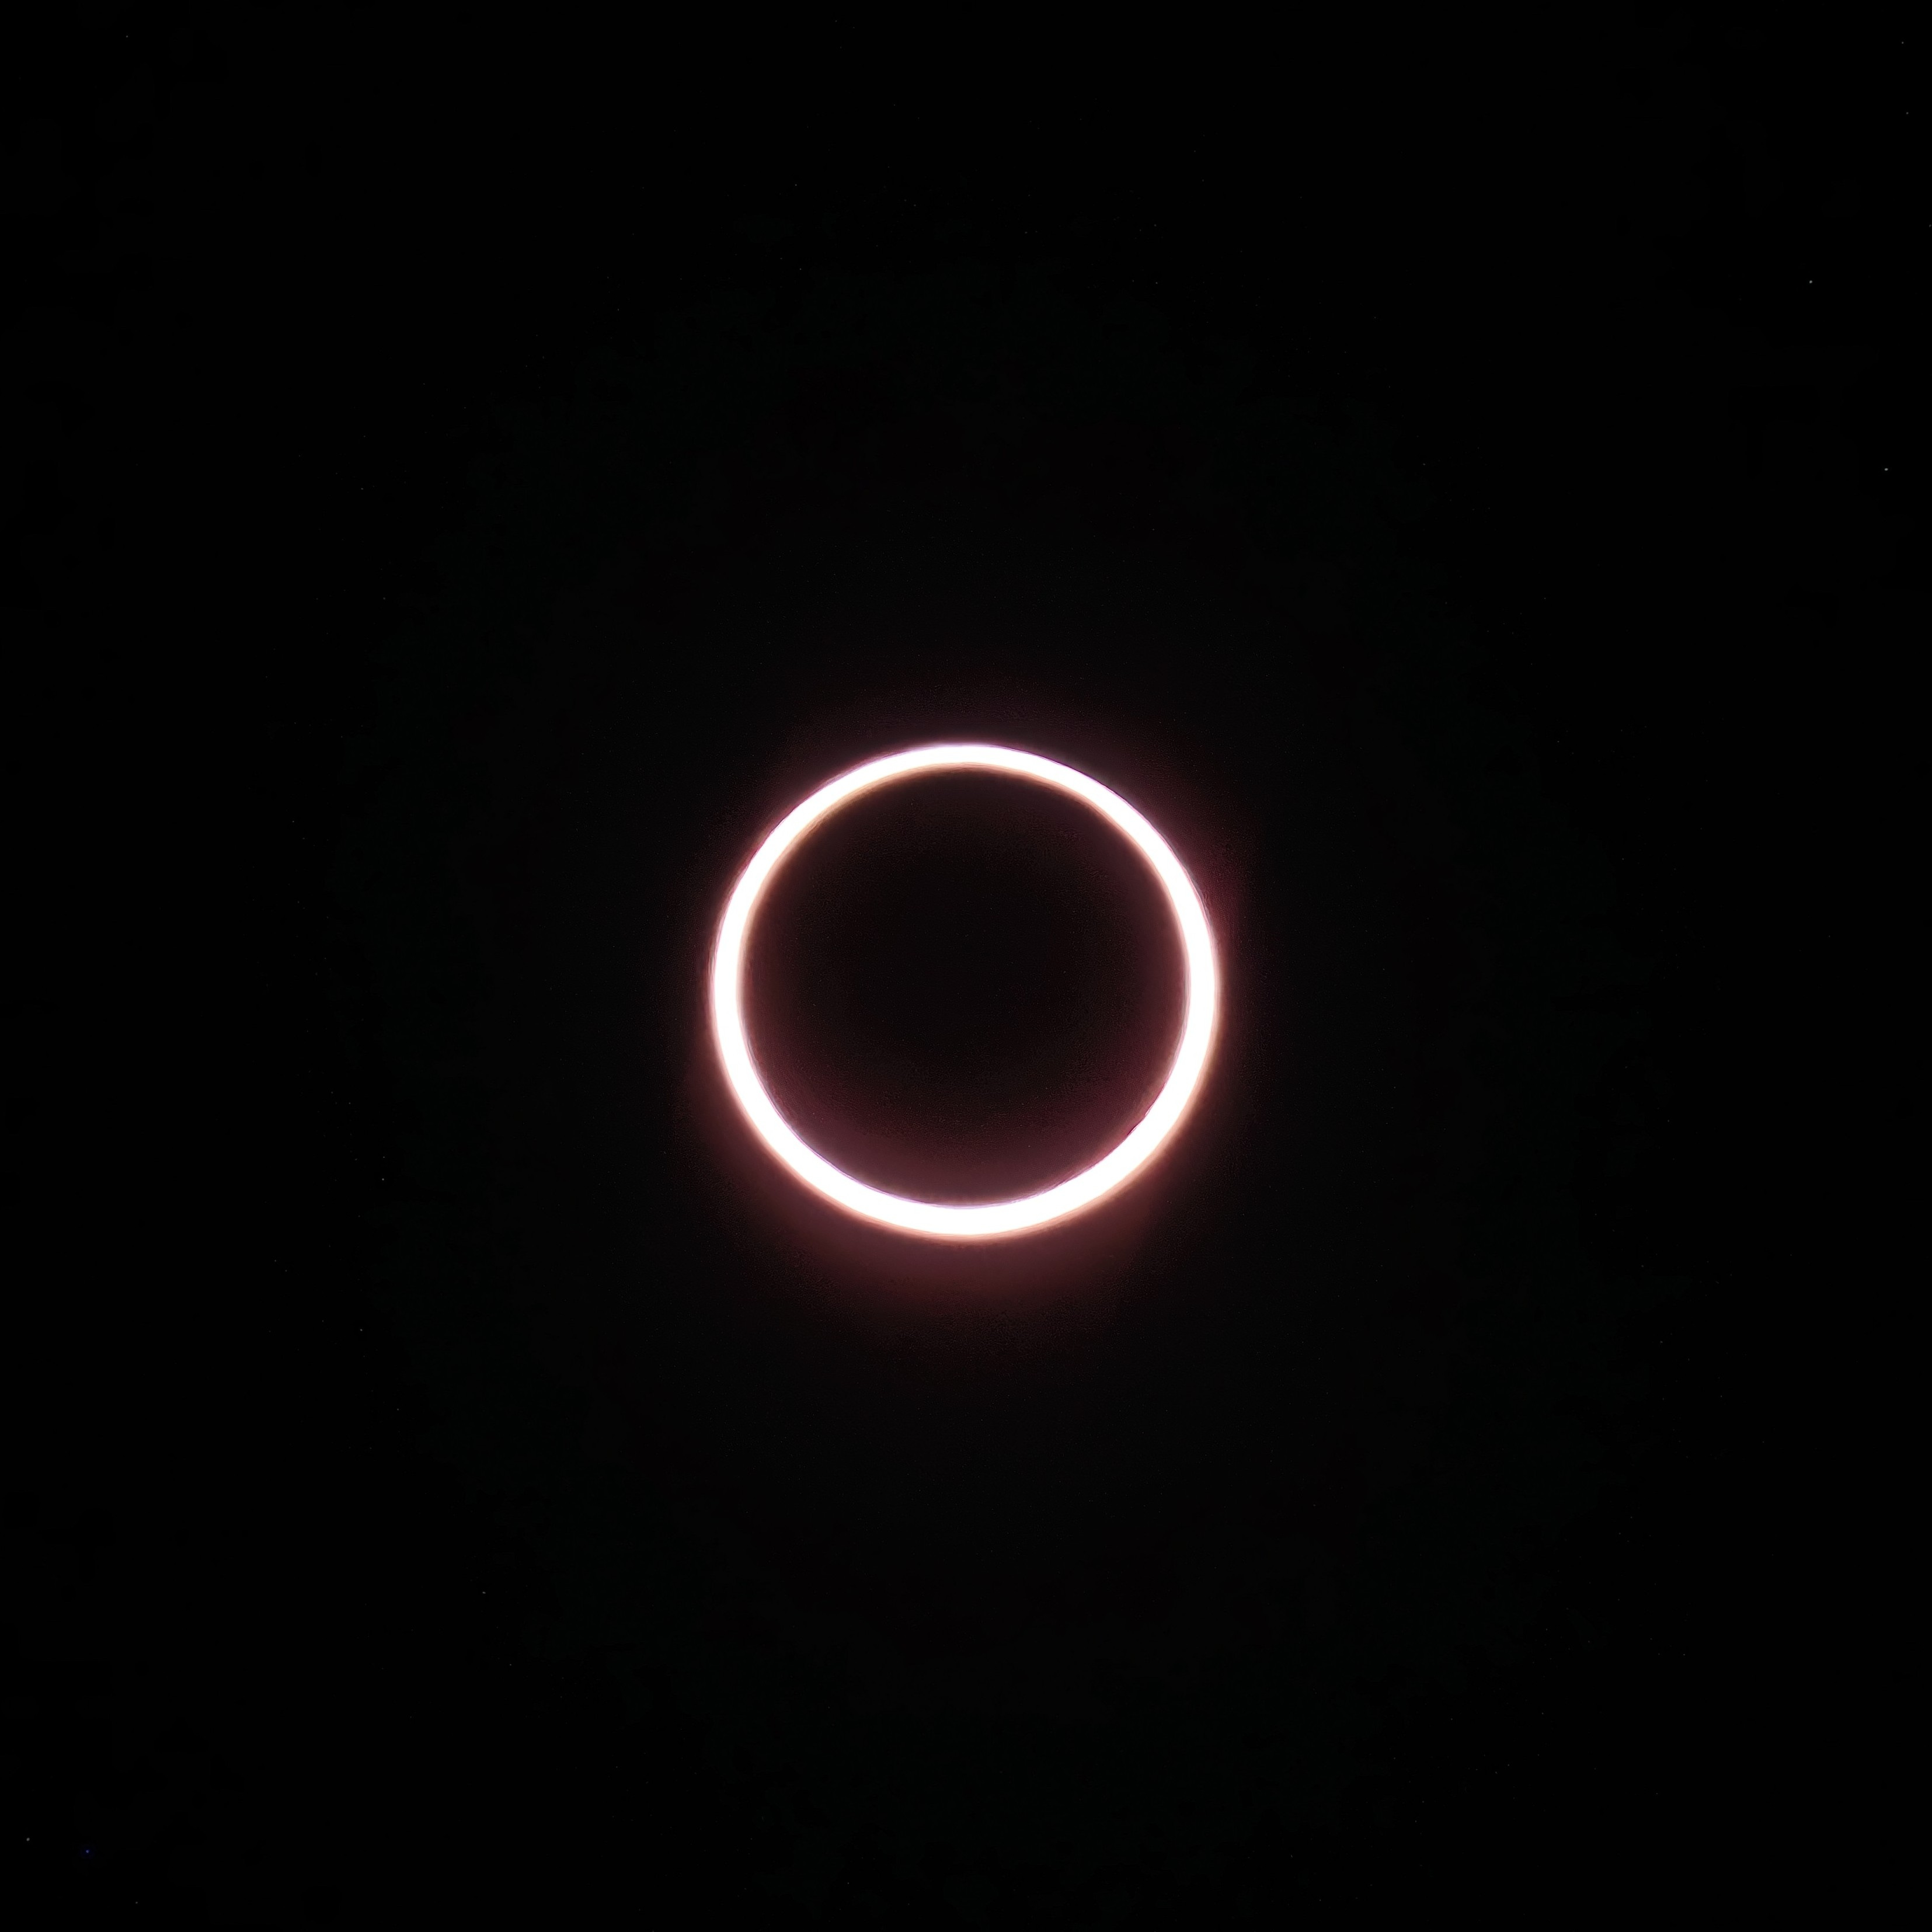
February 2026 saw an “annular” or “ring-of-fire” solar eclipse. Annular eclipses are a special type of partial eclipse where the Moon full passes in front of the Sun, but is in a point within its orbit such that it is too far from Earth to fully obscure the Sun from our perspective. The result? A “ring-of-fire” around the outside of the Sun. I was fortunate to see one of these from Texas in October 2023. They are cool, but certainly don’t come close to the spectacle of a total solar eclipse.
Last month’s annular eclipse was only visible from Antartica, so seen by a very small number of people. Somewhat fortuitously, it passed over the European Space Agency’s Concordia Station, deep in the Antarctic continent. I have been communicating with an engineer there who viewed the event with 11 friends – likely the only 12 people on the planet who saw this event in full (despite what fake/AI images of the event online would try make you believe). I’ve been working on an interview with him that I hope to share soon. In the meantime, here is a photo of the eclipse released by the European Space Agency:
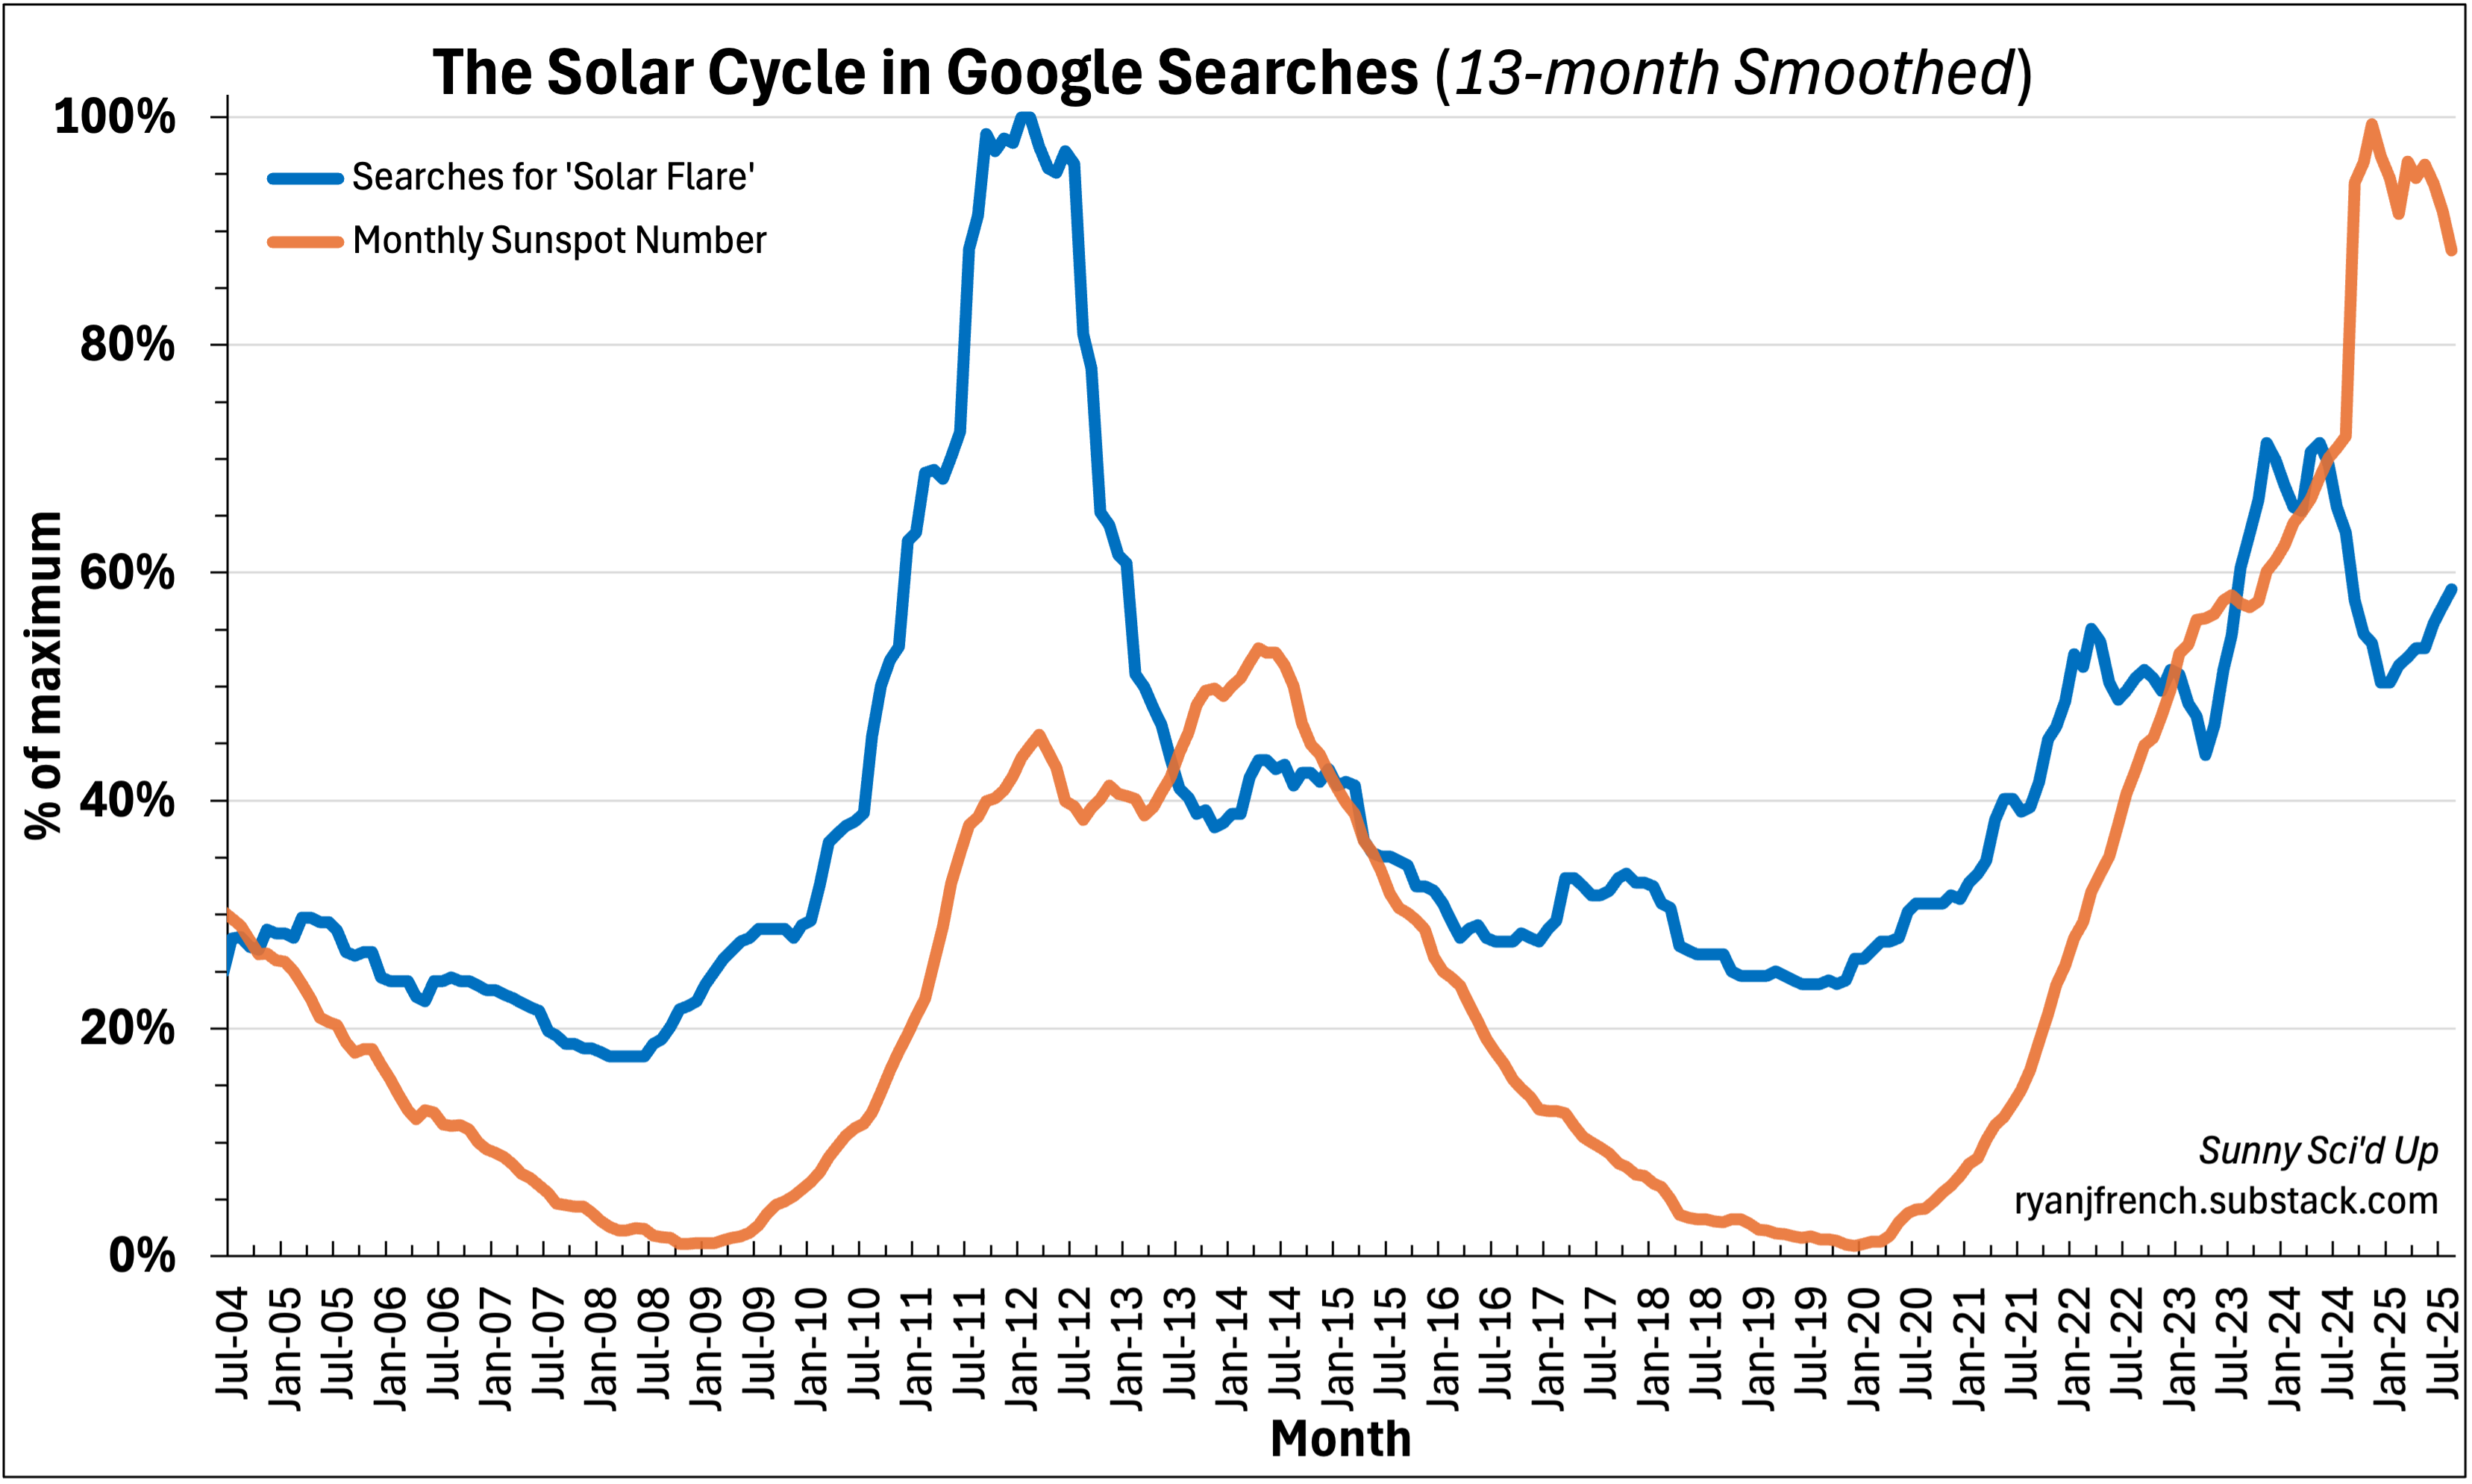
As a final item of our first “Sunny Sci-d Up” newsletter, I wanted to share a fun piece of data analysis I was looking into recently. If you plot the trend of people Googling “Solar Flare”, do a bit of smoothing and remove outliers, you’re left with the blue curve below. If this looks familiar to you – you’ve got a keen eye. We compare this curve to the orange curve, the smoothed sunspot cycle data we also included at the top of this post. That’s right: people Googling “Solar Flare” follows the solar cycle.
This is not necessarily surprising, as more solar activity results in more exposure to these events, leading to more searches for them. But still, its fascinating to see the alignment so clearly. Curiously, the previous solar cycle had more people searching about flares than the current solar cycle, despite less notable events at that time.
If you’ve made it this far… thank you. This was the first post of “Sunny Sci-d Up”, and I welcome any feedback (feel free to reply to any of my posts on social media with any feedback). My website is www.ryanjfrench.com, which includes my social media profiles (all of them, yes really), published books, and so on.
See you next time!
No posts
Comments
Nothing yet. Say the first thing.
Sign in to join the conversation.