
I admit I was caught a bit off-guard by all the responses to the previous article. So a big “Thank You” to everyone reading and commenting on it. And for all who wrote commenting on how age might factor into voter registration, please be patient. I am working on the data as fast as I can.
I was going to start digging more seriously into the differences between counties but got distracted by some comments on the ‘spikes’ I discussed last article. I used the term to describe the periodic shifting of party share from voters being moved from Active to Inactive status—often called “purges,” although “routine list maintenance” is more correct. These result in pronounced changes in the relative party-registered voter share when they happen, at least in Elko County.
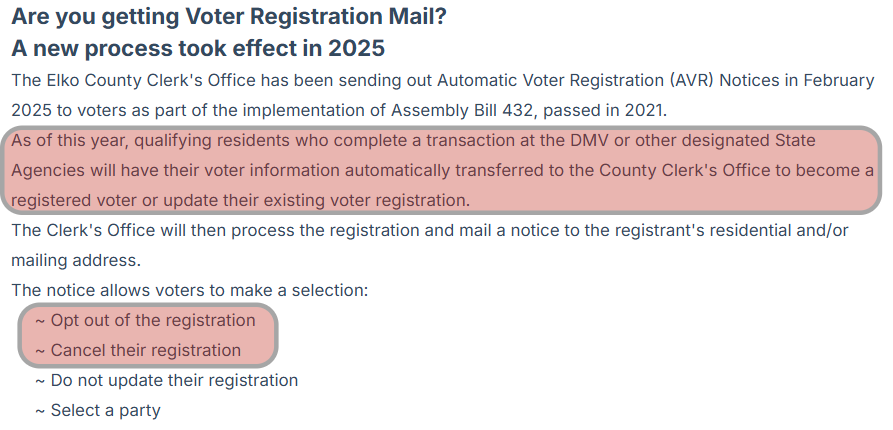
These adjustments happen one or two times each year in accordance with the National Voter Registration Act (NVRA) of 1993 and later legislation. In addition to moving and a few other circumstances, the primary reason for voters to be shifted from Active to Inactive is failure to vote in at least two consecutive federal elections while not answering letters from county clerks. Inactive voters are still allowed to vote, but under current Nevada law will no longer automatically receive mail ballots for the next election.
The ‘spike’ reference was to how these shifts showed up in tracking I was doing on Elko County registrations once Automatic Voter Registration (AVR) was implemented. On the tracking from January 2019, the year before AVR, through December 2025, the shifts tended to move in a very distinctive direction: Non-Partisans decreased overwhelmingly, bringing Republican registration share in Elko County back up to approximately 55%. You can see the graphic here.
The pattern has fascinated me because it goes against the narrative that more and more voters are ‘choosing’ to be Non-Partisan. The fact that Republican voter share rebounds after Non-Partisans voters are effectively removed after not voting in two federal elections (generally) is a strong argument against nonpartisanship being a choice for those who want to vote.
Automatic Voter Registration of Non-Partisans is suppressing other party registration changes rather than marking a permanent shift in political preference.
It appears that the automatic registration of Non-Partisans is suppressing other registration dynamics rather than marking some kind of permanent shift in political preference. So is this playing out across Nevada, or is it unique to Elko County?
One quick note on my sources. All the data I am using here is the public-facing Voter Registration Statistics from the Nevada Secretary of State. These are readily available without going through the state data warehouse for the more granular individual voter data. But more importantly, I am interested here in connecting data to narratives being devised based on the data. Those public narratives are being constructed using this more public-facing data. So I will be sticking with that.
The first question was whether the pattern of spikes I saw in the Elko County data was also evident in the statewide data. So my first effort was a stacked area graph similar to the one above I had done for Elko.
It was an utter failure.
The problem should have been apparent to me from the start: jumping from the roughly 28,000 voters in Elko County to the million-plus voters in Nevada attenuated the spikes. They are still there—they just are very, very hard to see compared to the vastly larger number of voters in Nevada.
I then tried a second approach that proved far more fruitful. I pointed out the graph used in the Reno Gazette-Journal article and commonly cited in the flurry of news stories in January is somewhat lacking because it was based on yearly changes. A legitimate approach, but one presenting voter registration as more consistent than it actually is.
So I went back and entered the monthly reports for the period from January 2016 through December 2025—the major reason it took so long to get this article together.
The results are rather illustrative. Naturally, the monthly totals provide far more movement than the yearly totals. And we can see some of the same features as in the yearly totals: the sharp increase in Non-Partisans after early 2020 that accelerates in 2025, the consistent decline in Democrat registration after June 2020, the slight bump in Third Party registrations following the 2020 Election, and finally the convergence of the Republican and Democrat registration shares.
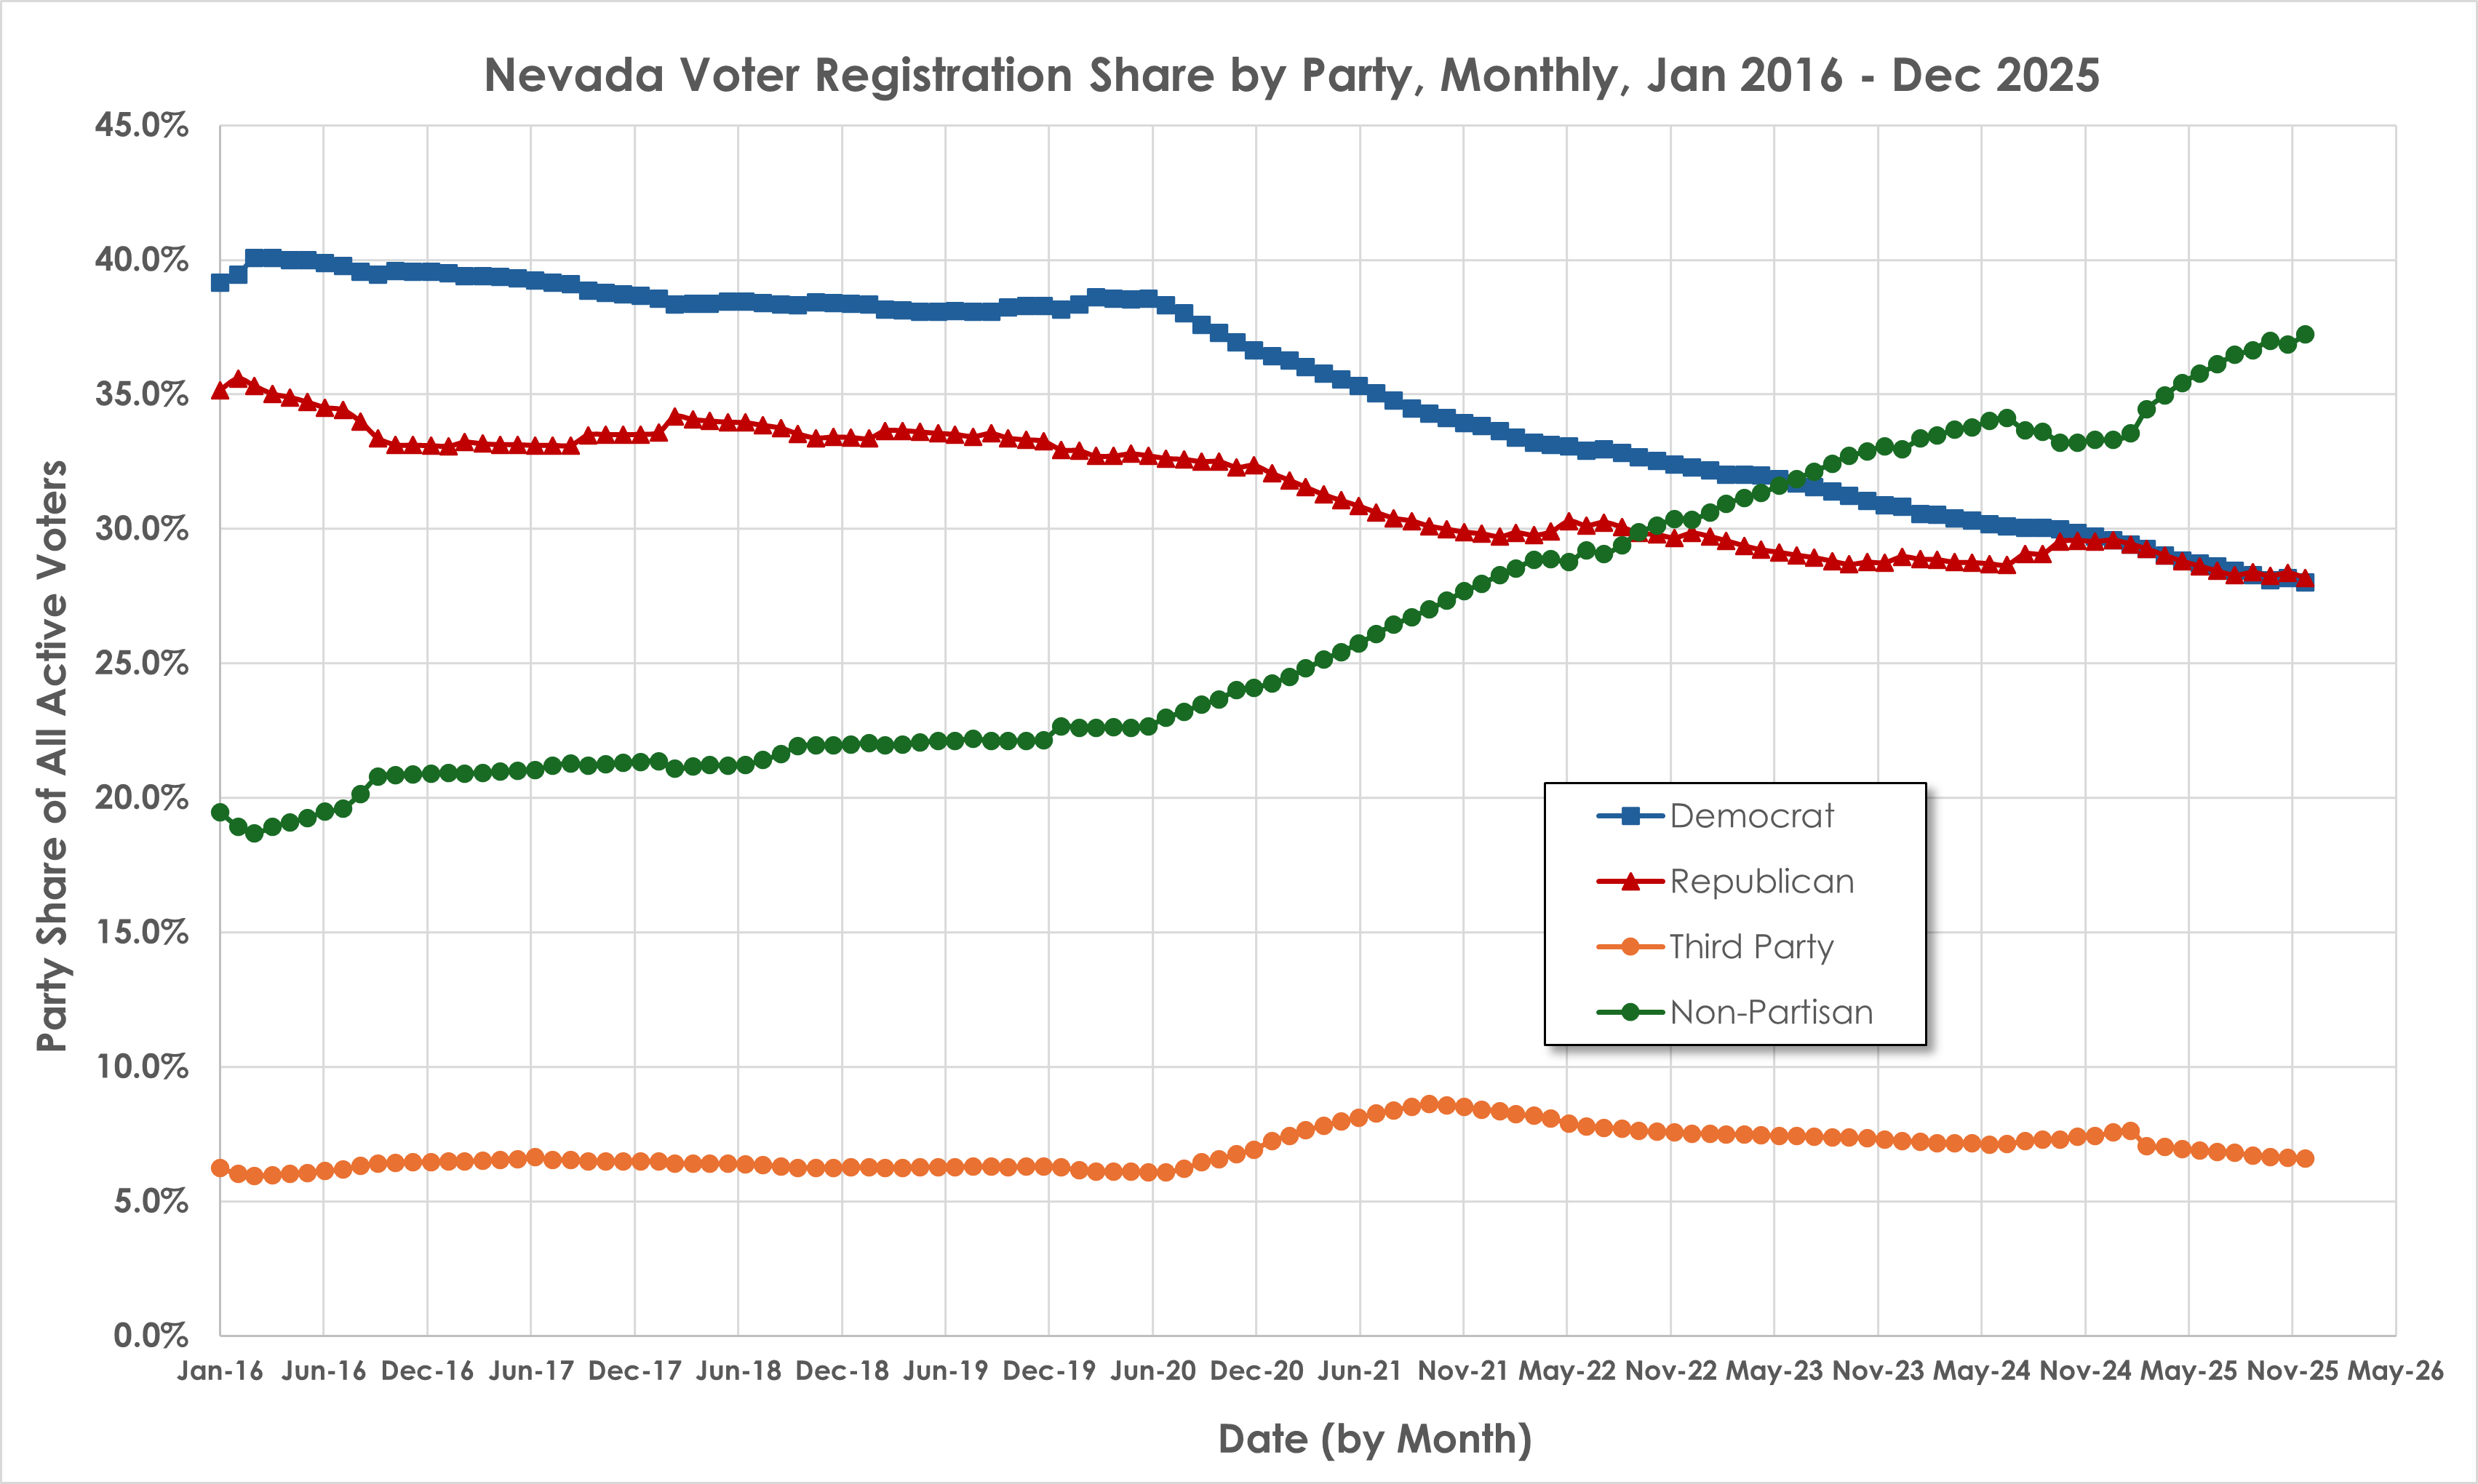
And most importantly, we can see a key feature that was not apparent in the yearly totals but that I suspected existed: sharp shifts in relative party strength whenever voter roll maintenance is conducted. Especially prominent is an odd ‘mirroring’ pattern between Republican (red lines with triangle markers) and Non-Partisan (green line with circle markers) voter share. The two appear to move in opposite directions consistently. This pattern is the one I was seeing in the Elko County data.
There are similar upticks in Democrat voter share, but it is much more muted against the general downward trend for that party. Third-Party voters show no sign of ‘spikiness’ whatsoever, but that might be a consequence of their relatively small percentage of all registered Nevada voters. Whatever is going on, it largely has to do with the relationship between Republicans and Non-Partisans.
While this dynamic was apparent from 2016 forward, it became more prominent following the introduction of AVR in 2020. The graph below zooms in on the period after June 2020. I also removed the Third-Party voter registration share, since something else is going on with it that I am still investigating. The grey bars mark periods of voter roll maintenance, when the number of Active voters dropped from the previous month.
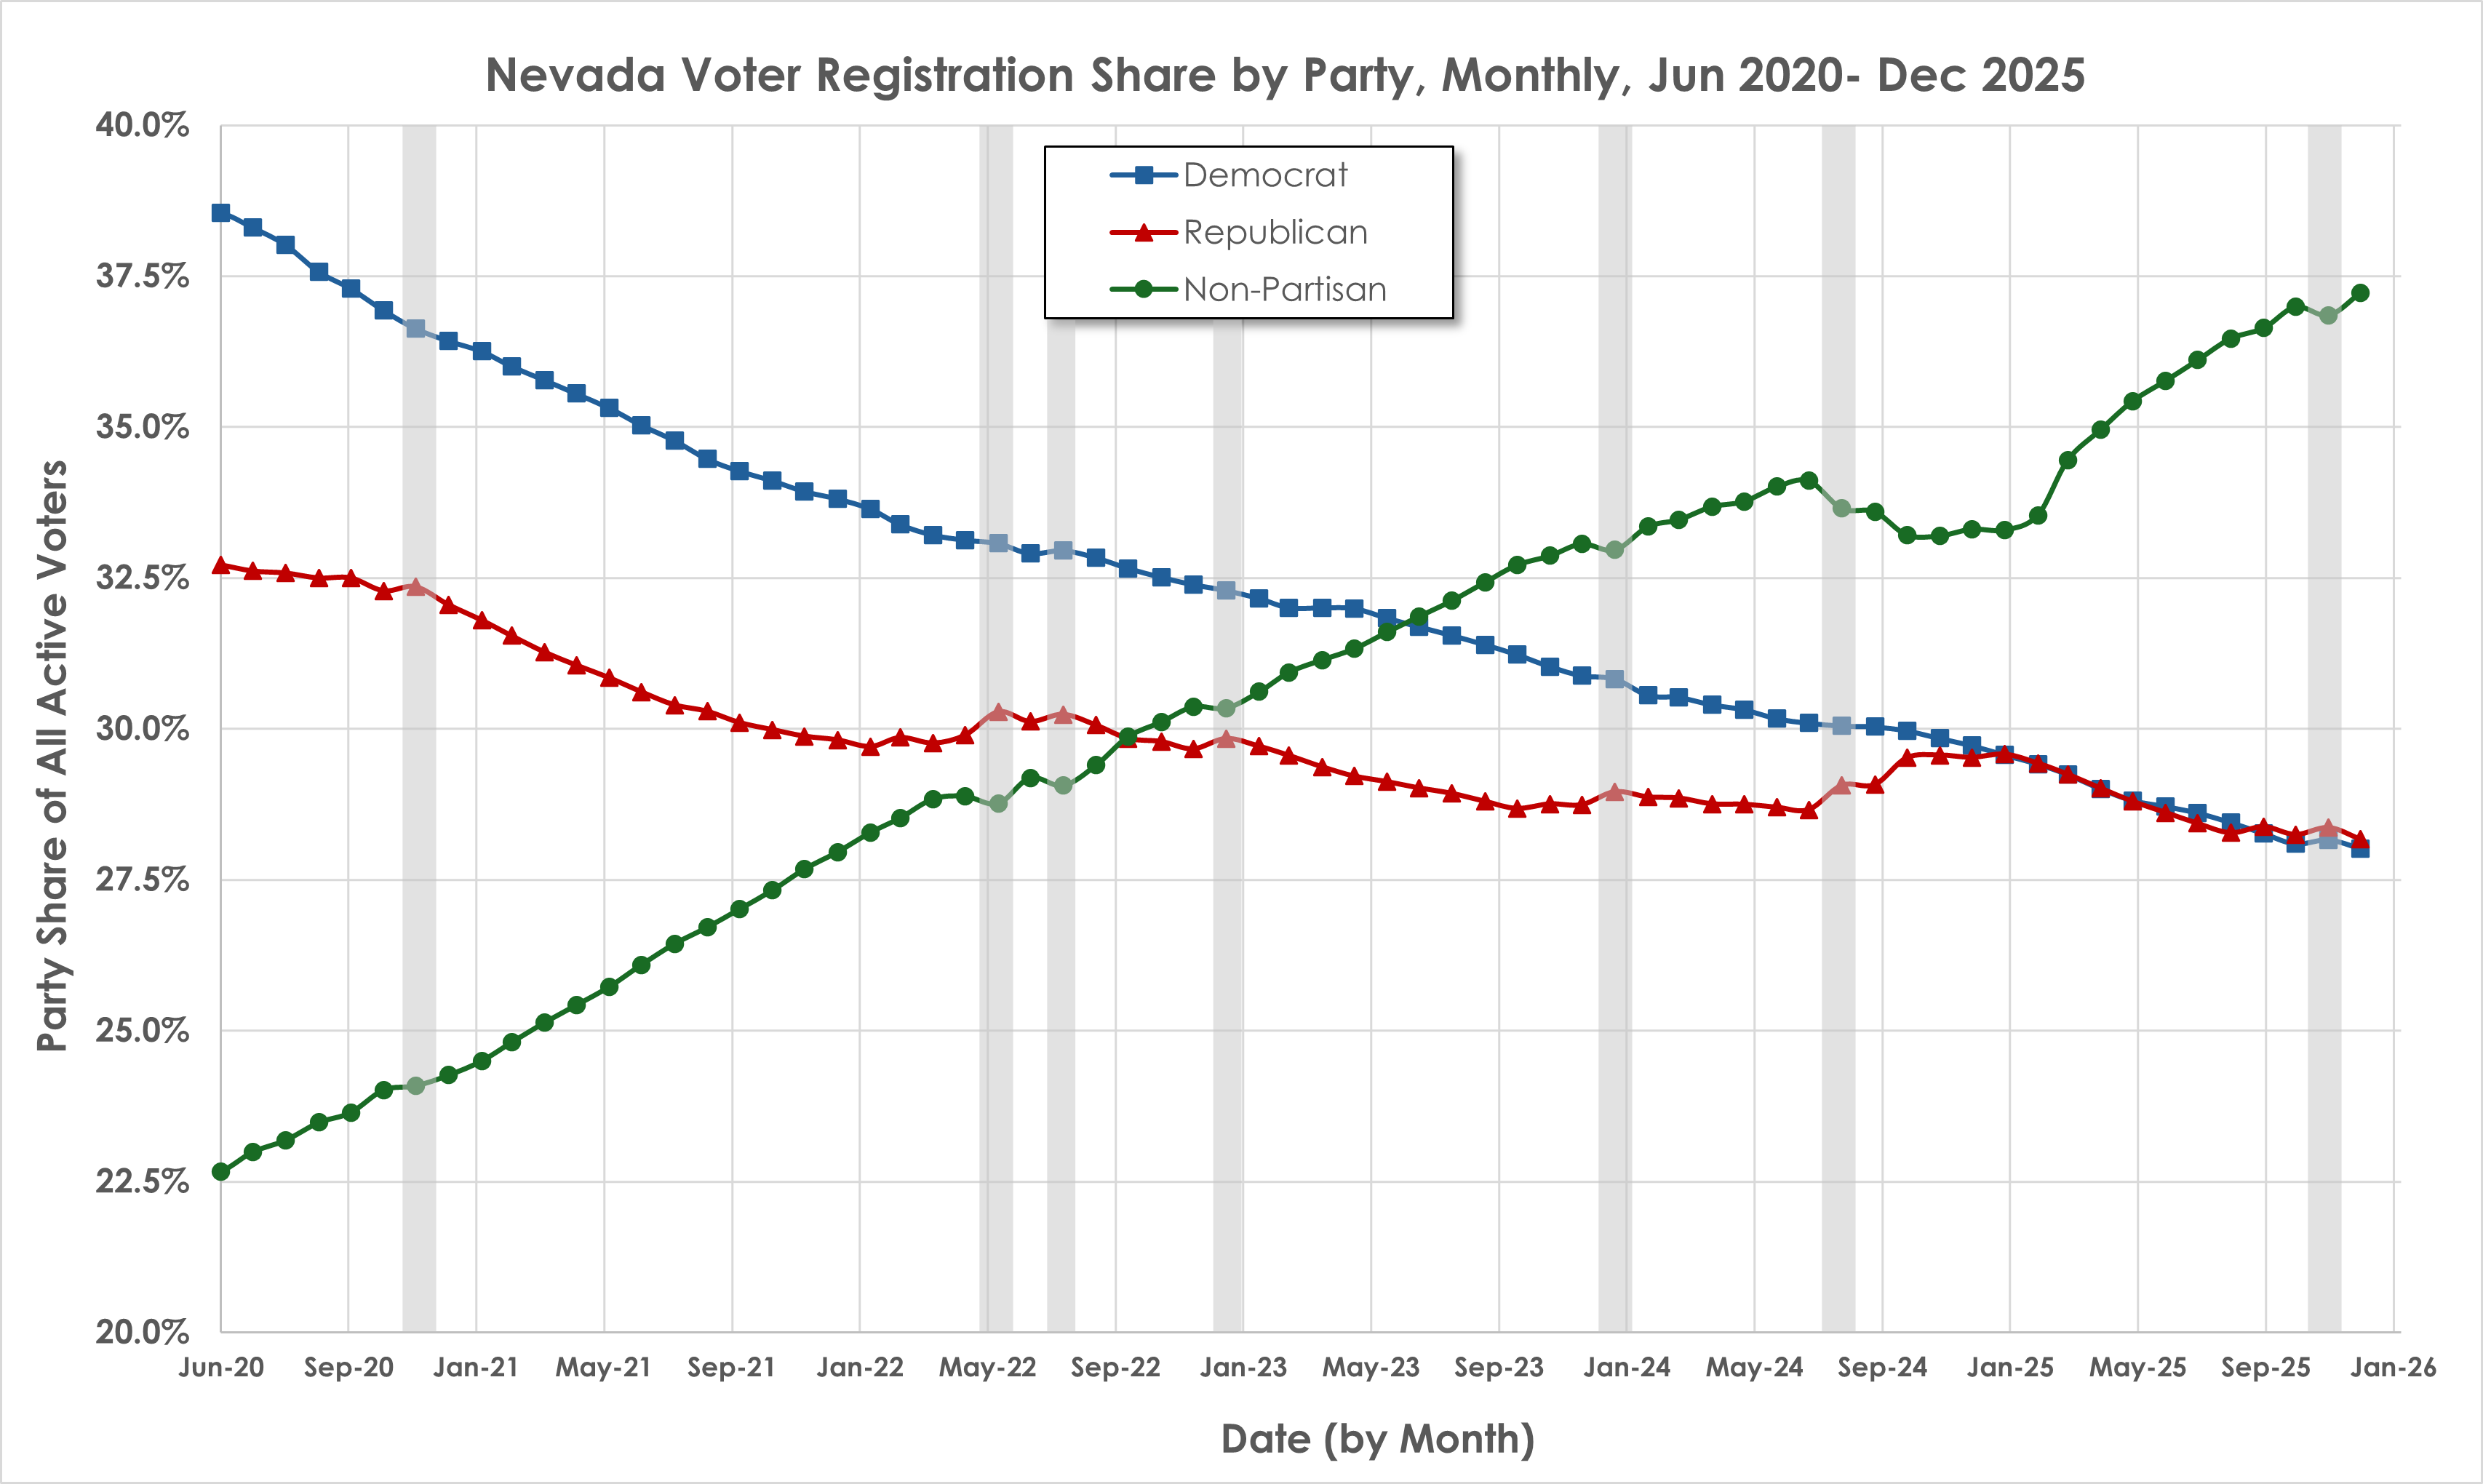
Again, the correspondence between Republican and Non-Partisan registration shares is pronounced. Certainly, Republicans never return to the roughly 33% share they had in 2016, but it is notable. The Democrat share shifts are also more prominent in Figure 2, but still significantly less than that between the other two groups.
A further puzzle might be found in one shift that occurred not because of the voter roll maintenance, but due to the 2024 Election. There was a pronounced rush for voters to either register to vote, change party registration, or move back onto the Active voter list by voting or requesting a mail ballot. Nevada gained roughly 120,000 Active voters between September 2024 and the end of November 2024.
But the impact was not equal between the parties. Both the Democrats and Non-Partisans added just over 33,000 voters between September and November 2024. That was enough to decrease the Non-Partisan voter share (0.4%), with a smaller decrease in the Democrat share (0.2%). But the Republicans gained over 46,000 voters, enough to increase their voter registration share 0.5%—about the same amount the Non-Partisans lost.
What is driving this odd relationship between Republicans and Non-Partisans? I am thinking it has to do not with Active registrations, but with voters being shifted to Inactive.
The question of the voter roll maintenance process is messy, to say the least. The Nevada Secretary of State’s website has a decent page explaining the details, although the topic is very complicated. And I am not even talking about voter cancellation, which has been the focus over the last few years as election integrity issues continue to roil through Nevada. These are serious enough the Secretary of State’s office sent out a press release on February 11, 2026 highlighting their voter roll maintenance activity in 2025.
The problem with measuring the voters ‘shifted’ during voter maintenance is that the public Active Voter lists focus on the total voters per party every month. The maintenance activities can be seen by a decrease in total Active voters both in total and by party.
But any decrease is lessened by the fact that the reports also add voters during the same month. In other words, the decrease is not a direct measure of those shifted from Active to Inactive. For that, a deeper analysis of the individual voting records would be needed. But I do think that the relative levels captured in the monthly report can tell us something, at least to start.
We can see a good example of this in Figure 2, above. Note the grey area in late 2025. The Democrat decrease in voter share exceeded the Republican decrease, even though the total numbers were very close. In that period, the Republicans lost approximately 6,400 voters compared to 7,300 Democrats—but over 12,000 Non-Partisans. Even given the differences in registration, the Non-Partisan decline was significantly larger.
If we assume that Non-Partisans are being registered through AVR in increasing numbers and added to the count, the actual numbers moved to Inactive likely were double that of the established parties. This confirms my thinking that AVR is capturing Non-Partisans not likely to vote.
With those caveats in mind, I tried mapping out the losses for voters for the three groups during each of the voter roll maintenance periods since 2016. These periods were identified as drops in total Active voter registration. The result is messy, but I think suggestive of some deeper trends.
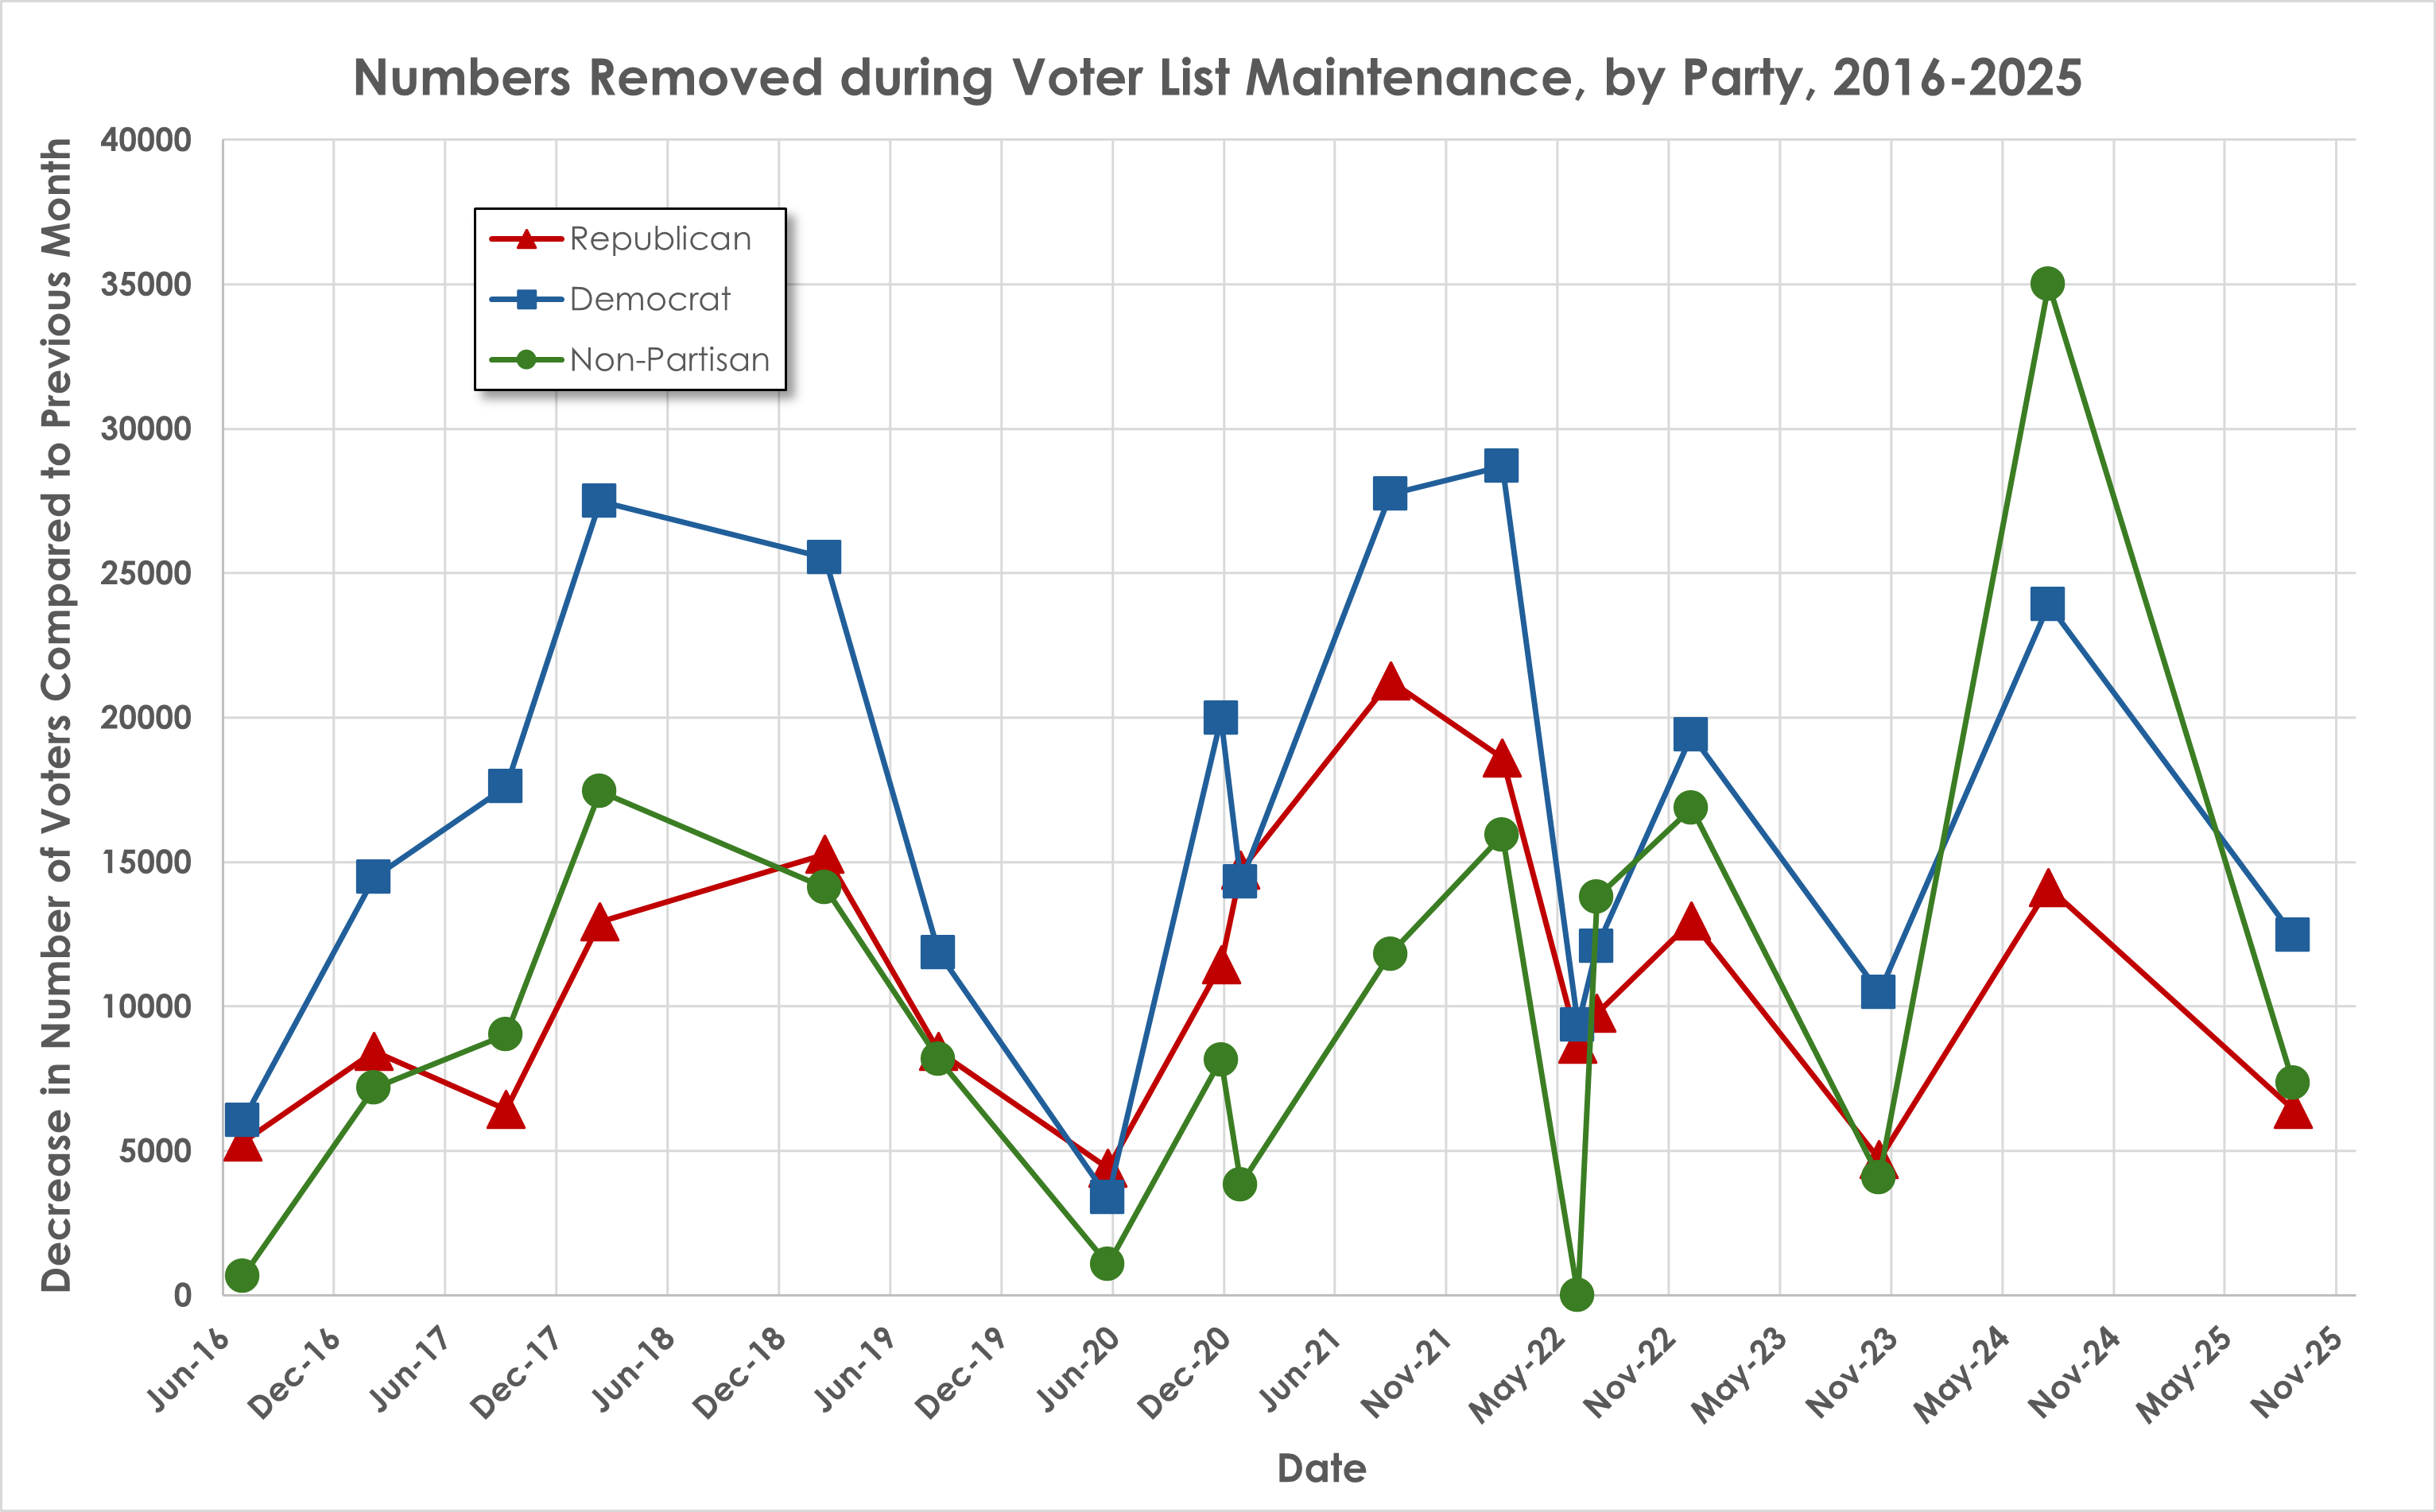
A number of interesting points jump out from this chart, despite its jumbled appearance. First, it is the Democrats with the highest numbers moved to Inactive, and fairly consistently at that. By 2016 they had a lead in voter registration, which gradually declined before tumbling drastically after mid-2020. The movement of voters from Active to Inactive in such large numbers indicates that the vaunted Democratic voter registration drives, such as the one they are just starting to launch ahead of the 2026 Election, have not really been all that effective. They are registering voters, but the regular removal of those voters indicates that those voters are not engaged after they register.
Second, Non-Partisans generally have the lowest number of voters removed up until mid-2022. I do not find that very surprising, since Non-Partisans had the smallest voter share. I also believe that this rough level includes the share of “choice” Non-Partisans—those who specifically want to be Non-Partisan and do show up to elections. So I would expect them to be shifted less.
At least until that huge spike that appears in the summer of 2024. This spike, in my opinion, is central to the argument that Non-Partisans are not voluntarily registering but being caught in the AVR policies. Those shifted in the lead-up to the 2024 Election would largely be those who did not vote in the 2020 and 2022 Elections—the two federal elections after AVR was introduced. As I said in the last article, I believe the growth in Non-Partisans is not a choice, but AVR policies (which, since February 2025, have removed choice from the equation). I think this pattern might continue, but it will still be a few election cycles until we see the true impact.
The third, and most interesting to me, is that Republicans regularly have fewer voters being removed, which indicates that Republicans are keeping their voters engaged to the point of not letting their registration lapse. The “Trump effect” might be playing a role, but there is remarkable consistency in Republican removals to keep within 5,000-15,000 voters per event except for 2021 and 2022, when pressure from the fallout of 2020 Election resulted in more voters being shifted among all voter groups.
Part of the recent story of Republicans overtaking Democrats in Nevada is that of Democrats hemorrhaging voters while Republicans are retaining them.
I have not yet found a “smoking gun” to the question of why the Non-Partisan and Republican numbers are acting the way they are. It is possible there is no direct answer. But I am beginning to suspect that the growth in Non-Partisans due to AVR is actually hiding other narratives with even more political impact to Nevada.
If Automatic Voter Registration had not occurred, what would have been narrative? Alternate history is fraught with many problems, but my impression is the story would be why the Democrats and Republicans are having such different experiences with retaining voters once registered.
The Democrat problem to me appears not with registering voters, but keeping them engaged and getting them to the polls. More importantly, this is a consistent problem for Democrats. There is an apparent lack of brand loyalty, so to speak.
Republicans appear to be doing better—but appearances can be deceiving. What is not known is how much of this consistency is the result of greater Republican voter registration and get-out-the-vote efforts over the last 8 years or so. The historical phenomenon of Trump’s popularity may also play a role. If it is temporary, the Republicans could be in for some rough waters after 2028.
If not, we might be seeing a generational shift in Nevada voting patterns that has little to do with Non-Partisan voters.
I want to keep exploring this issue in the next article by shifting to another data source—the monthly summaries of Inactive voters. Although also released by the NV SoS, these tend to be used less often for analysis. The significant reason is that these voters have neither shown interest in voting in the past nor will receive mail ballots, so why bother? But a preliminary scan indicates there is some interesting data in those numbers as well.
Thanks for reading Rurals of Nevada! This post is public so feel free to share it.
Comments
Nothing yet. Say the first thing.
Sign in to join the conversation.