
I’ve just released a new data dashboard — Decarbonization Around the World.
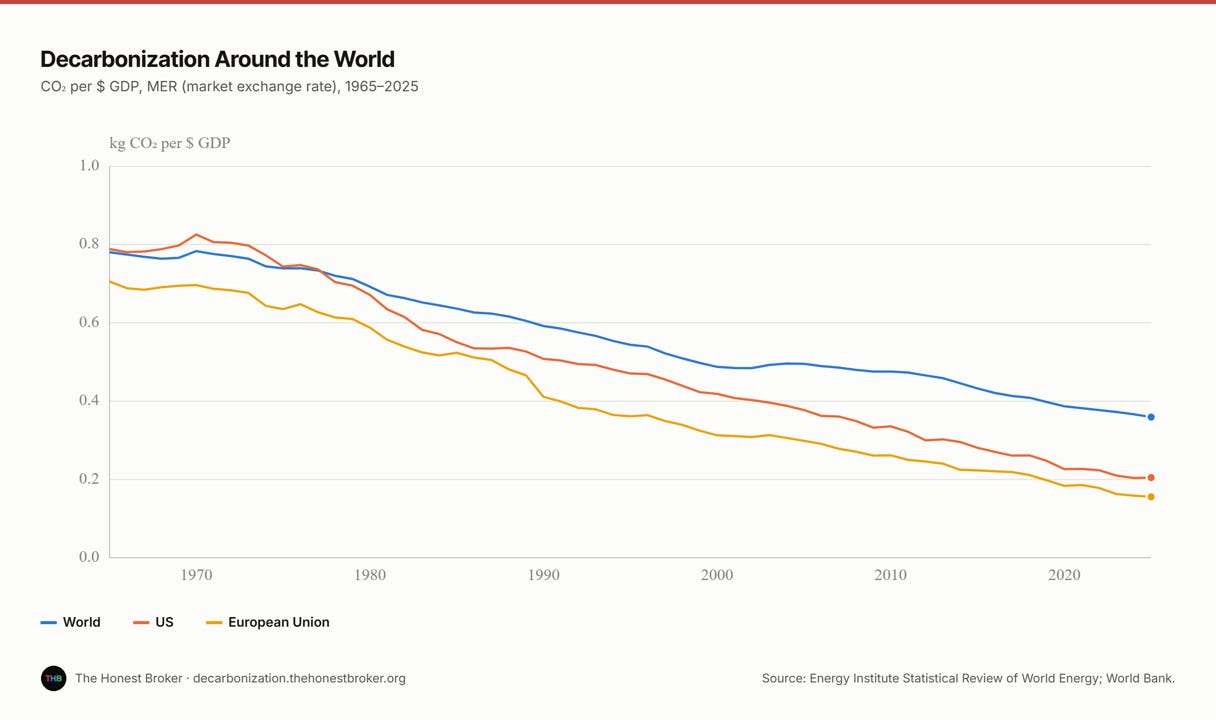
The site allows you to explore rates of decarbonization for countries and regions around the world. Decarbonization is a reduction in the ratio of carbon dioxide emissions to GDP. Every climate mitigation policy seeks to accelerate the rate of decarbonization — when that rate exceeds the rate of economic growth, emissions go down. Approaching net zero this century requires a significant acceleration in decarbonization.
The image below shows decarbonization for the world, U.S., and EU from 1965 to 2025 — and no signs of any acceleration in the era of climate policy.
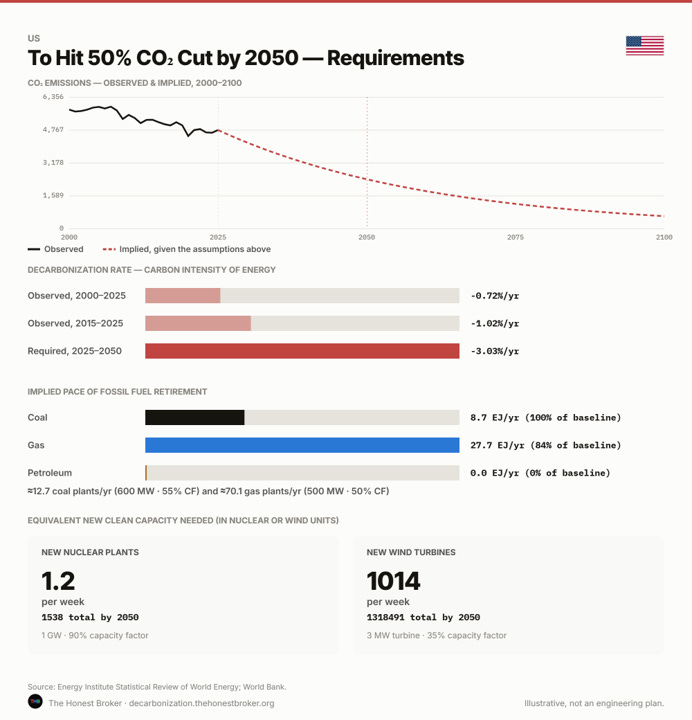
The site also allows you to get a sense of the scale of the decarbonization challenge that each country faces. The figure at the top of this post shows that for the U.S. to achieve a 50% reduction in carbon dioxide emissions (from fossil fuels) — assuming growing energy demand at 0.3% per year — would require the equivalent of more than 1,500 new 1 GW nuclear power plants (about 1.2 coming online every week, starting now) or more than 1.3 million new 3 MW wind turbines (more than 1,000 per week).
If you assume that all the waste heat from combustion can be forgone (some can, not all of course), then these numbers are reduced to 0.7 nuclear plants or over 500 wind turbines per week — still a huge number.
You can adjust any of these variables to explore different scenarios.
You can download figures and data. I encourage you to share what you find on your favorite social media platform and to tag me when you do. Click on the button below to start exploring.
Decarbonization Around the World
Check it out — it is work in progress, so suggestions, critique, and advice are all welcome!
A quick request — please click that “❤️ Like” button before you go.
Appreciated!
Comments
Nothing yet. Say the first thing.
Sign in to join the conversation.