
Up until the early 1990s, official US GDP per capita at purchasing power parity was quite close to that of Western Europe and Japan. For example, in 1990 (IMF):
US: US$23,914
Germany: US$20,726
France: US$19,662
Japan: US$19,624
Then, magically the US started to outpace Western Europe and Japan for the next 30 plus years due to its more competitive economic structure, supposedly! Well that outperformance is a lie based on two things (i) increasingly longer hours worked in the US vs. Western Europe and Japan, and (ii) much greater statistical manipulation of the inflation and GDP deflator in the US.
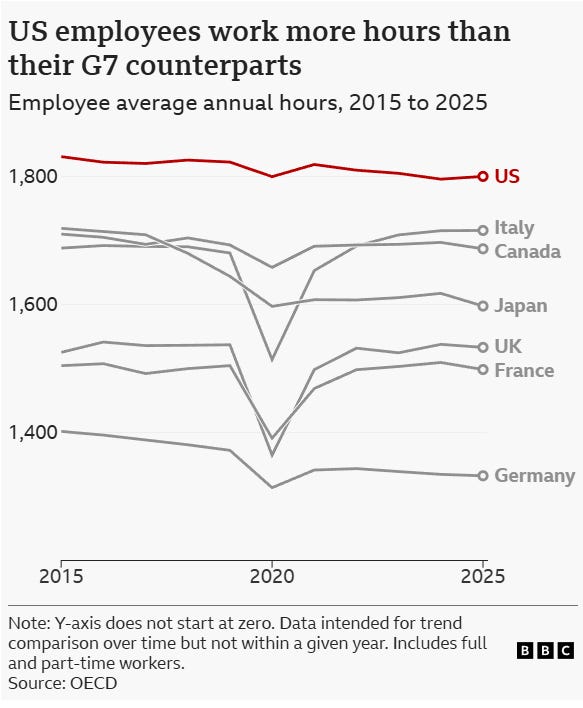
As the Centre for Economic and Policy Research points out between 1990 and 2016, working hours went down by nearly 20% in France, 19% in Japan and 12% in Germany while they hardly fell in the US; working hours were already lower in Western Europe before this period. Mostly due to such things as mandated family leave, sick leave, paid vacations and shorter standard workweeks; i.e. government policies. The populations outside the US took a chunk of the improvement in productivity as reduced working hours. I remember when I got a new manager from the US that he simply could not believe the amount of paid holidays and maternity leave that the average Canadian worker had access to; Canada ranks #7 on work/life balance vs. the US at #55. Taking the OECD numbers, the average hours worked per year in each country is:
US: 1,767
Germany: 1,319
France: 1,402
Japan: 1,597
The supposedly workaholic Japanese, a country where they have a specific term for death from overwork (karoshi), work 170 less hours per year than the average American! The latter work 34% more hours than the Germans and 26% more hours than the French. These differences by themselves can account for next to all of the differences in GDP per capita; i.e. the Europeans are not less productive than the US in GDP per hour worked. Notably, the Chinese are still off the scale at 2,100 hours worked per year.
But that is not the only factor. The other is that from 1999 the US Bureau of Labor Statistics started to very significantly change the way in which it calculated inflation after the results of the Boskin Commission. The hidden driver for this was that government benefits are inflation adjusted each year by the BLS calculated inflation rate, so if that rate could be massaged downwards it would quietly reduce government spending year after year. It would also cheat inflation-linked bond holders to the benefit of the government. So off the BLS went:
Hedonic adjustments for “quality improvements”. This is a highly qualitative assessment, does a double-speed microprocessor really double the value to the consumer? In this way many price rises disappeared and other prices supposedly collapsed. Interestingly, reductions in quality do not seem to be considered. For example, endless computerized phone answering systems rather than being able to talk to an actual person.
Allowing substitution between “like” items as prices change. This removed the “fixed basket of goods” and instead changes the weighting as relative price change to reflect consumer. So if a good rises in prices relative to “like” goods its weighting gets reduced because consumers can afford it less and substitute. To you and me this counts as inflation, but is magically disappeared away by reducing the weighting of the item in the basket.
Other countries made some of these changes, but none were as enthusiastic as the BLS! This means that from 1999, the US official inflation and GDP numbers were skewed upwards with respect to other nations due to the difference in the inflation calculations. There is no independent agency that calculates standardized real GDP numbers, with the IMF, World Bank and OECD acting as aggregators of nationally-produced statistics. With a built in inflater of US GDP statistics vis a vis other nations, in place now for over a quarter of a century, the result will be a significant over-statement of GDP number vis a vis other countries.
The United States, Germany and Japan also include an imputed “homeowners equivalent rent” in their CPI and GDP statistics, while France and China do not. This inflates the GDP of the first three by about 10% vs. the latter two.
In 2025, the official GDP per capita at PPP at current prices were:
US: US$89,991
Germany: US$74,004
France: US$66,276
Japan: US$56,854
China: US$29,352
The difference between the US and Germany is more than accounted for simply by the greater number of hours worked in the US. In fact, this study found that:
Median hourly wage/salary for full-time workers, PPP adjusted (current international US$) is $28.80 (US) compared to $36.54 (Germany).
The difference is even greater for part-time workers. Between France and the US, over 70% of the difference is accounted for in relative hours worked. Only one sixth of the difference between Japan and China is accounted for by hours worked. A conservative estimate is that the changes to the way in which the BLS calculates inflation have reduced officially stated inflation by at least 1% per year; over 26 years that’s about 30%. That’s the minimum amount by which recipients of government benefits and pensions have been cheated, as well as holders of inflation-linked bonds.
That means that German GDP per capita may very well be higher than in the US, while the average German works significantly less hours per year. Quite possibly the same for the French. The gap between the Japanese and Americans is also much smaller. When taking into account the differences in income inequality, the median European and quite possibly Japanese is significantly better off than the median American. Misleading statistics are being used to argue that Western Europe needs to be even more like the US, when in fact it is Western Europe that is significantly more productive (per hour) than the US.
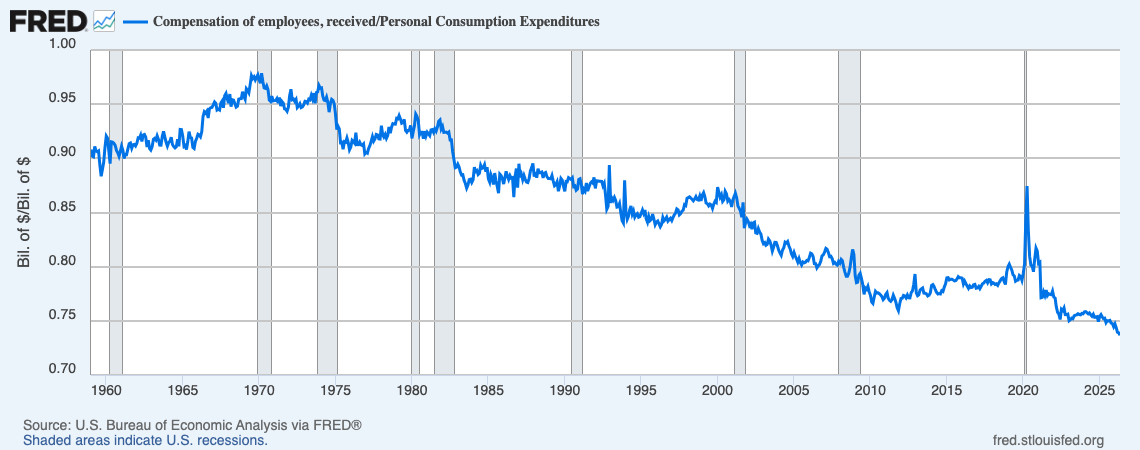
The reality is that the vast majority of Americans have been getting poorer over time, with employee compensation able to cover less and less of expenditures since 1968. The difference is made up by federal and state benefit payments, drawing down savings, and increasing levels of debt. US household debt to GDP doubled between 1980 and 2010, while the savings rate halved. Some of the difference is also met from increased investment returns, but that’s only really applicable to the top 10%. Below, the trend in US employee compensation as a share of personal consumption expenditure; falling sine 1970.
From https://drafts.interfluidity.com/2026/07/06/why-are-americans-so-unhappy/index.html
What about China? At the start of this century, Chinese GDP statistics were treated with caution, but the Party-state has carried out extensive changes to increase their accuracy; after all, they provide a critical input into the 5-year planning process. The average Chinese does work about 19% more hours than the average American, although half the difference is offset by the Chinese not including imputed rent into their GDP statistics. But, as I have noted previously here, there are some serious shortcomings in the PPP calculations for China that significantly understate its GDP at PPP. The average Chinese GDP per capita may be more like half or two thirds of that in the US, Germany, France and Japan. In addition, the infrastructure is significantly better and the Party-state also works to maintain reasonable prices for the “essentials” with rent-seeking behaviour minimized. With a population of 1.4 billion, there are Chinese conurbations the size of major Western European countries that have a GDP per capita rivalling Western Europe, Japan and the US.
Faulty statistics allow decision makers to have a worldview which does not match reality. That reality is more and more evident every day as even the leading US industries come under increasing competitive challenges from China and the immiseration of the majority of the US population becomes more and and more evident. Europe does not need to be more like the failing US, it needs to be more like China in its whole of society industrial policies, its neutering of the dysfunctional aspects of the financial system, its minimization of private rentier incomes, and its creation of truly competitive domestic markets.
No posts
Comments
Nothing yet. Say the first thing.
Sign in to join the conversation.