
Thank you for subscribing to my posts. If you’re not yet a paying supporter, please consider becoming one. That’ll allow you to DM me with questions and comments. Your contribution will help cover the cost of the data I use in my posts, which I fund out of my own pocket. Thanks so much for your support and feedback!
There’s two ways of thinking about yesterday’s keynote by Kevin Warsh at the Jackson Hole Symposium. The first is to see it as a standard monetary policy pivot. After being dovish on inflation on July 29 - the most recent Fed meeting - Warsh has now decided that inflation isn’t coming down fast enough, so a more hawkish tone is needed. The second is to see yesterday in the bigger picture, which is that his performance on July 29 sparked a sharp rise in long-term yields, which the US Treasury was forced to tamp down with a highly unusual buyback announcement. That announcement fanned the flames of the “debasement trade” on fears the US is moving in the direction of artificial yield caps, i.e. it had a lot of unintended and potentially negative consequences. So it’s probably fair to say US policy makers aren’t itching for a repeat of all that.
In my opinion, yesterday’s “hawkish” keynote was all about containing the rise in long-term yields, which is what I outlined in my preview for Jackson Hole. If that’s correct, markets are misreading what’s going on. They’re pricing greater odds for hikes in the upcoming Fed meetings, when that’s not what this was about. Instead, this was about anchoring the long end of the yield curve, i.e. this was a further step in the direction of managing the long end of the yield curve. This also means - if my interpretation is correct - that yesterday will prove to be another positive catalyst for the “debasement trade” and a weaker Dollar over the medium term. We’re seeing the emergence of a new Treasury-Fed accord where the overriding goal is to keep borrowing costs down.
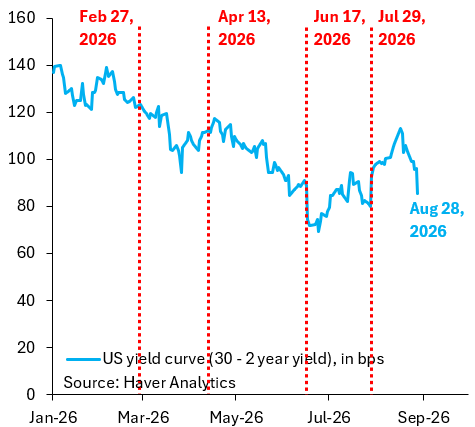
The chart above shows the slope of the US yield curve. It plots the difference between the yield on 30- and 2-year Treasuries. The vertical red lines denote key turning points so far this year, starting with the beginning of the war in the night of Feb. 27, the start of the US blockade of Iran on Apr. 13, the memorandum of understanding with Iran that was signed on Jun. 17 and the most recent Fed meeting on Jul. 29. A repeat of the Jul. 29 performance could have de-anchored long yields and undone all of Treasury’s efforts to contain them. There was little alternative but to sound hawkish therefore and - as the chart shows - this worked. The slope is almost back to pre-July 29 levels.
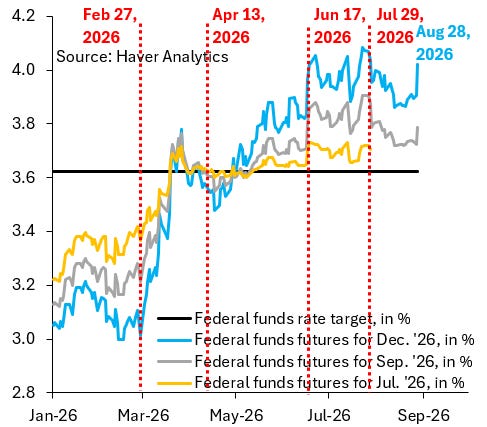
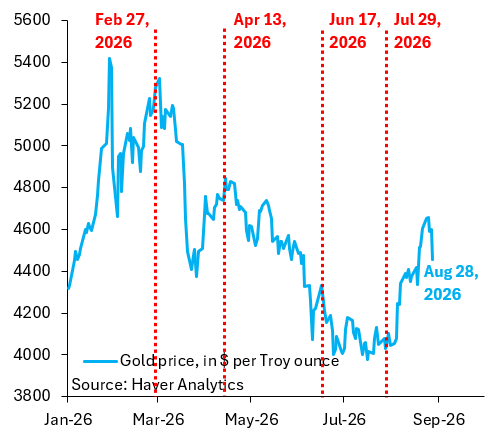
If I’m right about this, markets once again have the wrong end of the stick on upcoming Fed meetings. As the gray line in the cart above shows, they now price a 60 percent probability of a 25 basis point hike in September, up from 40 percent prior to the speech. Markets are heading back to pricing two full hikes through the end of the years as the blue line shows. I don’t think yesterday signaled any of that. This was just a recalibration in tone to avoid a repeat of the long-end sell-off that’s plagued the US since Jul. 29. If I’m right about this, yesterday is a positive medium-term catalyst for the debasement trade and a weaker Dollar. As the chart below shows, gold pulled back yesterday - a risk I’d flagged in my preview - but this is just noise. The pieces are falling into place for gold and other precious metals to go much higher.
No posts
Comments
Nothing yet. Say the first thing.
Sign in to join the conversation.