
Thank you for subscribing to my posts. If you’re not yet a paying supporter, please consider becoming one. That’ll allow you to DM me with questions and comments. Your contribution will help cover the cost of the data I use in my posts, which I fund out of my own pocket. Thanks so much for your support and feedback!
The direction of travel is clear. Debt levels across much of the advanced world will keep rising because reigning in out-of-control deficits is politically costly and policy makers have little incentive to do so. As a result, markets will keep pushing long-term yields higher and governments will increasingly resort to artificial yield caps to avoid the appearance of fiscal distress. Of course, such yield caps are already a reality on the Euro periphery as well as Japan. Last week’s buyback announcement by the Treasury means this is also - unsurprisingly - the direction of travel in the US. Over time, we’ll get more caps in more places with ever greater intensity.
The fly in the ointment is that markets still have a voice. They’ll be looking for safe havens where they can ride out this debt bonanza and there’s a few. The first is gold and other precious metals, which rose sharply last week. The second is currencies of low-debt countries in the G10, including Switzerland, Sweden and Norway. The third is emerging markets (EM), which should see a “wall of money” coming their way. This is because artificial yield caps in the G10 subsidize the carry trade, wherein investors borrow in low yield currencies and invest in high yield ones. The biggest risk to carry trades is that the cost of funding - where you borrow - spikes. If the G10 increasingly resort to yield caps, that risk diminishes and so it makes perfect sense that the Dollar fell to a new low against EM after last week’s Treasury’s buyback announcement, as the blue line in the chart below shows.
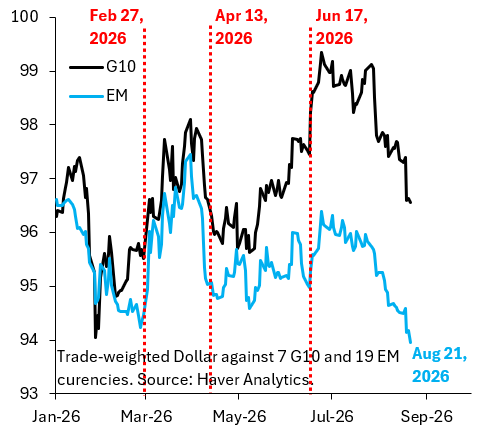
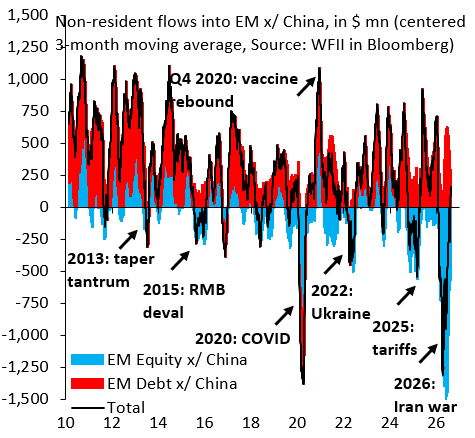
With the Dollar down to a new low versus EM, it’s tempting to think this move is done and better not chase it. The opposite is the case, thanks to the war with Iran that’s generated massive outflows from EM in recent months. The chart below shows a centered three-month moving average for daily flows to EM from the WFII screen in Bloomberg. The black line shows total non-resident flows to EM, the red bars show flows into EM bonds and the blue bars show flows into EM equities. The spike in oil prices and all the associated uncertainty caused outflows almost on par with COVID in 2020, which means that - at this juncture - the EM carry trade is still heavily under-positioned. The fall in the Dollar against EM is only just getting started.
No posts
Comments
Nothing yet. Say the first thing.
Sign in to join the conversation.