
Thank you for subscribing to my posts. If you’re not yet a paying supporter, please consider becoming one. That’ll allow you to DM me with questions and comments. Your contribution will help cover the cost of the data I use in my posts, which I fund out of my own pocket. Thanks so much for your support and feedback!
I’ve been writing about the rise in long-term government bond yields since this time last year. The sell-off that’s engulfed global bond markets recently therefore isn’t new. This has been going on - in fits and starts - for over a year, with flareups happening at different points across the many highly indebted countries around the world. Today’s post builds on my live stream from Sunday and does a Q&A on what’s happening, why it’s happening, what it means and whether or not this is a big deal.
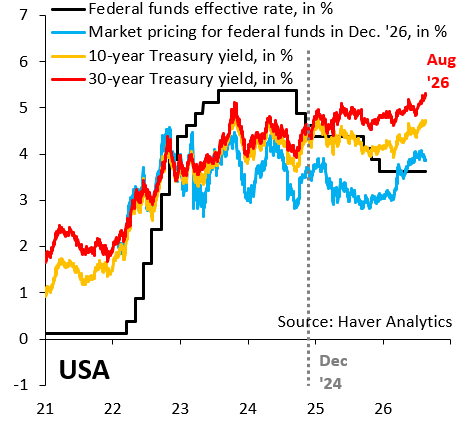
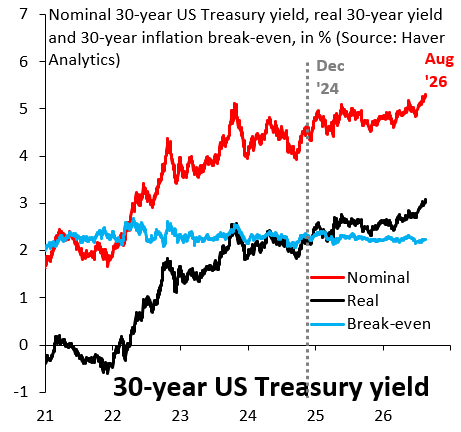
What’s happening? The chart above shows the yield curve for the US. At the very short end of the curve are the Fed’s policy rate (black line) and what markets price for this rate by the end of the year (blue line). At the long end of the curve are 10- (orange line) and 30-year (red line) Treasury yields, where it’s especially the latter that’s been rising lately. What’s notable about this rise is that it’s happening even as expectations for the Fed are moving in a dovish direction. This means the rise in longer-term yields is about markets pushing up risk premia, which may reflect a growing concern that fiscal policy and debt are out of control. The chart below decomposes the 30-year Treasury yield (red line) into break-even inflation (blue line) and the real rate (black line). Break-even inflation is stable, so whatever risk premium is getting put into long-end yields does not yet reflect inflation fears.
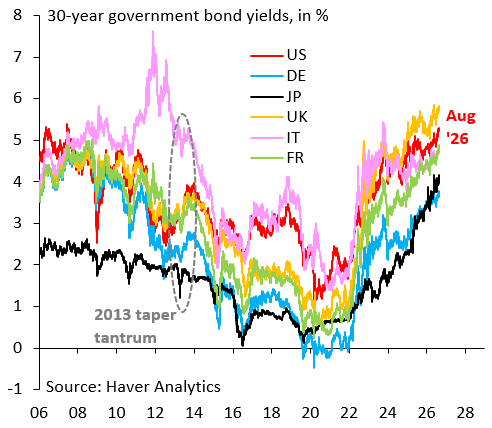
Where is this happening? The chart below shows 30-year yields for the US (red), Germany (blue), Japan (black), the UK (orange), Italy (pink) and France (green). The latest rise in yields is global, repeating the pattern we’ve seen in past yield spikes over the past year. That shouldn’t come as a surprise. Government debt has risen to alarming levels across many advanced economies and budget deficits are much too wide in most places given that this is a non-crisis period.
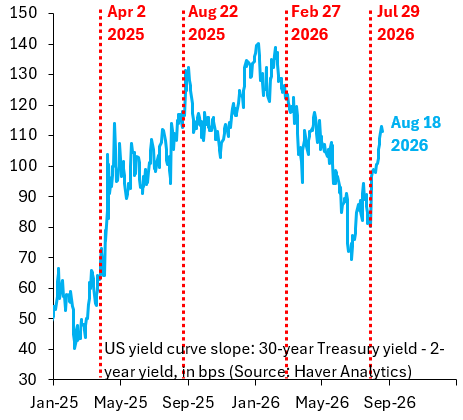
Why is this happening? The chart below shows the slope of the US yield curve, i.e. the difference between the 30- and the 2-year Treasury yield. The vertical red lines denote key turning points for markets over the past couple of years, which is the rollout of reciprocal tariffs on April 2, 2025, the dovish keynote by then Chair Powell on August 22, 2025, the start of the war with Iran in the night of February 27, 2026, and the most recent Fed meeting on July 29, 2026. It’s clear that the Fed is a major catalyst in the recent spike in long-term yields, much as was the case after last year’s Jackson Hole. This suggests markets are uneasy with a Fed that’s easing or on hold, likely because they see this as increased subservience to the White House. The recent rise in oil prices may be playing an additional role.
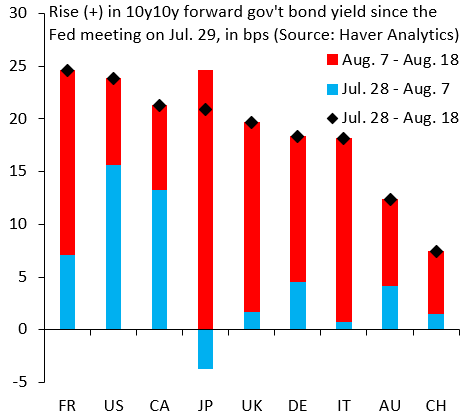
What does all this mean? This sell-off has evolved in two stages. The first came in the days immediately after the July 29 Fed meeting, which caused long-term Treasury yields in the US to rise. This is the blue bars in the chart below, which capture the rise in 10y10y forward yields from July 28 to August 7. The second stage began thereafter and saw what started out as a US-specific shock spread to other advanced economies (red bars). During this stage, as I note yesterday, high-debt countries have been hit hardest, so markets are sending a clear message that they’re running out of patience with reckless fiscal policy. So, even if the Fed is the immediate catalyst for what’s unfolding, the underlying issue is bad policy that’s left many countries vulnerable to any old shock that comes along.
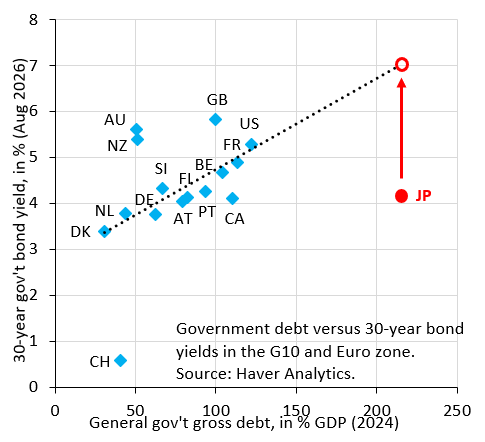
How worrying is all this? The underlying issue here - as I note above - is bad fiscal policy and governments that are increasingly leaning on central banks to artificially cap yields. Take Japan, where the 30-year yield is currently just above four percent. As the chart below shows, this yield - given the cross-country link between debt and yields - should really be around seven percent, so yields have a lot further to rise. The question, of course, is whether governments will allow this to happen and the obvious answer is that they won’t. The BoJ has no choice but to keep buying bonds so that yields don’t start rising uncontrollably. The ECB is in a similar predicament regarding high-debt countries on the Euro periphery. Yields thus can’t explode higher, but instead will keep grinding higher the way they have been. The underlying situation - one of fiscal and political dysfunction - is very worrying on a global scale.
No posts
Comments
Nothing yet. Say the first thing.
Sign in to join the conversation.