
Each week, I send out one Python tutorial to help you get started with algorithmic trading, market data analysis, and quant finance. Upgrade to a paid plan to access the Python code notebooks, Discord community, and code support.
Most trading ideas die in a spreadsheet.
You have a hypothesis about a stock. You download some data, maybe calculate a moving average, and stare at the numbers in a CSV file. The problem isn’t the idea. It’s that spreadsheets make it hard to interact with your analysis, share it with anyone, or build on it over time.
That friction kills momentum faster than a bad trade.
I spent years building web apps to analyze market data. The analysis part was always fast. The web development part (layouts, file structure, front-end code) took days or weeks. I’d lose interest in the actual trading question long before the app was finished.
Most beginners hit the same wall when they try to move beyond Jupyter notebooks.
Professional analysts at trading firms don’t build their tools from scratch every time. They use frameworks that let them focus on the analysis, not the plumbing.
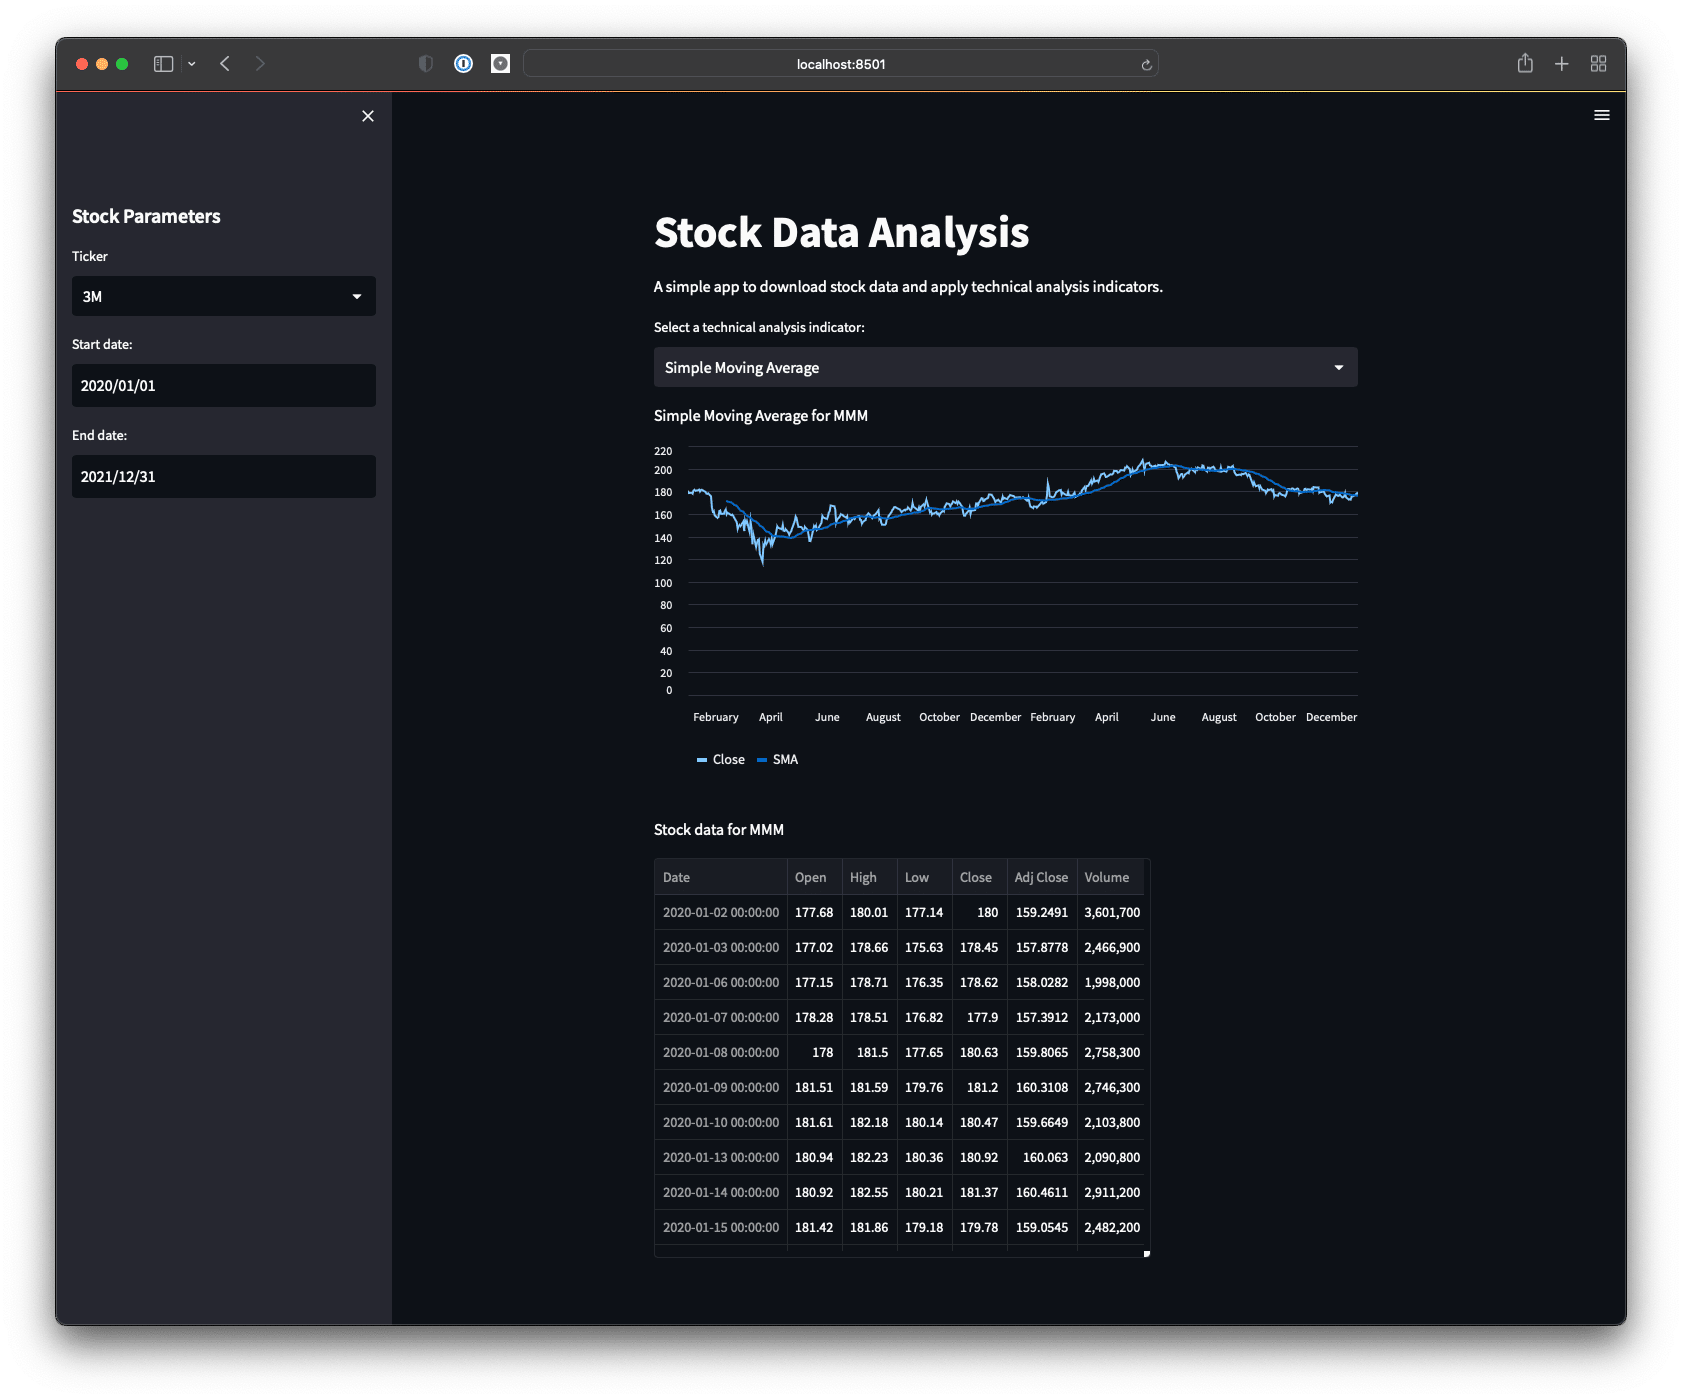
In this post, you’ll build a complete market data analytics app using Streamlit, a Python library that turns simple scripts into interactive web apps. You’ll pull live S&P 500 ticker data, apply technical analysis indicators, and see everything in your browser, all in about 50 lines of code.
Let’s go.
Comments
Nothing yet. Say the first thing.
Sign in to join the conversation.