
This day week the cabinet will decide on whether or not to allow Metrolink to proceed to its final stage before pulling the trigger. Next week’s step is called Approval Gate 2 (AG2).
AG2 is the second of three formal decision gates. At AG2, the cabinet decides whether to allow the project’s tenders to be finalised. At Approval Gate 3 (AG3), a final decision is made whether to proceed with the project based on the tenders received.
AG2 is not the final decision. But, should cabinet not want to proceed with Metrolink, AG2 would be be the time to bail. It would be easier to do so now than at the AG3 stage.
The cabinet will either approve AG2 on the day, deny approval, or delay it. Obviously, a decision to deny approval at this late stage would be a huge story. But a delay would also have big ramifications. A lot has been invested in the project, by both the state and by private sector partners. The first of two batches of tenders has gone out and has attracted interest from the biggest players in the industry. There are seven consortia interested in the project – a great result. A delay would further damage trust with the companies we’re hoping to closely collaborate with for the next ten years (and again for the following project).
Today I want to talk about some of the relevant considerations.
A common objection is that Metrolink is unsuited to Dublin because Dublin is a low-rise city: “A high density solution for a low density city”. Better, it’s said, to build cheaper transport systems like buses that match Dublin’s low density character.
To that I would say two things. The first is that metros change the character of the cities they serve. Dense cities don’t get dense before deciding they need a metro system1. They co-evolve. Transport capacity is a ceiling on density.
Metro systems’ ace card is their carrying capacity. Metrolink will have the capacity of a 17 lane motorway. That’s enough capacity to serve up to 100,000 homes. In an expensive city, with long commutes, people will build homes along the Metrolink line to take advantage of its giant capacity. Metrolink will facilitate lots of housing and make Dublin denser in the process.
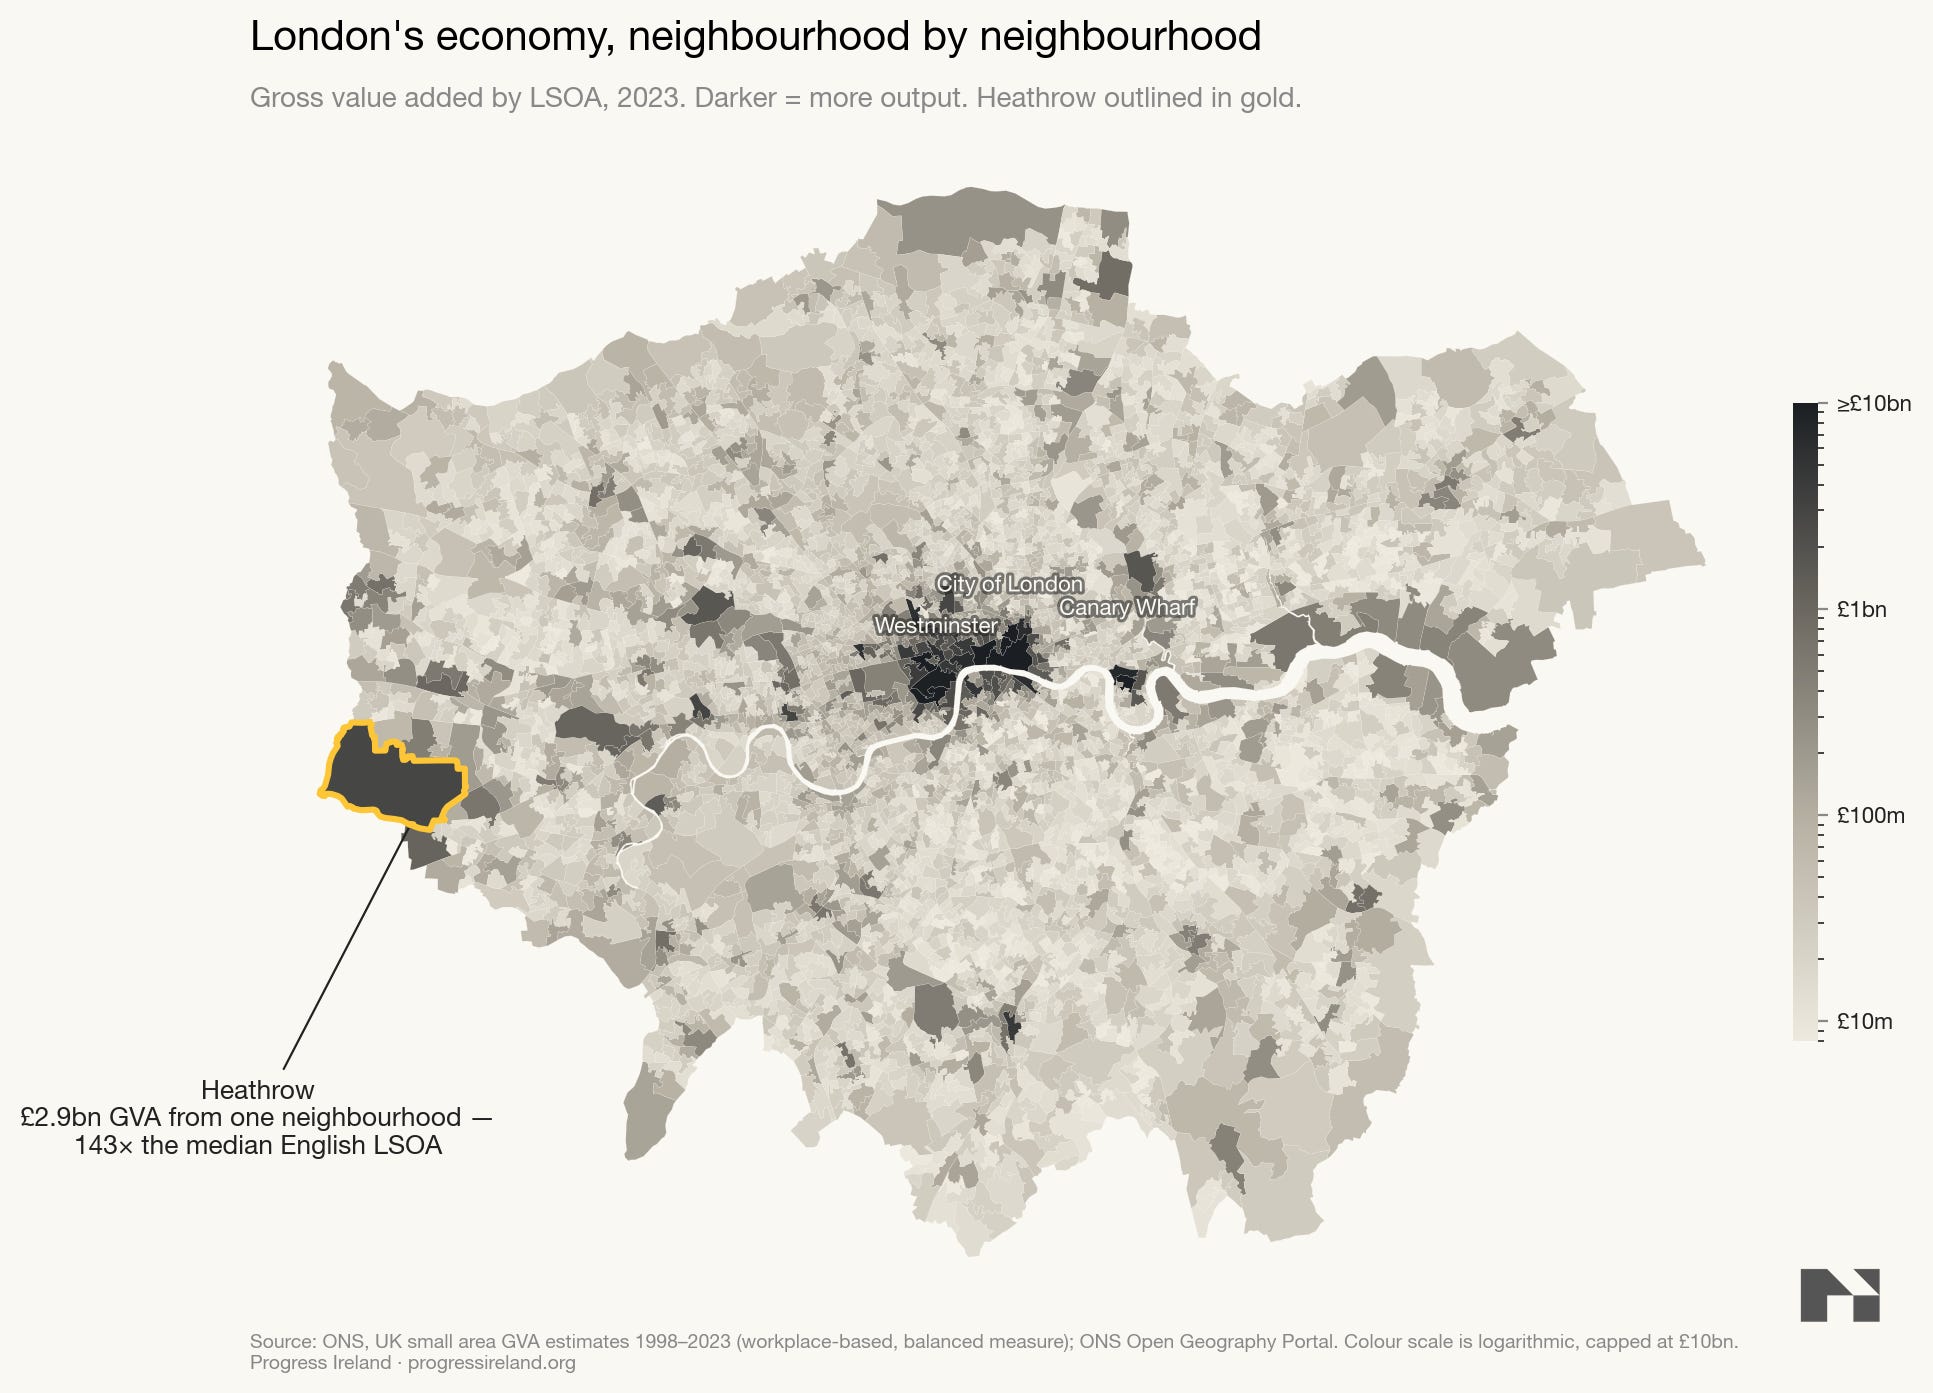
The second thing to say is that airports are not normal places. Modern economies depend on them. Companies choose to locate their headquarters near them. The following map of gross value added in London neighbourhoods shows that economic activity is concentrated on the corridor between the city centre and Heathrow. The corridor between the city centre and Heathrow is rich with international business headquarters2.
Though, since the opening of the Elizabeth line that connects the airport to the city centre, many companies have moved along the line to more central locations3.
From a transport engineering perspective, an airport makes an ideal destination because it provides all-day demand in both directions. The airport makes a great anchor tenant of a line.
Studies have found a strong relationship between air connections and local economic growth. Campante & Yanagizawa-Drott found better connectivity led to 0.8 per cent extra annual local growth. Bel & Fageda found 10 per cent more intercontinental flights led to 4 per cent more headquarters. Brueckner found more flights led to more service jobs.
Government’s analyse projects using benefit to cost ratios. Benefit to cost ratios try to quantify the social benefits and costs of government projects. I wrote about them last week.
The last time the cabinet looked at Metrolink its benefits were calculated at 40 per cent greater than its costs (for a benefit to cost ratio of 1.4). That was in 2021.
Three big things should shift the benefit to cost ratio since 2021. The first is that expected construction cost has increasedFN from €9.5 billion to €15-18 billion. That pulls the benefit to cost ratio down.
The second is that the population has grown faster than expected. This shifts the benefit to cost ratio up by 0.2 to 0.44.
The third point is that the BCR methodology excludes any benefits that arise from changes in land use. As we’ve seen, more intensive use of land is the primary purpose of an urban metro system. New South Wales used a methodology called Land Use Transport Interaction to quantify these benefits. For a Sydney metro line, it found 20 per cent of aggregate benefits flowed from changes in land use.
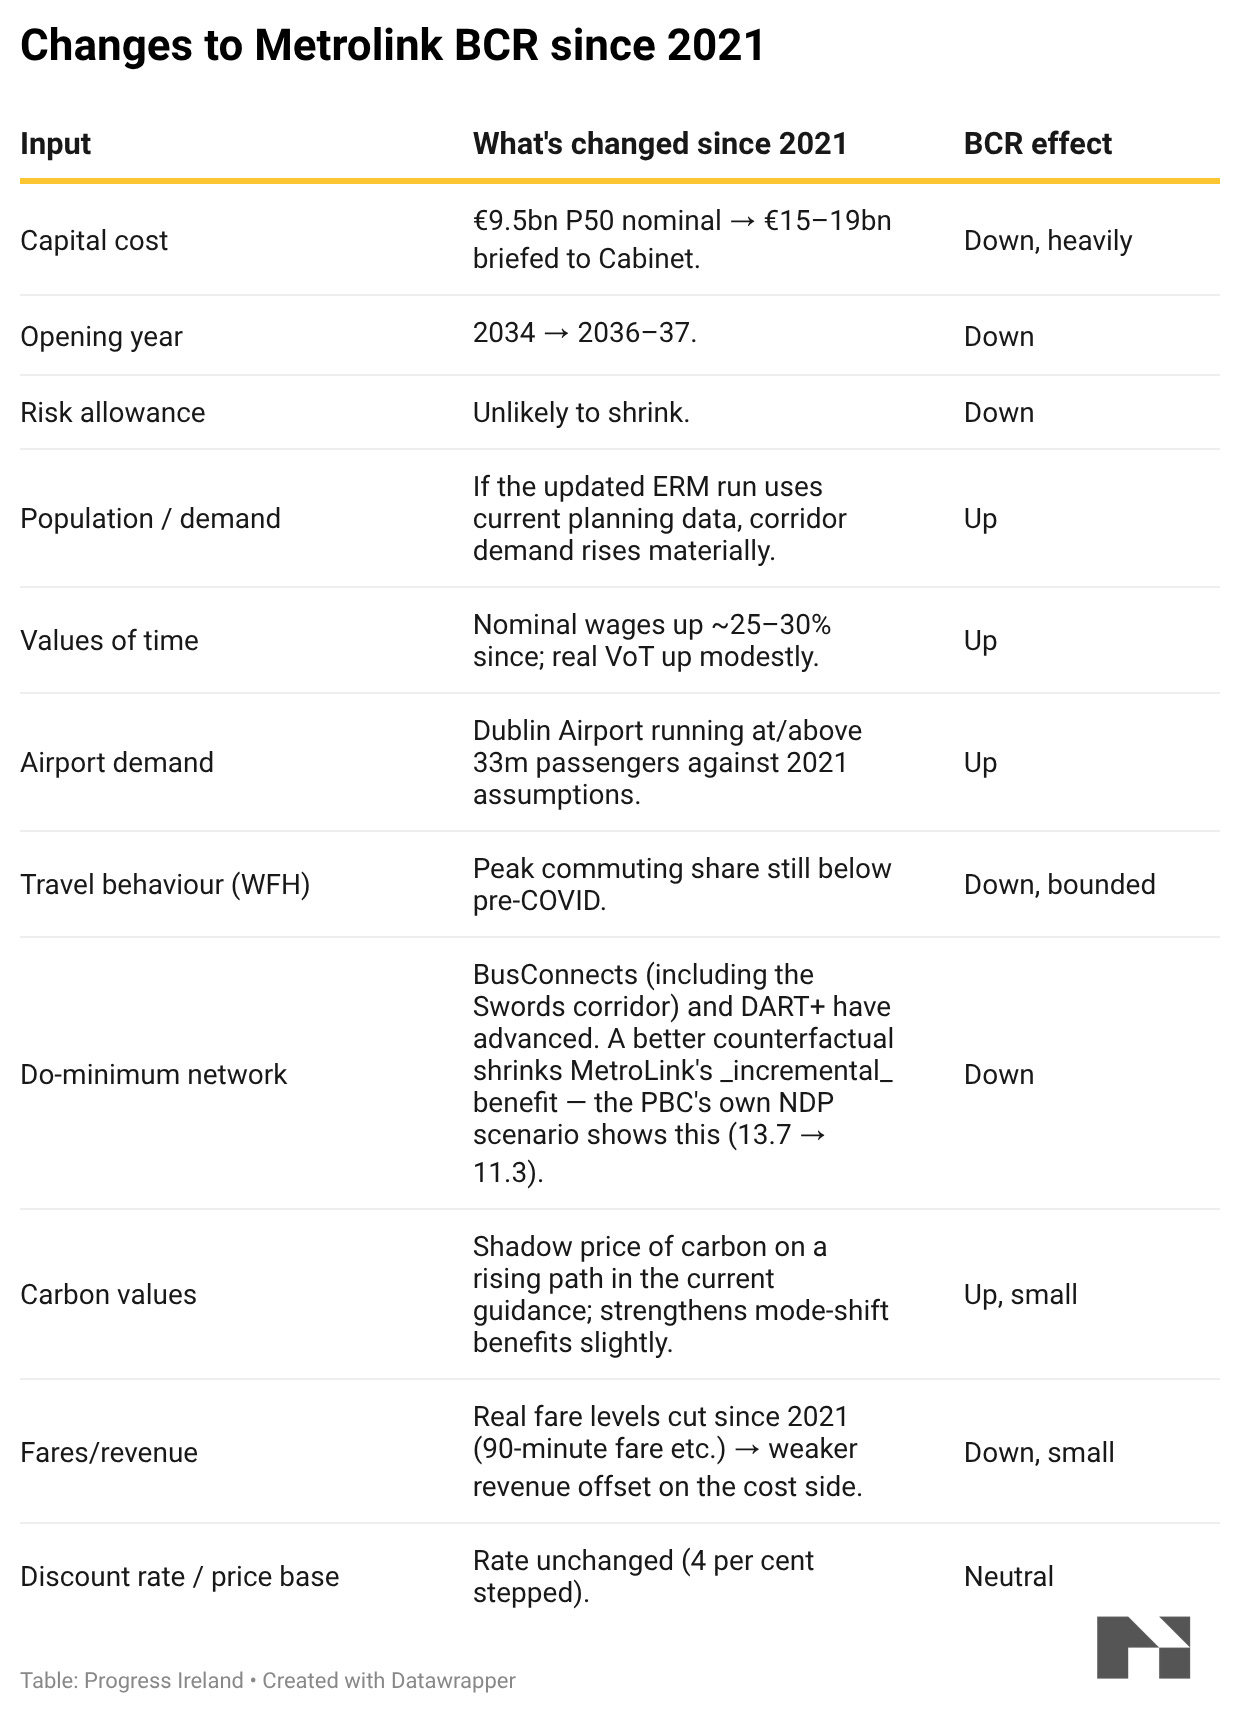
To be sure, costs could end up being even higher than €18.8 billion. As we’ll see later, the most catastrophically expensive metro projects in history cost 2-3x more than this on a per kilometre basis. For reference, those projects rank in the top one per cent of costs globally.
Should things go this wrong, Metrolink would be hard to justify. Regardless of other benefits.
It would be a mistake to consider Metrolink in isolation.
We saw yet more evidence yesterday of Ireland’s rapid population growth. Population growth in Ireland is the fastest in the EU5, and Ireland’s population is forecast to grow at the fastest rate in the EU6. We are turning from a small country into a medium-sized country. That means we’ve got to build bigger, more complex cities and new infrastructure. We are levelling up.
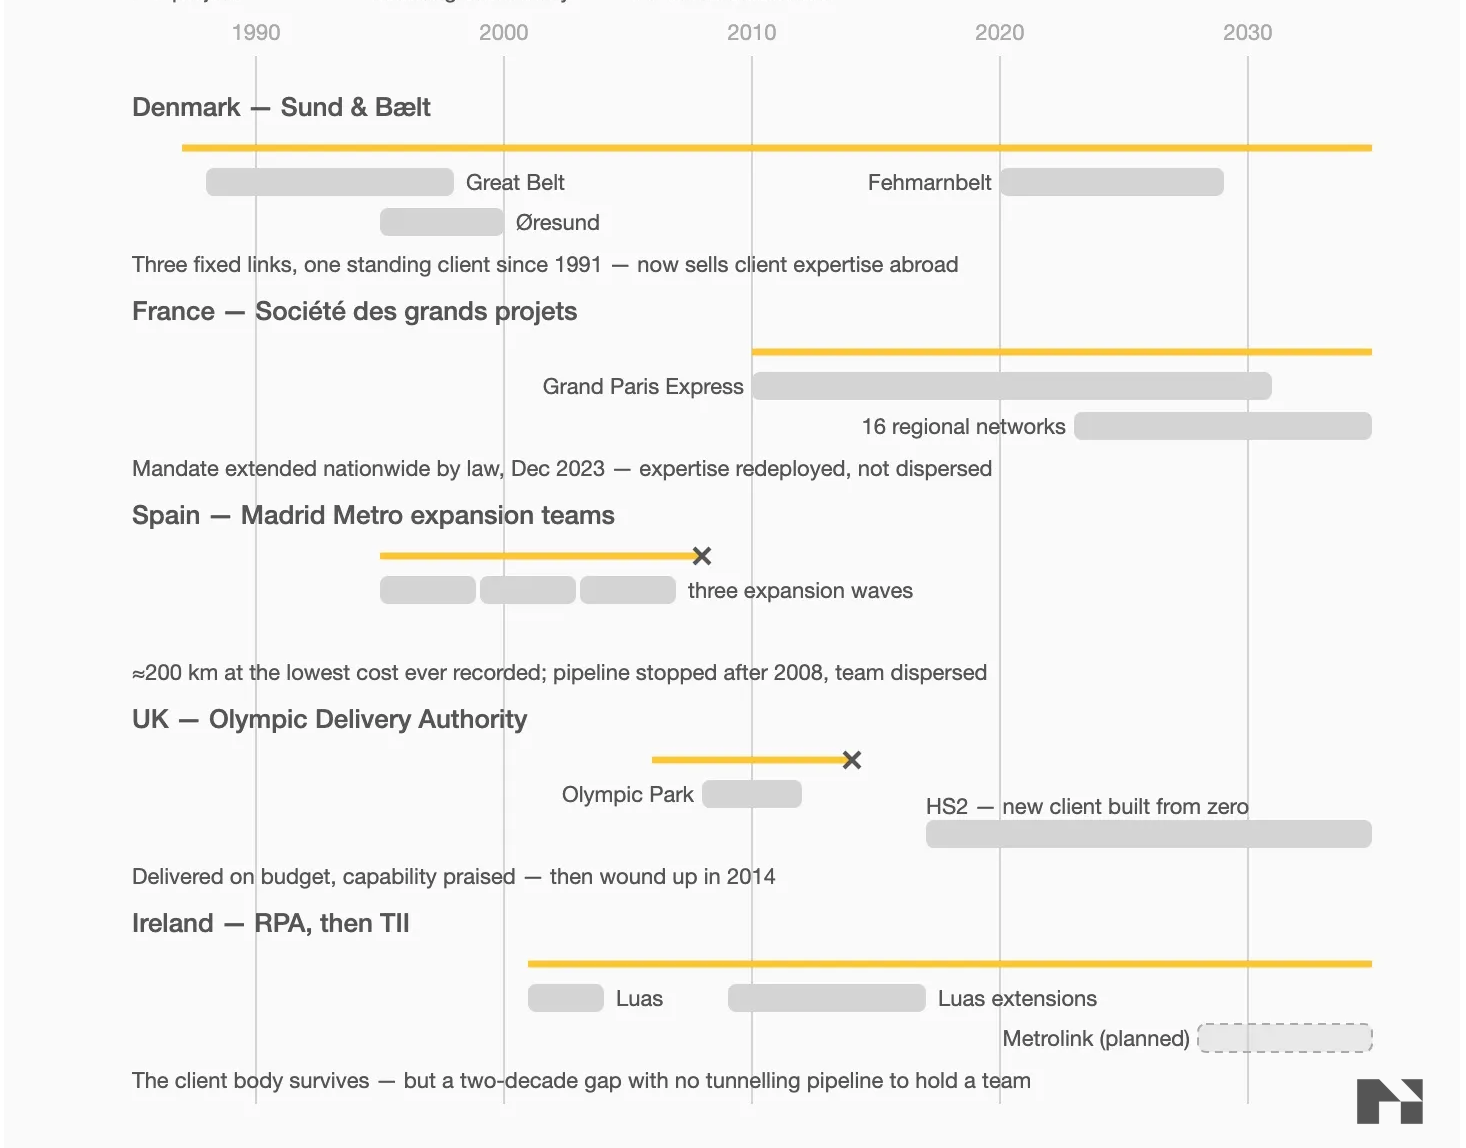
Metrolink is the first of many complex infrastructure projects we’re going to face in the coming decades. These projects demand a lot of the state. They need an experienced client that knows how to manage big budgets, big risks and sophisticated counterparties.
Metrolink can be the anchor tenant for all these state capacities. It is the project that justifies investment in the state’s skills and expertise. These skills will pay off for decades to come.
This is how things have worked elsewhere. Denmark’s state owned delivery agency was spun up to build The Great Belt link. It has since delivered the Øresund bridge to Sweden and is now building the Fehmarnbelt tunnel to Germany. Paris set up the Société des grands projects in 2010 to deliver a program of Metro expansion; in 2023, its mandate was extended nationwide and it now supports 16 regional express rail projects.
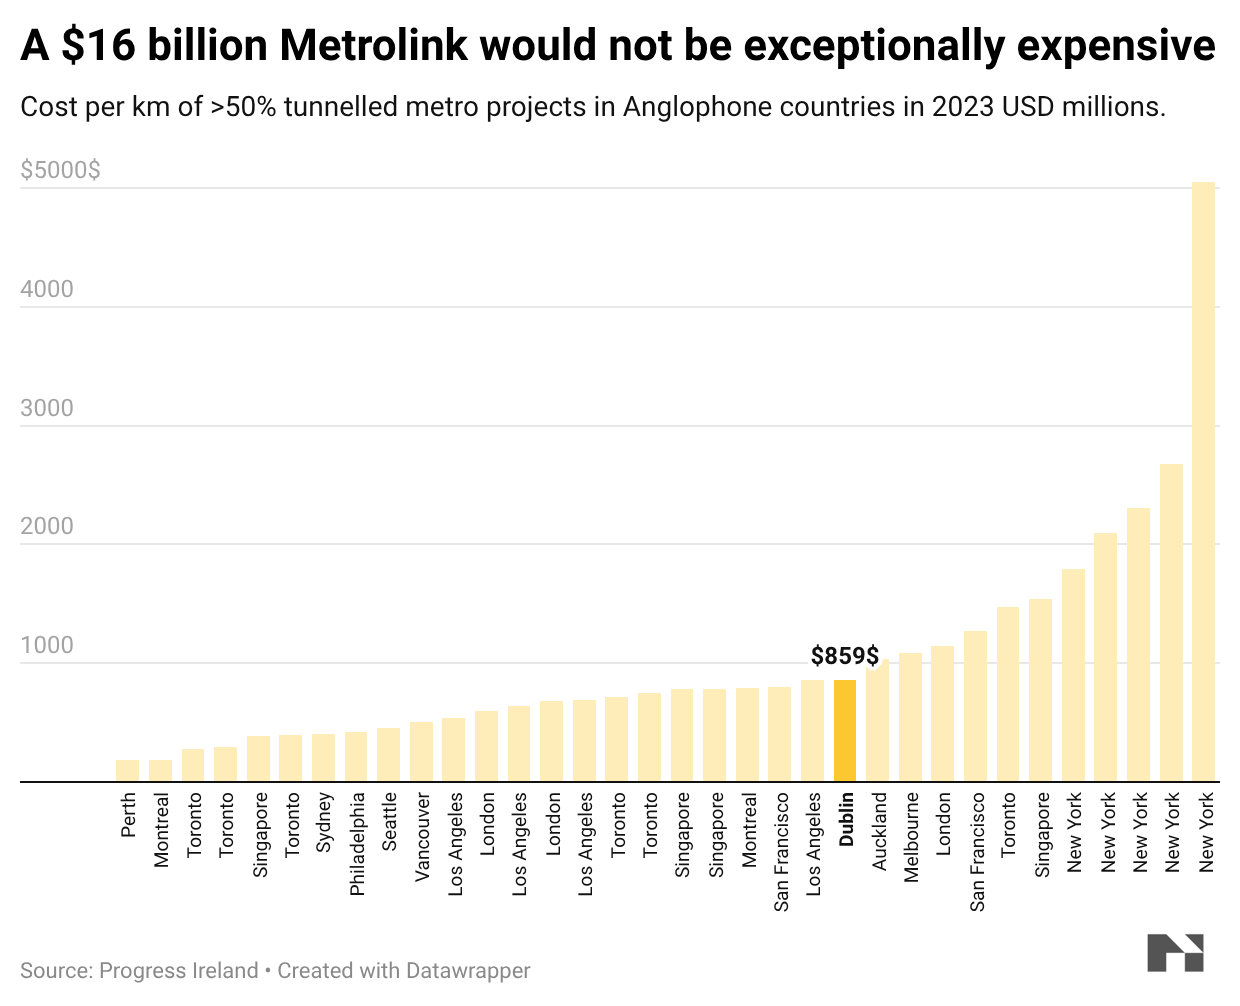
€15-18.8 billion seems like a lot of money. Is it?
Using the Transit Cost Project’s data, I created a reference class of projects in English-speaking countries that are more than 50 per cent tunnelled. In order to make an apples-to-apples comparison I deflated Metrolink’s 2026 cost projection to 2023, stripped out €2 billion of costs7, and converted to dollars. Then I ranked them on a per-kilometre basis.
As you can see, Metrolink would be around the middle of the pack among English-speaking countries8.
Metrolink will be a big project, to be sure. Short of building a nuclear reactor there is no bigger category of infrastructure project. But let’s keep perspective. Annual spending on Metrolink should peak at The state spent €110 billion last year. The often-cited Ardnacrusha project ran to five per cent of spending per year for four years.
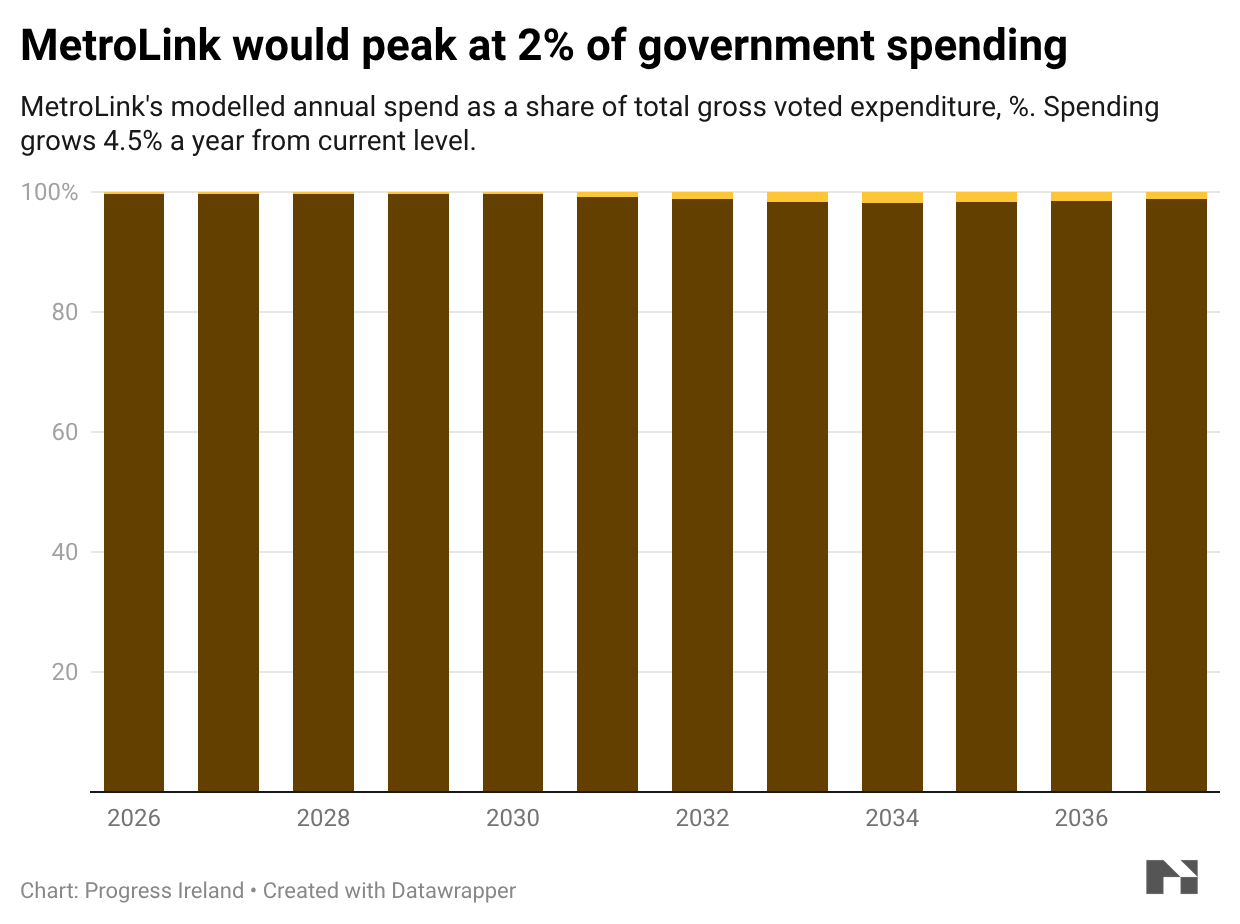
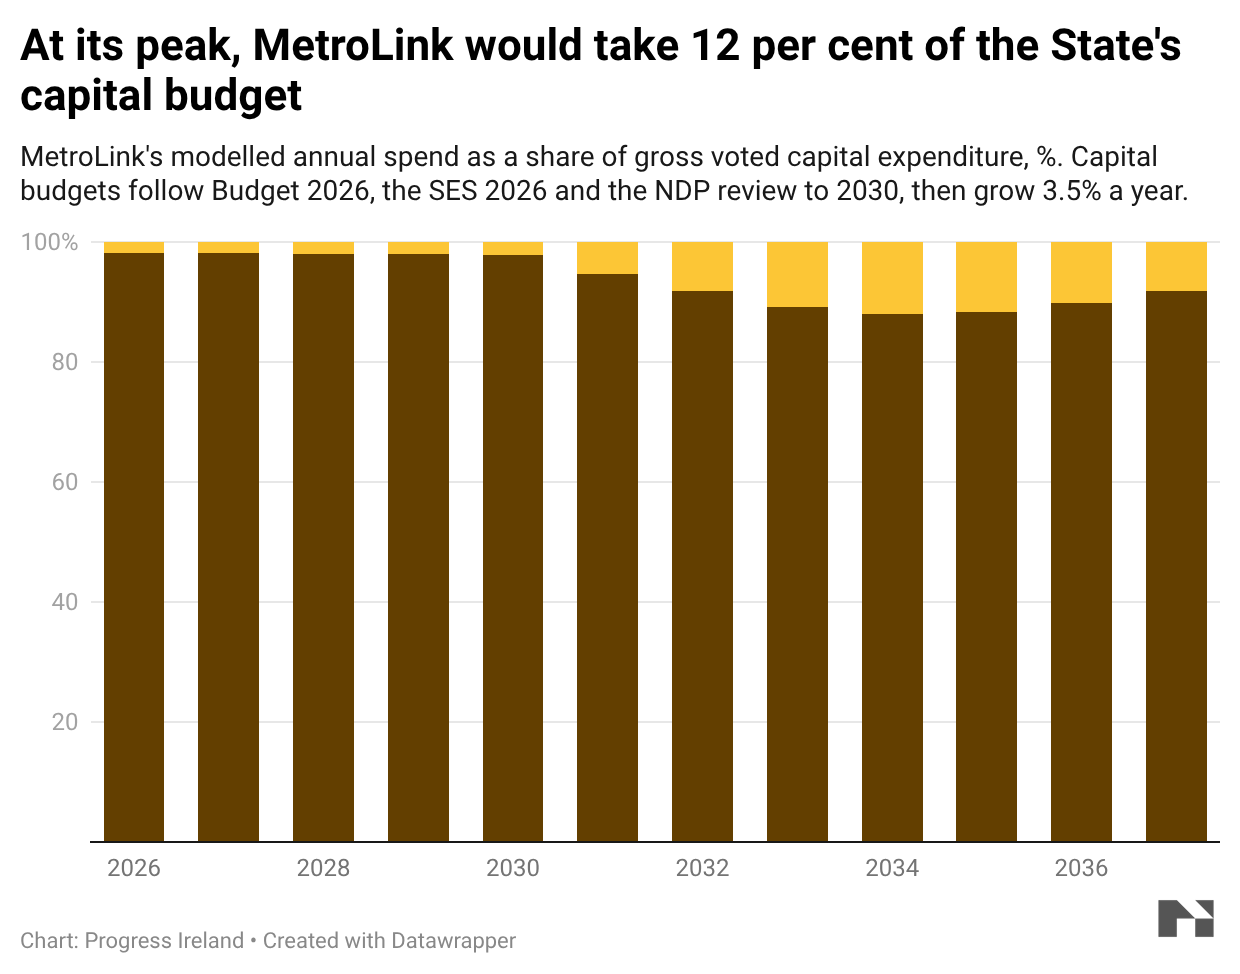
We’ve argued til we’re blue in the face that Metrolink needs a delivery agency with a) experienced leaders and b) meaningful control over the project. The failure mode associated with the most catastrophic projects above is of a lightweight or bureaucratic client team. The next step after AG2 is to formalise governance. This is our one and only chance to get the governance right, and we shouldn’t blow it.
FN SPPR3 of the Building Height Guidelines requires present, not planned, transport capacity. That’s a bad rule and it needs to go.
Apple UK
Canon (EMEA HQ)
Gilead Sciences UK
Hasbro UK
Bristol Myers Squibb (Celgene) UK
pladis (United Biscuits)
Coca-Cola Europacific Partners GB
Mondelez UK (Cadbury)
Xerox UK, Hertz Europe, Amgen UK
Cisco UK
SAP UK
IBM client centre
British Airways (global HQ) / IAG operations
Heathrow Airport Holdings
IAG Cargo
Sky Group
Sega Europe
JCDecaux UK
Starbucks EMEA
Danone UK
Tullow Oil (global HQ)
QVC UK, Swarovski UK, Aker Solutions
BSI Group
Cineworld
Fuller’s
Disney UK & EMEA
L’Oréal UK & Ireland
Novartis UK
UKTV
GSK
Marks & Spencer (global HQ)
Kingfisher (global HQ)
Microsoft UK
Visa Europe
The PBC slow-growth scenario gives a useful reference. Forecast MetroLink boardings were 4 per cent, 9 per cent, and 15 per cent lower. The revised BCR fell from 1.4 to 1.2.
Current data show that population and employment growth are higher than the values in the appraisal. If we apply the same relation in the opposite direction, the previous BCR increases by approximately 0.2.
Among countries with a starting population of greater than one million since 1995.
Among countries with a population greater than one million.
€2bn of costs are stripped out of the Irish estimate so they’re apples-to-apples with the Transit Costs Project.
To be sure, if the reference class was widened to include non-english speaking countries, Metrolink would look a lot worse.
No posts
Comments
Nothing yet. Say the first thing.
Sign in to join the conversation.