
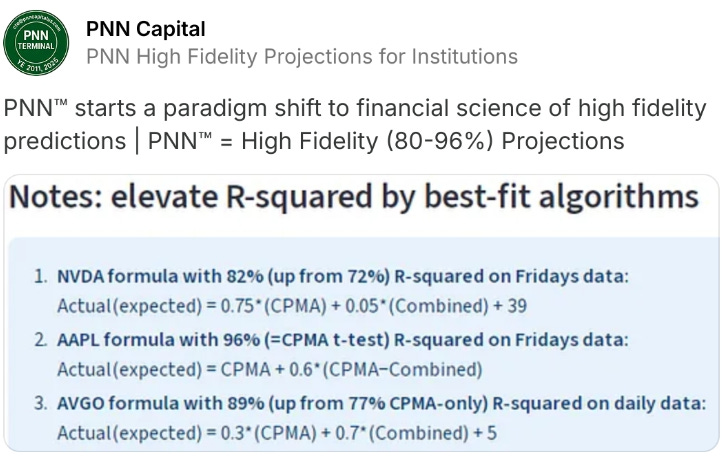
Historically, AAPL CPMA projections produce the highest fitness to AAPL actual prices (t-test R-Squared), compared to Call and Combined Projections.
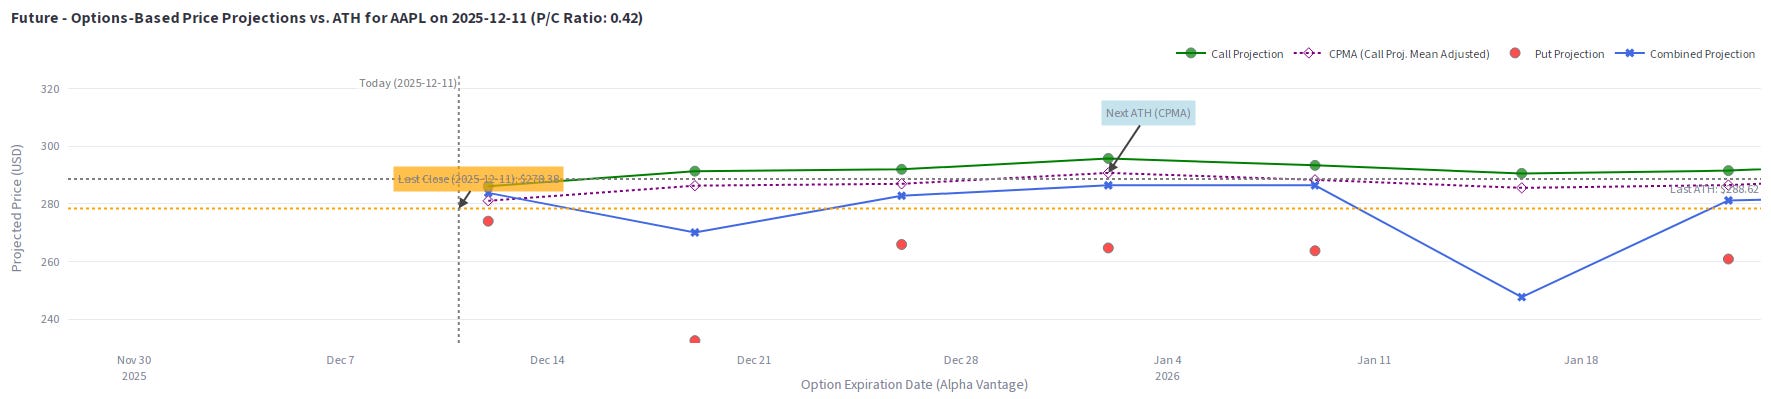
Based on the chart provided, here is an analysis of the CPMA (Call Projection Mean Adjusted) for AAPL over the next 4 weeks from the chart’s “Today” date of December 11, 2025.
The CPMA is represented by the purple dotted line with hollow diamonds.
General Trend: Moderate Bullishness
The CPMA indicates a steady, low-volatility upward trend over the next month. Unlike the “Combined Projection” (blue line), which shows significant volatility and a sharp drop in late January, the CPMA suggests a more stable climb.
Week 1 (Dec 11 - Dec 18): Gradual Rise
Starting Point: The CPMA starts slightly above the “Last Close” price of $278.38.
Projection: The line slopes gently upward, ending the week roughly around the $282 - $284 range. It maintains a healthy buffer above the current price.
Week 2 (Dec 19 - Dec 26): Approaching Resistance
Projection: The upward trend continues. By the expiration date around Dec 26/27, the projection approaches the $286 - $287 level.
Context: It is closing in on the “Last ATH” (All-Time High) resistance level of $288.62 (indicated by the grey dotted line) but hasn’t broken it yet.
Week 3 (Dec 27 - Jan 4): The Breakout (New ATH)
Projection: This is the most significant week in the projection. The chart explicitly flags this data point with a blue box labeled “Next ATH (CPMA)”.
Price Target: The purple diamond crosses above the grey dotted ATH line ($
288.62).Significance: The model predicts that call option pricing supports a breakout to a new record high during the first week of January 2026.
Week 4 (Jan 5 - Jan 11): Stabilization
Projection: Following the breakout, the CPMA flattens out.
Price Target: The price appears to stabilize or retrace very slightly to hover right around the $288 - $289 level. It essentially turns previous resistance (the old ATH) into support.
According to the CPMA metric on this chart:
Direction: Upward.
Key Target: Breaking the $288.62 All-Time High.
Timeline: The projection anticipates hitting this new high in roughly 3 weeks (around Jan 4, 2026).
Sentiment: The CPMA is significantly more optimistic than the “Put Projection” (red dots) and the “Combined Projection” (blue line), suggesting that the specific “mean adjusted” call option data is signaling strength for AAPL.
This material is used under fair use for educational purposes only. “Projection Bus Change” can happen to change the course of the projections.
The new notion of “Projection Bus Change” by PNN Terminal can start a paradigm shift for investment research & practice: from backward finance to forward finance (financial science of high fidelity predictions).
CAPM (Sharpe, Markowitz, Miller 1990) is a great notion for backward Finance of summarizing historical data. For the forward Finance of high fidelity projections and forecasting, projection bus change - a newly created financial term, is a key notion.
Here is the definition: when a stock’s actual price follows PNN combined projections (Ye 2011 2025), we define it is on a combined bus; similarly CPMA (call projection mean adjusted) bus. When the actual price changes bus from combined to CPMA, we call it up a bus; from CPMA to combined, down a bus. Events, earnings, news can cause a bus change.
Citations:
Ye 2011 Wiley book of “High Frequency Trading Models”;
Ye 2025 USPTO 19/245,322
No posts
Comments
Nothing yet. Say the first thing.
Sign in to join the conversation.