
Many long/short portfolio managers think about earnings in three phases (t ± 7 days): 1. the week before earnings, when analysts typically finalize previews, 2. the day of the actual print and 3. the week after earnings:
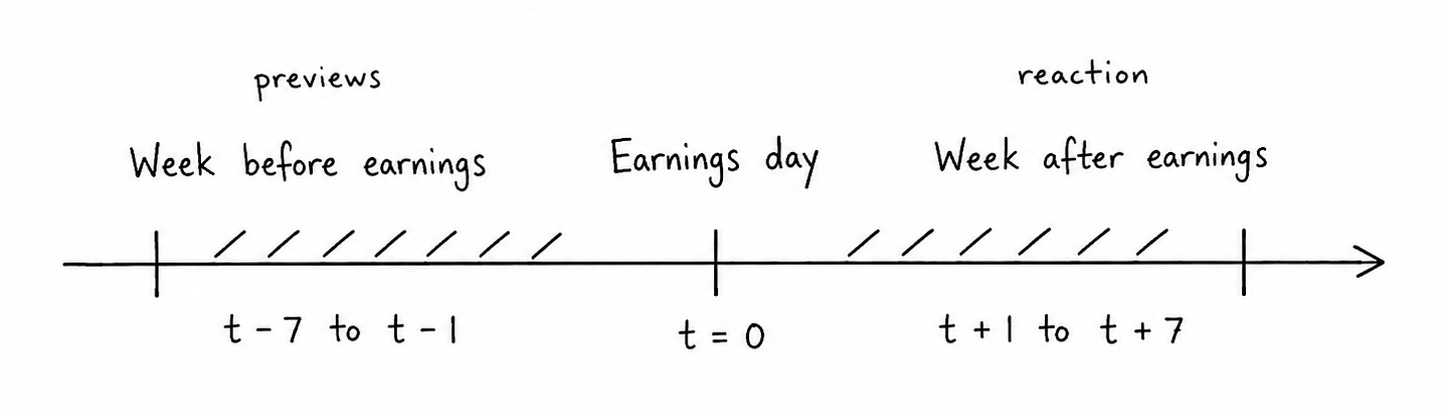
This is what investors have historically treated as “earnings season”. The timeline has shifted significantly given the amount of constant intraquarter changes in expectation.
More importantly, the notion of earnings as some some single-dimensional catalyst, where a PM holds a position on earnings day, is false. We zoom in and dissect the actual earnings timeline and explain the windows where risk/reward might be more attractive, using MSFT’s and AMZN’s earnings from the past few days as examples.
We also touch on what happened with HIMS, which we discussed as a popular short setup last week when covering the hidden art of finding variant views.
The one-week period (t ± 7 days) before and after earnings day is arbitrary, but it is what PMs have historically considered the core of “earnings season”. That window has now extended dramatically, particularly on the pre-earnings side. Some PMs at large multi-managers joke that you now need to do a preview for the preview. It is now more like two months rather than one week, with significant intraquarter expectation changes in the weeks and sometimes months leading up to earnings due to the rise of incremental information sources: alternative data, channel checks, independent research providers. Just look at the sheer volume of research published on semiconductor stocks every week.
Since expectations can continuously change in a significant way intraquarter (the red period below), the correct sketch diagram now looks more like this:
Comments
Nothing yet. Say the first thing.
Sign in to join the conversation.