
Dear investors,
In April 2026, a failing sneaker company announced it was selling its shoe business — the only business it had ever operated — for $39 million, roughly 1% of what investors had valued it at five years earlier.
It had lost money every single year of its existence as a public company. Its revenues had fallen nearly 50% since its IPO. Its most recent quarterly filing carried a going-concern warning. It was, by any conventional measure, a company in the final stages of an orderly dissolution.
Then it changed its name to NewBird AI and declared ambitions to become a GPU-as-a-Service provider. The stock surged +605% in a single trading day.
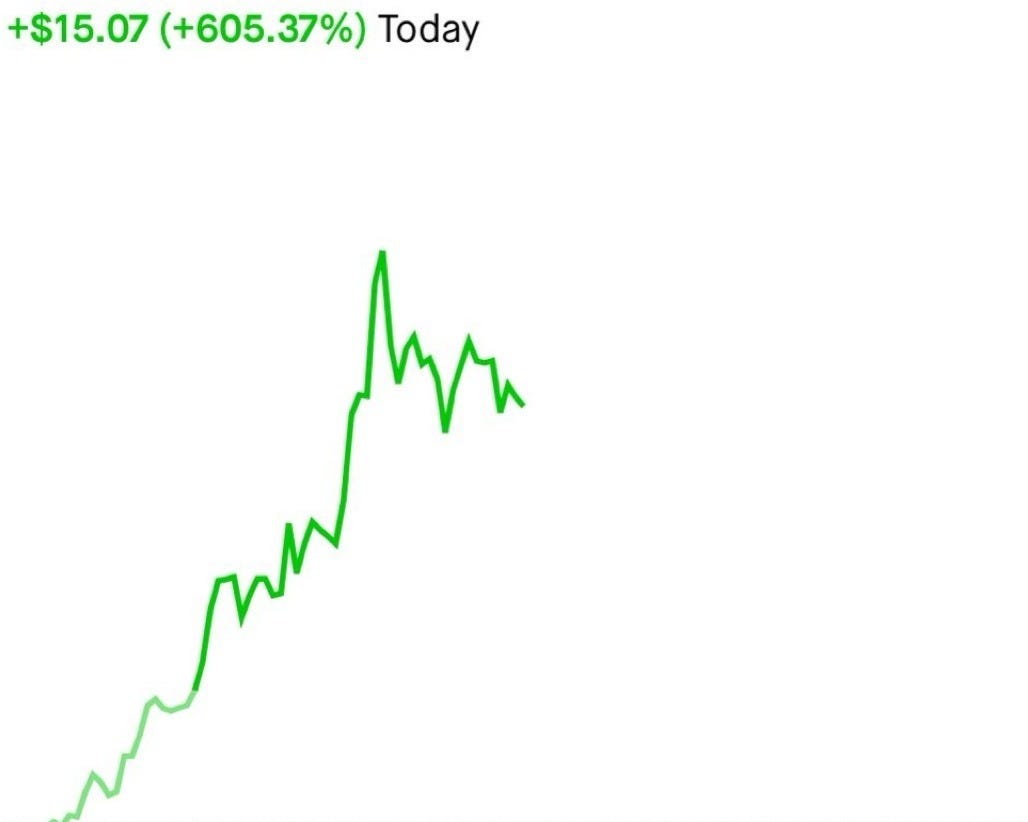
No new technology. No new revenue. No new customers. Two new letters — AI — appended to a corporate identity, and half a billion dollars in market value materialized from thin air before the closing bell.
The company also quietly asked shareholders, in the same announcement, to remove all references to its founding environmental conservation mission from its charter.
It abandoned its shoes, its purpose, and its history simultaneously — and the market rewarded it with the best trading day in its existence.
If you are looking for a single image to capture where we are in this cycle, you have found it.
Here is a second one.
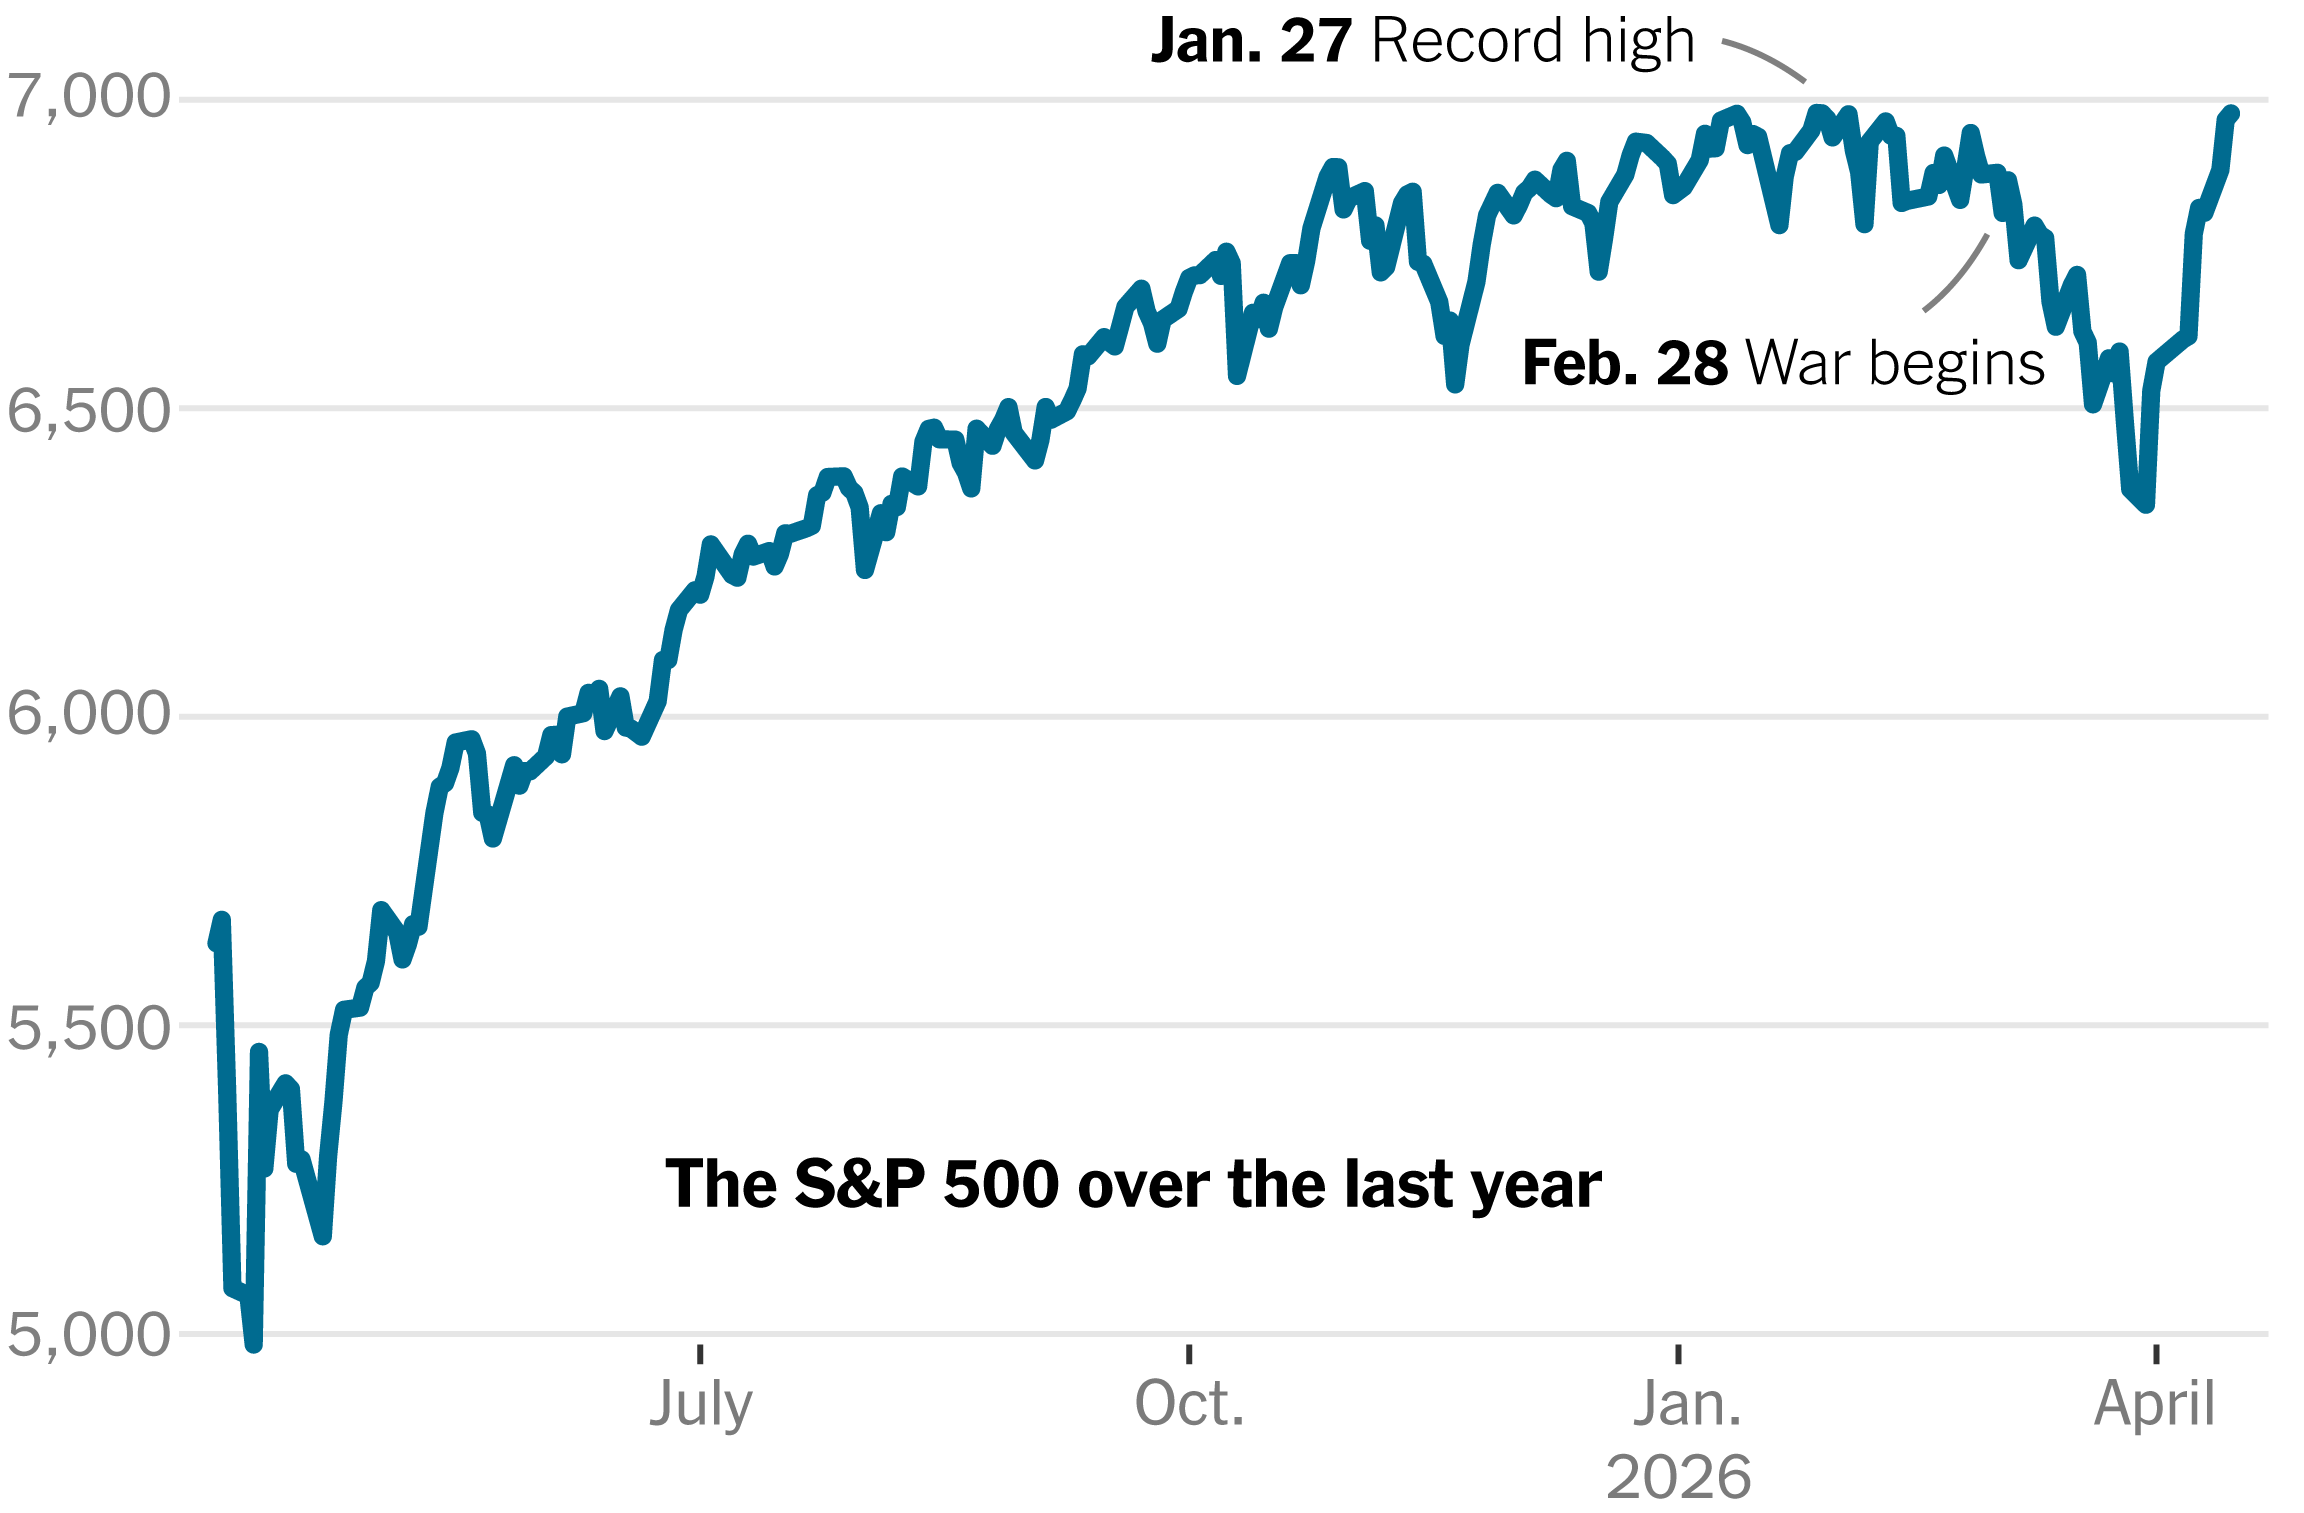
On April 15, 2026, the S&P 500 closed at a fresh all-time high of 7,022 — fully erasing every loss sustained since the US-Iranian war began.
The Nasdaq posted its eleventh consecutive day of gains, its longest winning streak on record. The financial press celebrated the V-shaped recovery. Sentiment shifted from extreme fear to neutral in a matter of weeks.
Oil is trading above $90 per barrel. The energy crisis that began when the conflict erupted has not resolved.
The real economy — the one where ordinary people fill their tanks, heat their homes, and pay input costs that flow through to every consumer price — is being strangled.
And indexes are at all-time high.
This is what late-stage bubbles do when they encounter bad news: they ignore it, narrate it away, and resume the ascent.
The market is not pricing the current reality.
It is pricing the hope that the current reality will disappear — and doing so at valuations that assume decades of perfection even before the crisis is resolved.
A shoe company adding the letters “AI” to its name surges 605% in a day.
The index hits an all-time high while the world’s most critical oil chokepoint remains closed.
There is a chart making the rounds alongside these stories. You have probably seen it.
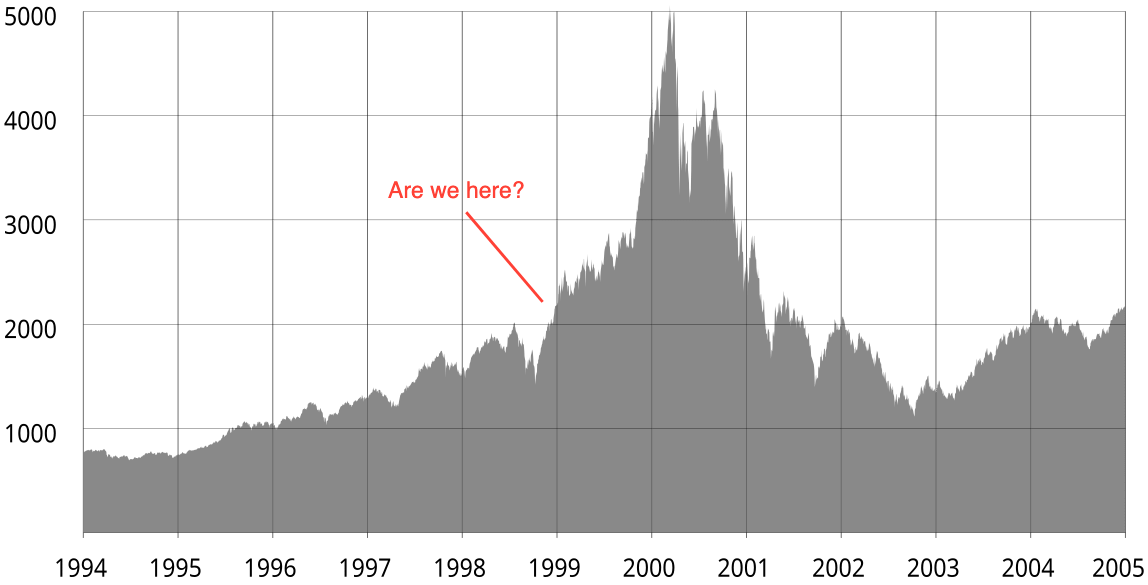
The Nasdaq’s parabolic ascent from 1995 to March 2000 — smooth, exponential, almost elegant in its geometry — followed by a collapse so violent it erased $5 trillion in wealth and took fifteen years to repair. The chart does not need much annotation.
It speaks in the universal language of human greed and its inevitable correction.
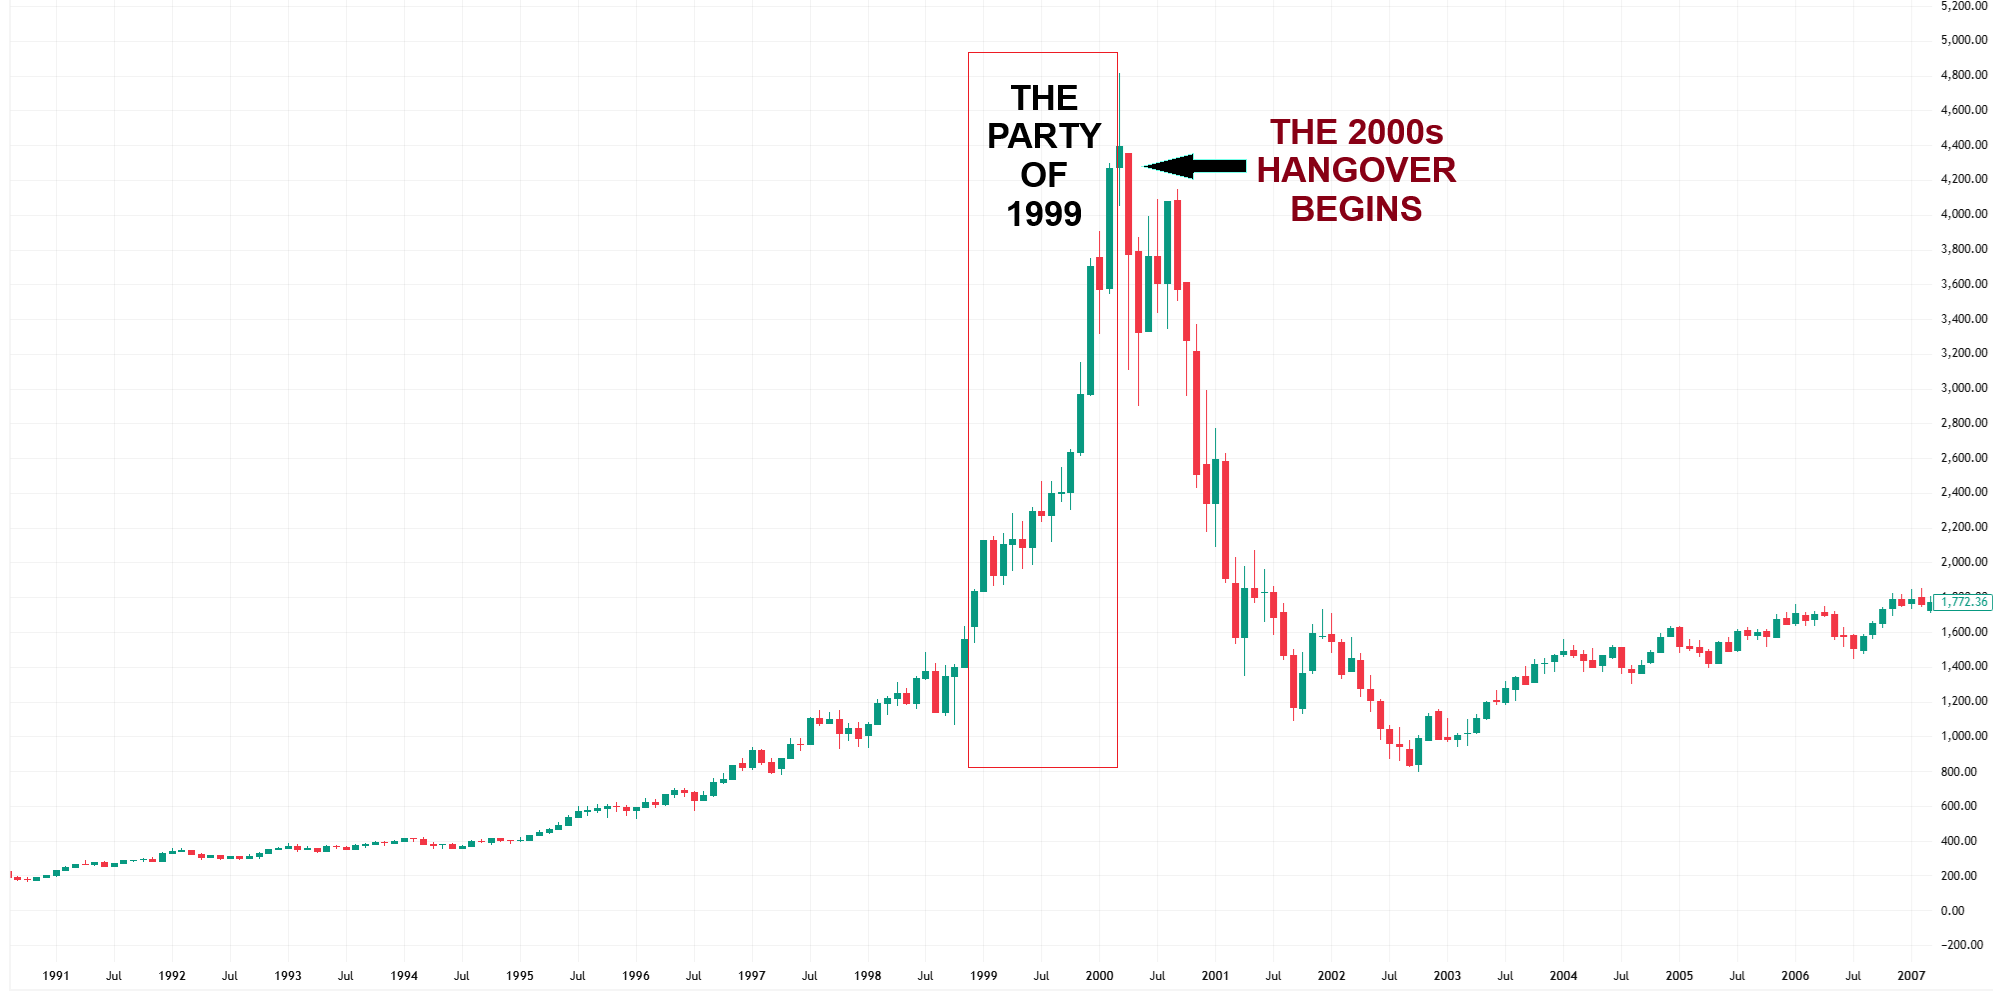
Same concentration of gains in a handful of names that everyone now treats as permanent fixtures of the financial universe. Same chorus of voices explaining, patiently and convincingly, why this time the old rules do not apply.
Every generation of investors believes it has discovered something the previous generations were too unsophisticated to understand.
The 1999 generation believed they had discovered the internet. They were right. The internet did change everything.
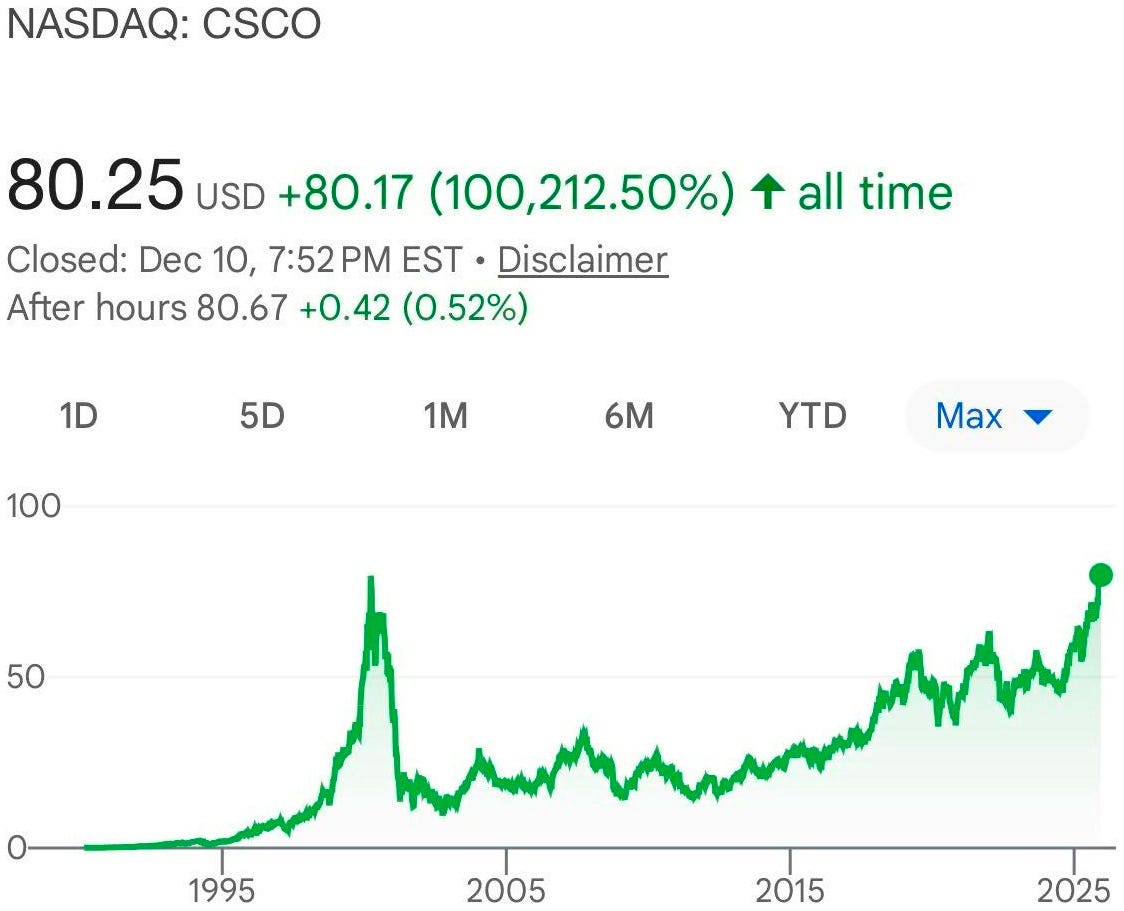
It just did not change the mathematics of valuation, and the people who bought Cisco at 150 times earnings in March 2000 are still waiting to break even — not because Cisco failed, but because the price they paid left no room for the company to grow into its own ambitions.
NewBird AI is a thermometer.
We are here again. The valuations are back. The narratives are back. The only thing missing is the crash — and the greatest capital allocators in history are quietly, methodically preparing for it.
The U.S. Treasury collapse is HERE!
Foreign buyers are gone. Interest costs just hit $1.21 TRILLION. Central banks are dumping dollars and hoarding gold at the fastest pace in history.
Ray Dalio calls it an “economic heart attack.”
25,000+ readers already repositioned with the exact 3 crisis-proof portfolios that thrive when bonds break and the dollar cracks.
Get the complete 2026 Protection Playbook — full portfolio allocations, rebalancing triggers, and real-time alerts — before the next leg down hits.
The Shiller Cyclically Adjusted Price-to-Earnings ratio is not something you use to call tops in the morning and cover shorts in the afternoon.
It is something closer to a geological instrument — it measures the deep pressure accumulating beneath the surface, the kind that takes years to build and releases in ways that reshape the landscape permanently.
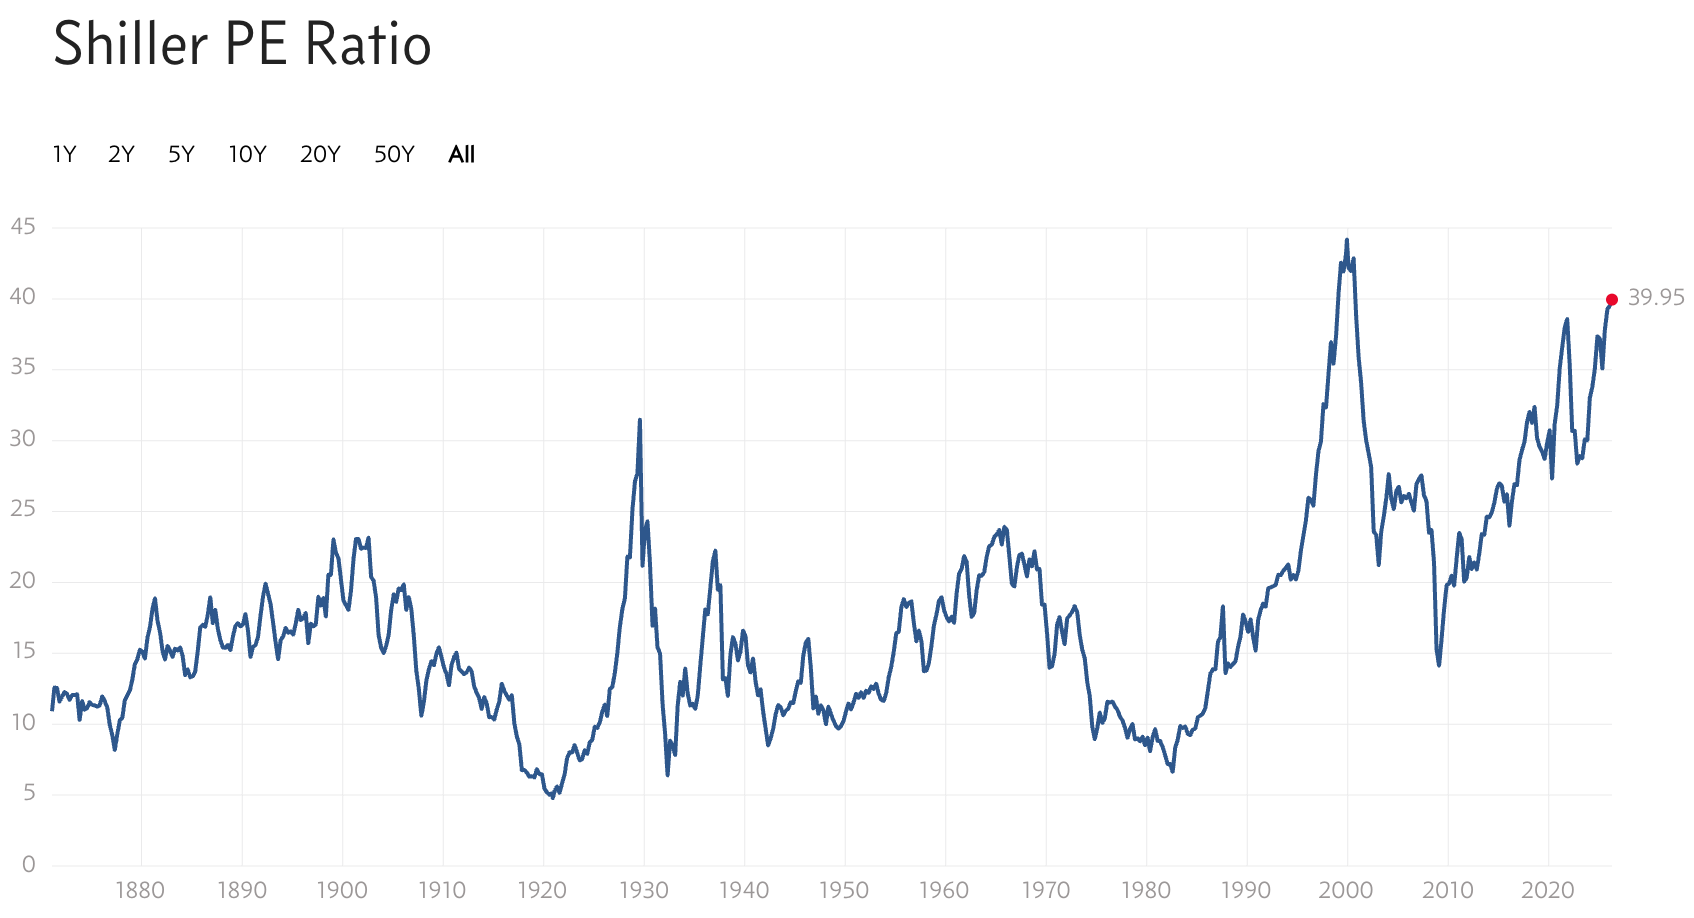
Nobel laureate Robert Shiller constructed it by averaging a decade of inflation-adjusted corporate earnings, smoothing out the noise of any single boom or recession to reveal the true cost of owning American equities relative to the wealth they actually generate.
The historical average since 1871 sits around 17. A reading above 25 signals overvaluation. Above 30, you are in territory that has historically preceded significant pain. Above 35, you are in the kind of thin air where only three expeditions have ever ventured — and all three ended badly on the descent.
The Shiller CAPE closed April 2026 at roughly 40. The second highest reading in 154 years of continuous data.
The first time the gauge approached these levels was September 1929. The S&P 500 subsequently fell 89% over 33 months, triggering an economic catastrophe that rewired an entire civilization’s relationship with debt, savings, and institutional trust.
The second time was December 1999, when CAPE peaked at 44.2. The Nasdaq fell 78%. The average stock fell further. Recovery took thirteen years.
The third time was January 2022, at 40.8, before a 25% correction that was arrested only by the most aggressive pivot in Federal Reserve communication history and the sudden ignition of the AI narrative.
We are now, again, at 40.
What CAPE predicts at these levels is not a crash date — that is a demand it cannot meet. What it predicts, with reasonable historical consistency, is the outcome over the next decade.
The price paid today determines the return earned tomorrow, and the price being paid today is extraordinary expensive. Academic research on forward returns from elevated CAPE readings points to near-zero or negative real returns over ten-year horizons from valuations like today’s.
The uncomfortable addendum is that CAPE can stay elevated for years before the reckoning arrives. The 1999 peak came three full years after CAPE had already crossed 30.
Markets rallied another 40% after entering what any reasonable observer would have called bubble territory. This is why the response to extreme valuations cannot be binary. It cannot be sell everything or ignore it entirely.
It requires the kind of probabilistic portfolio architecture that the greatest investors in history have spent decades building — and which they are now deploying, quietly and without ceremony, in real time.
There is a hierarchy of signals in financial markets. What analysts say is noise. What commentators predict is entertainment. What the greatest capital allocators in history do with their own money is something worth paying close attention to.
Warren Buffett
Has compounded wealth through 1987, 2000, 2008, and every smaller crisis between — is sitting on $348 billion in cash at Berkshire Hathaway. That figure represents roughly 31% of Berkshire’s total portfolio, the highest cash allocation in the company’s modern history. Eighteen months ago, the number was $167 billion. He has more than doubled his cash position by selling equities aggressively throughout 2024 and 2025, including dramatic reductions in his largest holding, Apple. The man who built his reputation on being greedy when others are fearful is choosing to earn 4-5% on Treasury bills rather than deploy capital into equities at a Shiller CAPE of 40. He is doing precisely what he did in 1999, when he was ridiculed for missing the internet boom. By 2002, he was deploying that cash into bombed-out assets at twenty cents on the dollar. He is doing it again.
Stanley Druckenmiller
Rans Duquesne Capital for over thirty years without a single negative year. In the third quarter of 2025 alone, he established 29 new positions and liquidated 33 existing ones — one of the most aggressive portfolio reshuffles of his career. The new holdings are concentrated in defensive healthcare names: genetic testing companies, rare disease pharmaceuticals, generic drug manufacturers, semiconductors and industrials. These are not the stocks of someone who expects the AI rally to continue indefinitely. These are the stocks of someone rotating toward sectors that historically hold value when growth falters and recessions bite — someone positioning a chess board several moves ahead of where the crowd is looking.
Ray Dalio
Built Bridgewater Associates into the world’s largest hedge fund by studying 500 years of economic cycles, stated publicly in October 2025 that his proprietary bubble indicator is running at historically elevated levels, comparing current conditions explicitly to 1998-1999 and 1927-1928. He reduced his NVIDIA position by 65%, Alphabet by 52%, Meta by 48%. He increased gold exposure and flagged what he calls a two-part economy — a bubble inflating in financial assets while most of the real economy weakens — as precisely the condition in which monetary policy cannot thread the needle. Rate cuts intended to rescue the economy inflate the bubble further. Rate hikes to deflate the bubble strangle the economy. The Federal Reserve is caught between two patients with incompatible prescriptions.
David Tepper,
Known for buying when there is blood in the streets, is a contrarian with China exposure — a signal that the macro environment is sufficiently threatening to make even distressed value unattractive.
Collectively, these four men represent over two centuries of investing experience, hundreds of billions in managed assets, and track records that have survived every major financial catastrophe of the last fifty years. When they align on caution simultaneously, the rational response is not to hunt for reasons they might be wrong. It is to understand why they might be right.
Join 22,000+ Investors Using the 80/20 Rule to Build Smarter, Higher-Returning Portfolios
The Pareto Investor delivers a proven, systematic framework to apply the 80/20 rule to stocks — focusing only on the tiny fraction of companies that drive nearly all market gains.
Membership Tiers for 2026:
Premium — Everything you need to outperform the market with less effort:
Full access to all live Pareto portfolios (Growth, Dividend, Permanent & Momentum)
Quarterly portfolio updates with exact stock selections
Rebalancing alerts & detailed annual review framework (including replacement rules)
Exclusive investment insights & advanced portfolio optimizations
Elite — Everything in Premium, plus permanent ownership of the most powerful tools:
Pareto Elite Sheet — fully automated annual rebalancing, real-time portfolio dashboard, and live tracking
50+ years of historical stock data
Pareto Watchlist
Pareto Stock Screeners
Only 4% of stocks account for nearly all net wealth creation in the market. Why settle for mediocre index returns held back by thousands of underperformers? Join 25K+ investors focusing only on the rare winners — and upgrade your returns with the Pareto Principle today.
Intellectual honesty demands that the bull case be given its full weight, not as a concession but as a genuine reckoning with the data.
The most important difference between 2025 and 2000 is not narrative — it is the income statement. The leading companies of the dot-com era were burning cash on the theory that market share today would translate into profit tomorrow.
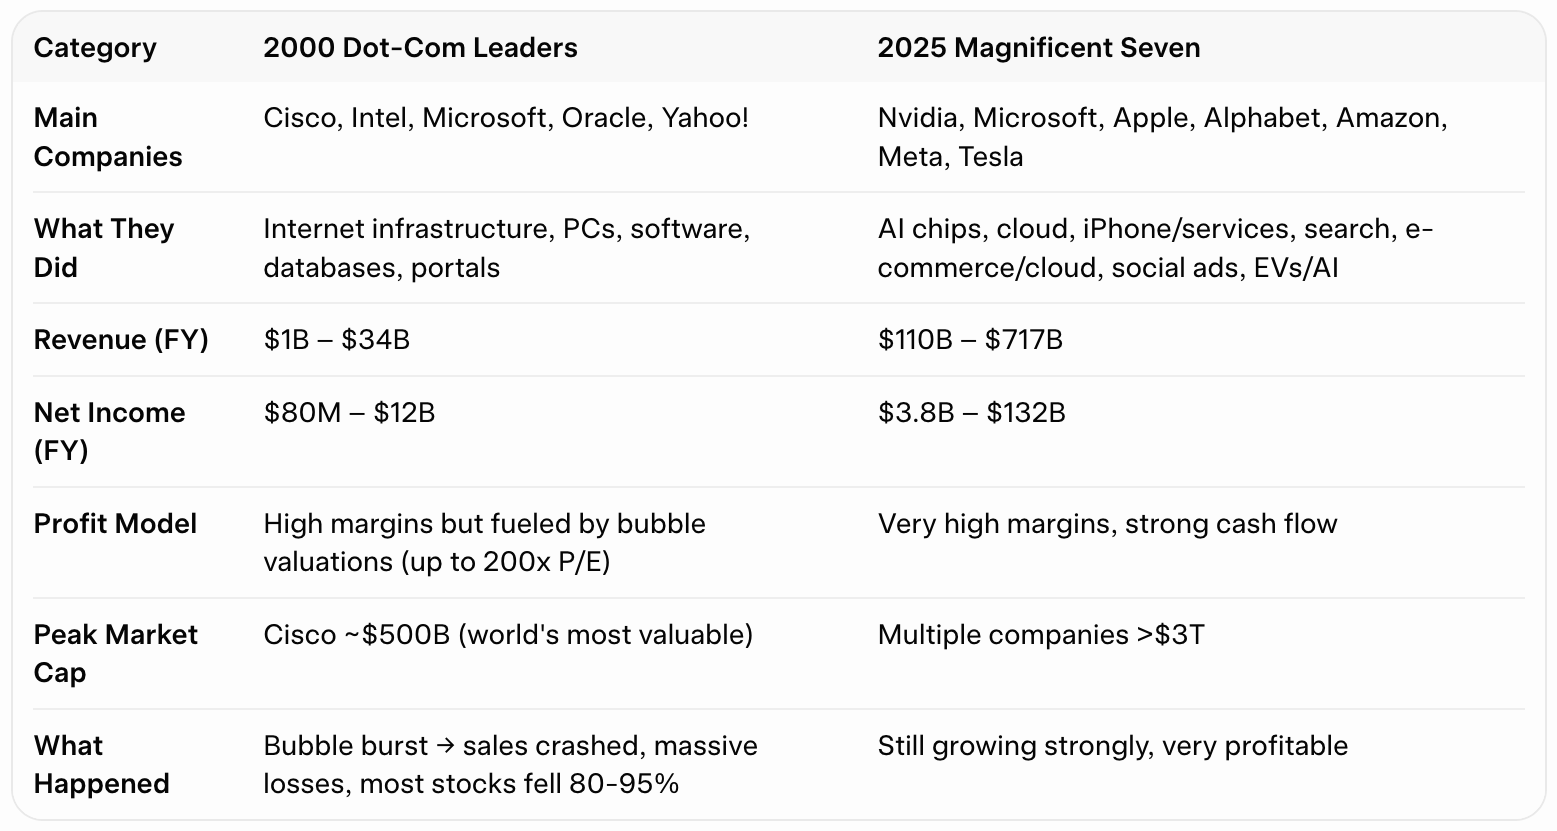
Pets.com, Webvan, Kozmo.com — these were billion-dollar companies with zero revenue and business models built on the assumption that the laws of economics had been temporarily suspended.
The Magnificent Seven generate, in aggregate, hundreds of billions of dollars in annual net income. Microsoft earns over $90 billion a year. Apple clears $100 billion. NVIDIA’s net income has grown from $5 billion in 2020 to over $60 billion in 2025.
They are cash-generating machines with fortress balance sheets. The moats are real. The competitive advantages that justify premium valuations in high-quality businesses are not theoretical.
Microsoft’s enterprise software lock-in,
NVIDIA’s CUDA software ecosystem dominating 90% data center GPU compute,
Alphabet’s search monopoly,
Meta’s social graph connecting three billion people — these are not features a startup can replicate with a weekend hackathon and a term sheet.
They represent decades of infrastructure, network effects, and regulatory incumbency that create genuine barriers to competition.
And AI, unlike the internet promises of 1999, is delivering measurable productivity gains today.
Code generation tools are improving developer output by documented margins.
Drug discovery timelines are compressing.
Customer service automation is removing billions in labor costs from corporate balance sheets.
The technology is not a promissory note dated ten years in the future. It is working now, and the companies selling the infrastructure to power it are experiencing real, accelerating demand.
The optimist’s case is coherent. AI is a general-purpose technology with the transformative potential of electricity.
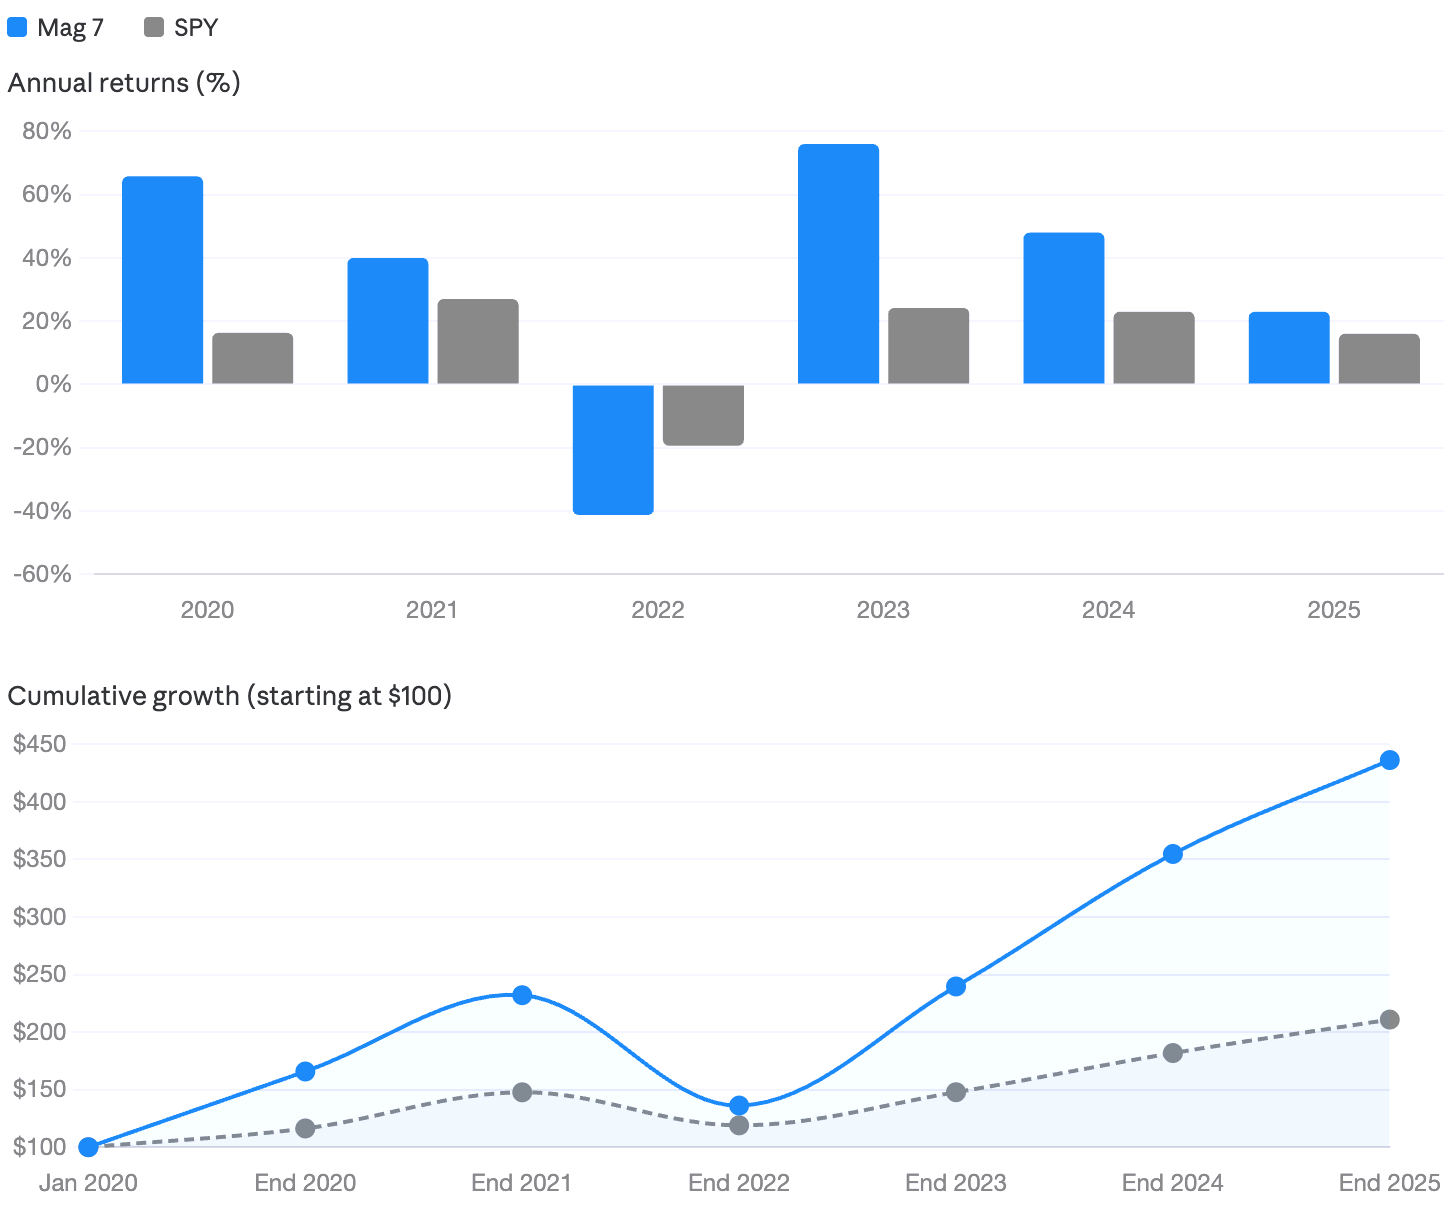
The companies leading it are genuinely exceptional businesses.
History will likely record this era as one of the great technological inflections in human civilization.
Every bubble in history has had a thesis that was directionally correct. That is what makes bubbles possible. If the underlying story were false, skepticism would arrive early and the excess would be contained.
The danger is when the story is true but the price paid to own it exceeds what any realistic future can justify.
Irving Fisher, Yale’s most eminent economist, declared in October 1929 that stock prices had reached “a permanently high plateau.” He was not a fool. The American economy had genuinely transformed in the preceding decade — electrification, automobile adoption, mass production, the emergence of consumer credit. The transformation was real. The plateau was not.
In 1999, the internet was not a hallucination. It was the most significant communications infrastructure since the printing press. The companies it would eventually mint — Amazon, Google, Facebook — would become the defining businesses of the next quarter century.
But buying Amazon in March 2000 at its peak valuation meant waiting until 2009 before you broke even, despite Amazon growing into one of the most valuable enterprises in history. The technology succeeded. The price destroyed you anyway.
The Cisco case is the most instructive parallel to today. Cisco was profitable in 2000. It had real revenue from real networking hardware that genuinely powered the internet. Its competitive position was dominant. Its growth was organic. It traded at 150 times earnings. The business continued growing for the next twenty-five years.
The stock FINALLY recovered from the 2000 dot-com stock crash 25 years later..
Today NVIDIA trades at roughly 50 times forward earnings. Microsoft at 35. Amazon at 40. These are not Pets.com multiples — they are not speculative. But they assume decades of flawless execution, no meaningful competitive disruption, no regulatory intervention, no technological displacement. They are the multiples of perfection. And perfection, in the long arc of business history, is the rarest commodity of all.
The current AI monetization narrative also deserves scrutiny.
Hyperscalers are spending $200 billion annually on AI infrastructure. The demand from enterprises is real. But how many of those enterprises have achieved measurable, documented return on their AI investment beyond internal code tools and chatbots?
The fiber optic buildout of the late 1990s was driven by equally genuine demand projections — and the companies that built the infrastructure went bankrupt before demand arrived to save them. The builders of infrastructure rarely capture the value.
The users do. This cycle will be no different.
The point is not that AI will fail. It is that even transformative technologies can create valuation bubbles that destroy capital for a decade. The internet did not fail. It conquered the world. It just could not save the people who paid 2000 prices for it.
The mistake most investors will make is binary. They will either dismiss the parallel entirely — telling themselves that CAPE is a blunt instrument and AI changes everything — or they will overcorrect, selling everything and spending the next two years watching the market rally another 30% before the correction arrives.
Both responses ignore the actual methodology of the investors they claim to admire.
Buffett is not in 100% cash. Druckenmiller is not short the market. Dalio is not predicting the exact date of collapse. They are repositioning for asymmetric risk/reward — building portfolios that participate sufficiently if the rally continues while surviving intact if the repricing arrives.
The goal is not to maximize returns in one scenario. It is to perform acceptably across all probable scenarios and emerge with capital to deploy when others are being forced to sell.
The practical architecture of this approach begins with reducing concentration without abandoning equities entirely.
Gold & precious metals serve as genuine bubble insurance rather than mere inflation protection: when monetary policy is trapped between incompatible demands and legendary investors are warning of structural instability, the monetary metal has historically absorbed the flight from financial assets.
Defensive sectors — healthcare, utilities, consumer staples — provide the equity exposure that held value in 2000-2002 when growth collapsed but earnings-based businesses with pricing power continued compounding.
Cash is not dead weight. At 4-5% risk-free, it is both income and optionality — the dry powder that allows you to buy generational opportunities after the correction rather than being trapped in declining positions.
The three scenarios that define the range of outcomes are not equally likely but all require genuine preparation.
The final manic blow-off top — CAPE reaching 50, the market rallying another 30-40% on AI euphoria before a violent peak — is possible but historically improbable at current readings.
The slow grinding distribution, where marginal new highs give way to decelerating earnings, deteriorating breadth, and an 18-month correction of 25-40%, is the most historically consistent outcome and the scenario that Dalio’s two-part economy warning describes precisely.
The sudden shock — a geopolitical event, a credit cascade, a margin call spiral in a market carrying $1.2 trillion in debt — is the tail risk that gold and cash exist to absorb.
A portfolio designed to perform acceptably across all three does not need to predict which one arrives. It needs to survive the worst while participating in the best.
There is a choice available to every investor right now, and it is the same choice that was available in late 1999. It is not a choice between being right and being wrong.
It is a choice between two different definitions of prudence.
One definition says that prudence means staying fully invested because markets always recover, because you cannot time tops, because AI is genuinely transformative and the companies are genuinely profitable. This definition is not dishonest. It is simply incomplete. It is the definition that felt correct in early 1999 and proved catastrophic by late 2002.
The other definition says that prudence means reading the deep signals — a Shiller CAPE that has only been exceeded twice in 154 years, market concentration at all-time records, every legendary investor simultaneously raising cash and rotating defensive — and adjusting your portfolio accordingly. Not abandoning it. Not timing it. Adjusting it. Tilting it toward survival and away from maximum exposure to the very assets that are most overvalued. Giving yourself the capital and the positioning to emerge from whatever comes next with the ability to act rather than the obligation to recover.
Buffett has built the greatest investment record in modern history. Druckenmiller has not had a down year in thirty. Dalio has studied 500 years of economic cycles. PTJ called the 1987 crash. Collectively they represent something that no single narrative, however compelling, can override: accumulated wisdom tested against every market environment in living memory.
They are not panicking. They are preparing.
, red (+2 standard deviations), green (-1 standard deviation), and dark green (-2 standard deviations). A highlighted annotation box points to the December 31, 2025 value: "230% ratio of Market Value to GDP, 75% higher than long-term trend line." The chart indicates current valuations are significantly elevated compared to historical norms.")
The question is not whether you believe in AI. The question is whether you believe in paying any price for anything — and whether you understand that the greatest businesses in history have always been capable of being turned into terrible investments by people who paid too much.
The chart from 1999 is haunting because it tells the truth: even when the technology is real, even when the companies are real, even when the transformation is real — valuation always has the last word.
Sincerely,
The Pareto Investor
Want to see my latest portfolios move? I regularly publish detailed portfolio updates and market analysis — showing how I apply the 80/20 rule to real capital.
Is this just another doom-and-gloom crash call?
No. This isn’t a countdown-to-crash prediction. It is a probabilistic framework for investing when valuations, CAPE, and market concentration all sit at levels that have historically led to weak decade‑long returns, even if prices keep rising in the short term. The goal is not to be “right about the top,” but to avoid being wrong in a way that takes ten years to recover from.
If AI is real, why not stay all‑in on the winners?
AI is real, and the leading companies are extraordinarily profitable — that’s exactly what makes this environment dangerous at current prices. Cisco was real in 2000, too; it took roughly 25 years for investors who bought at peak valuation to break even because they paid perfection multiples for a great business. The playbook here is to respect the technology while refusing to pay any price for it.
So what are the best investors in the world actually doing?
They are not YOLO shorting the market, and they are not 100% in AI momentum stocks. Buffett is sitting on record cash, Druckenmiller has rotated heavily into defensive and industrial names, Dalio has been reducing high‑flyer exposure while adding gold, and Tepper is unusually cautious. When investors with multi‑decade, crisis‑tested track records all tilt defensive at the same time, that is a signal, not a headline.
Isn’t cash trash if markets keep going up?
At 4–5% in T‑bills, cash is both income and optionality. It lets you participate enough in upside through a more balanced portfolio, while keeping dry powder for the moment great assets go on sale in a real drawdown. In 1999–2002, the investors who had cash and patience, not bravado, were the ones buying world‑class companies for cents on the dollar.
How is your approach different from just holding index funds forever?
Owning the index at any price works over 50–70 years if you can emotionally and financially stomach decade‑long periods of flat or negative real returns. My framework is built around the 80/20 rule: concentrate on the small minority of stocks and sectors that actually create net wealth, while cutting exposure to the thousands of passengers that drag long‑term returns down — especially at bubble‑level valuations.
What does ‘crisis‑ready’ actually look like in a portfolio?
It means you do not bet on a single macro outcome. A crisis‑ready portfolio holds:
Gold and precious metals as insurance against monetary and market instability
Defensive sectors like healthcare, utilities, and staples that historically hold up when growth names crack
Quality growth and AI beneficiaries sized realistically, not heroically
A deliberate cash buffer earning real yield and waiting for dislocation
You still participate if markets melt up, but you can also survive — and act aggressively — if they don’t.
What exactly do I get as a Pareto subscriber in this environment?
You get concrete implementation, not just macro essays.
Live model portfolios (Growth, Dividend, Permanent, Momentum) with exact holdings and weights
Rebalancing alerts with clear replacement rules, so you are not guessing when to move
A fully automated Elite Sheet with 50+ years of data, live tracking, and watchlists that surface the tiny fraction of stocks actually worth your time
In other words, you get a complete, rules‑based process to navigate a 1999‑style environment without needing to become a full‑time macro strategist yourself.
What if the bubble never pops and I miss out?
That fear is precisely what keeps bubbles inflating. The point of a probabilistic, 80/20 portfolio is that you do not need to call the exact top; you only need to avoid the combination of maximum exposure at maximum valuation. If AI delivers everything the optimists hope for, a disciplined framework still leaves you with meaningful upside — just without betting your entire future on perfection.
Comments
Nothing yet. Say the first thing.
Sign in to join the conversation.