
The Mobility Dashboard provides a weekly snapshot of travel conditions across the city on weekdays, including traffic trends, transit performance, Park & Ride availability, construction impacts and trip-planning resources. Whether you're travelling downtown, across Ottawa or connecting to transit, this information can help you make informed decisions about how and when you travel.
The dashboard is updated weekly to help residents stay informed and navigate Ottawa's transportation network with confidence.
About the travel conditions information
The travel conditions information presented in this dashboard is intended to show general weekday travel trends across Ottawa. The information is based on observed travel data collected during the previous reporting week and reflects conditions from selected locations that are representative of travel demand throughout the City. The locations included represent a sample of travel patterns across Ottawa and are not intended to cover every neighbourhood, destination or route option. Colour-coded indicators are intended to provide a high-level view of relative travel conditions and congestion levels and should not be interpreted as exact travel times or real-time conditions. This dashboard is not a navigation tool and should not be used as a substitute for real-time route guidance provided by trip-planning applications (such as Google Maps, Waze, etc.).
Last week at a glance:
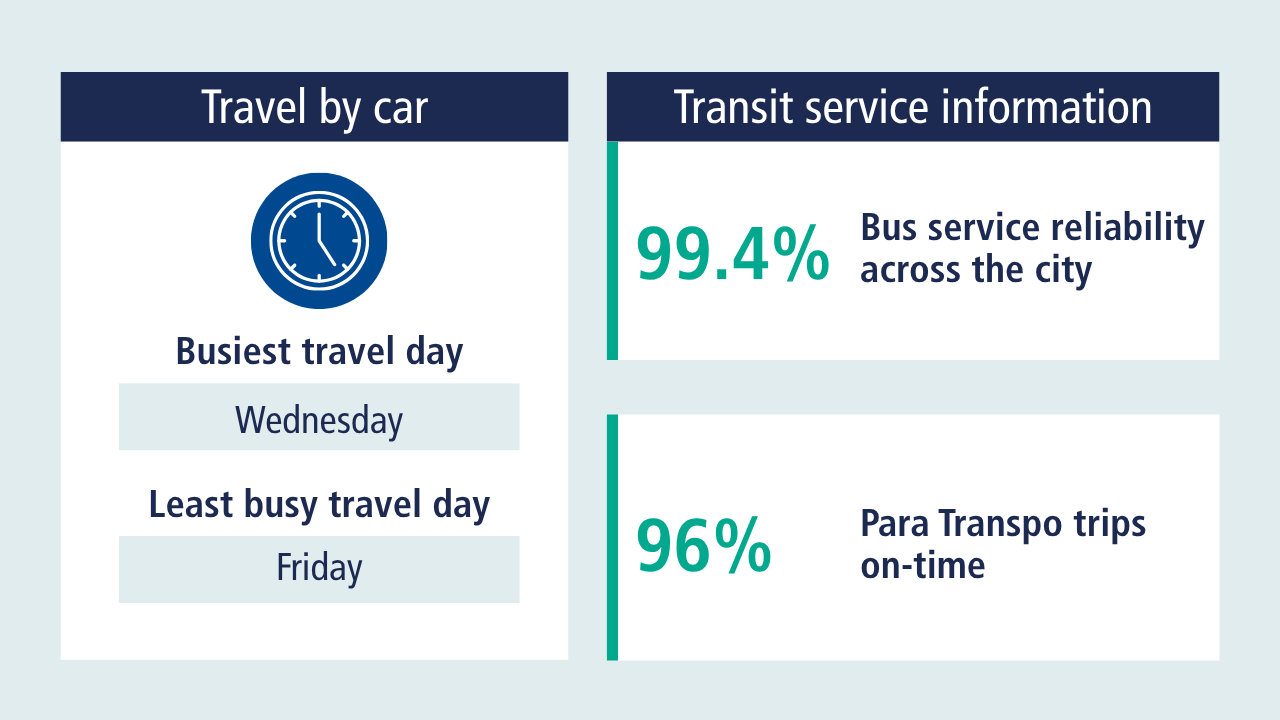
Note: Travel condition indicators are based on observed weekday travel data from the previous reporting week and are intended to show broad travel trends. Actual conditions may vary depending on your route, destination, time of travel and day-to-day events.
The Mobility Dashboard provides a weekly snapshot of travel conditions across the city on weekdays, including traffic trends, transit performance, Park & Ride availability, construction impacts and trip-planning resources. Whether you're travelling downtown, across Ottawa or connecting to transit, this information can help you make informed decisions about how and when you travel.
The dashboard is updated weekly to help residents stay informed and navigate Ottawa's transportation network with confidence.
About the travel conditions information
The travel conditions information presented in this dashboard is intended to show general weekday travel trends across Ottawa. The information is based on observed travel data collected during the previous reporting week and reflects conditions from selected locations that are representative of travel demand throughout the City. The locations included represent a sample of travel patterns across Ottawa and are not intended to cover every neighbourhood, destination or route option. Colour-coded indicators are intended to provide a high-level view of relative travel conditions and congestion levels and should not be interpreted as exact travel times or real-time conditions. This dashboard is not a navigation tool and should not be used as a substitute for real-time route guidance provided by trip-planning applications (such as Google Maps, Waze, etc.).
Last week at a glance:
Note: Travel condition indicators are based on observed weekday travel data from the previous reporting week and are intended to show broad travel trends. Actual conditions may vary depending on your route, destination, time of travel and day-to-day events.
-
Central (Carlingwood, Algonquin College, South Keys Mall, Alta Vista and Beacon Hill)
Peak Period Travel Conditions to/from Downtown
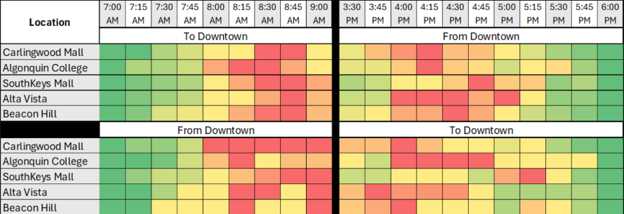
Note: The colours show how travel conditions vary throughout the morning and afternoon peak periods on each route with green being lightest to red being heaviest traffic. Accessible format of this graphic.
Park & Ride status
Location Spaces available Average weekday usage Approximate travel time to downtown during peak Greenboro Park and Ride 575 48% 33 minutes Peak Period Travel Conditions to/from Downtown
Note: The colours show how travel conditions vary throughout the morning and afternoon peak periods on each route with green being lightest to red being heaviest traffic. Accessible format of this graphic.
Park & Ride status
Location Spaces available Average weekday usage Approximate travel time to downtown during peak Greenboro Park and Ride 575 48% 33 minutes -
West Ottawa (Kanata, Stittsville, Carp and Richmond)
Peak Period Travel Conditions to/from Downtown
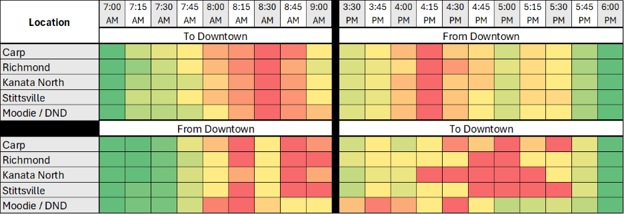
Note: The colours show how travel conditions vary throughout the morning and afternoon peak periods on each route with green being lightest to red being heaviest traffic. Accessible format of this graphic.
Park & Ride service and status
Location
Spaces available
Average weekday usage
Approximate travel time to downtown during peak
Eagleson
1,220
45%
53 minutes
Terry Fox
538
9%
1 hour and 10 minutes
Innovation
254
8%
1 hour and 5 minutes
Peak Period Travel Conditions to/from Downtown
Note: The colours show how travel conditions vary throughout the morning and afternoon peak periods on each route with green being lightest to red being heaviest traffic. Accessible format of this graphic.
Park & Ride service and status
Location
Spaces available
Average weekday usage
Approximate travel time to downtown during peak
Eagleson
1,220
45%
53 minutes
Terry Fox
538
9%
1 hour and 10 minutes
Innovation
254
8%
1 hour and 5 minutes
-
East Ottawa (Orléans South, Orléans North, Navan and Cumberland)
Peak Period Travel Conditions to/from Downtown
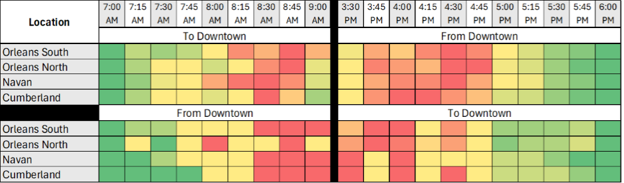 Note: The colours show how travel conditions vary throughout the morning and afternoon peak periods on each route with green being lightest to red being heaviest traffic. Accessible format of this graphic.
 Park & Ride service and status
Location
Spaces available
Average weekday usage
Approximate travel time to downtown during peak
Trim
271
30%
45 minutes
Place d'Orléans
517
57%
35 minutes
Peak Period Travel Conditions to/from Downtown
Note: The colours show how travel conditions vary throughout the morning and afternoon peak periods on each route with green being lightest to red being heaviest traffic. Accessible format of this graphic. Park & Ride service and status
Location
Spaces available
Average weekday usage
Approximate travel time to downtown during peak
Trim
271
30%
45 minutes
Place d'Orléans
517
57%
35 minutes
-
South Ottawa (Barrhaven, Findlay Creek, and Greely)
Peak Period Travel Conditions to/from Downtown
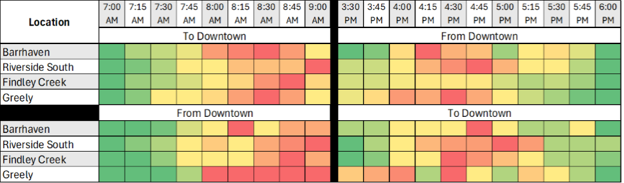 Note: The colours show how travel conditions vary throughout the morning and afternoon peak periods on each route with green being lightest to red being heaviest traffic. Accessible format of this graphic.
 Park & Ride service and status
Location
Spaces available
Average weekday usage
Approximate travel time to downtown during peak
Bowesville
823
63%
44 minutes
Leitrim
315
29%
40 minutes
Greenboro
576
48%
33 minutes
Fallowfield
1,709
19%
58 minutes
Strandherd
408
12%
1 hour
Nepean Woods
287
4%
1 hour Continue reading
Peak Period Travel Conditions to/from Downtown
Note: The colours show how travel conditions vary throughout the morning and afternoon peak periods on each route with green being lightest to red being heaviest traffic. Accessible format of this graphic. Park & Ride service and status
Location
Spaces available
Average weekday usage
Approximate travel time to downtown during peak
Bowesville
823
63%
44 minutes
Leitrim
315
29%
40 minutes
Greenboro
576
48%
33 minutes
Fallowfield
1,709
19%
58 minutes
Strandherd
408
12%
1 hour
Nepean Woods
287
4%
1 hour
Page last updated: 24 Aug 2026, 03:09 PM
Comments
Nothing yet. Say the first thing.
Sign in to join the conversation.