
Bitcoin is up 8% on the month. We’re in a countertrend rally. Ben Cowen notes that during a bear market, bitcoin spends most of its time going up or sideways, and the downside is contained in short bursts. I’ve written that I expect a Q4, likely October, market cycle low for bitcoin. So I’m looking for a local top and then I will set a new wave of short positions. This article describes my local top catching logic, timing, and price target(s), found through backtesting prior midterm years.
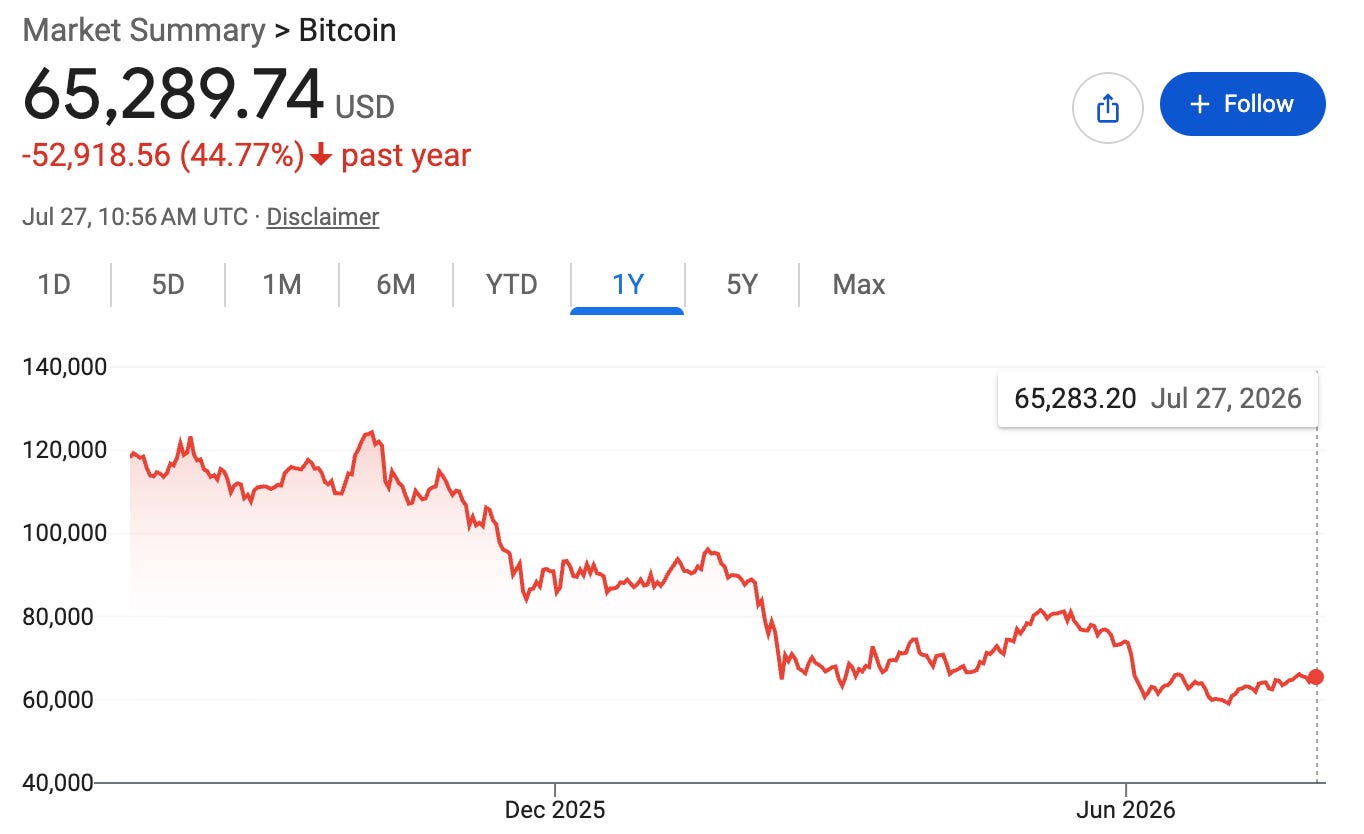
Notice the bear flag pattern. We are in the third or fourth, depending on whether you count the all time high as a flag. Notice the pattern is a prolonged slight up trend, then a pop and crash. Our local flag has yet to have the pop, so I’m still expecting continued upside for between a week and a month as my prior before I backtest.
With backtests, I can be more precise. We are in a midterm year. 2022, 2018, and 2014 are the other midterms I consider historically. 2013 was the first time bitcoin crashed with support above $100 so I don’t want to go to prior years for comparability of scale and statistical reliability of analysis. 2022 was COVID, so I take it as an edge case, but one worth checking even so. Trump was President in 2018, and it is nearest in time, and we know the broader bitcoin behavior has time effects such as less volatility and growth rate over time. So I take 2018 as most comparable and in a pinch I’ll prefer a rule that meets 2014 and 2018 over all three years, but ideally we fit all available comparable data.
I won’t talk through all the specific tests I did (over 40 micro-studies!) but I’ll summarize the results for you. The result is that a 100 daily SMA is tagged in every case and a 125 SMA is tagged in 2014 and 2018. The 2200 hourly SMA is also tagged in every regime and it is tagged even more often with more shots on goal as an hourly SMA. This is useful if you are currently in cash but you’d like to find an entrypoint into the short in August or even September. The 2200 hourly approach gives up ~5% return for many more opportunities to get in.
Better yet: You don’t need to choose whether you think this market is COVID-like. I’m heavily inclined against that idea, but I don’t have to choose. I found a two-layer strategy with 100 daily SMA fallback was optimal among approaches that I tried. After crossing above the 100 daily SMA, a 5% exhaustion detection strategy enabled me to capture an even higher entry price, which is good for a short. The exhaustion detection strategy is simply to place a line as a % of the running high, and a parameter sweep from 3% to 8% at 0.5% granularity found that a 5% exhaustion rule performed best across regimes.
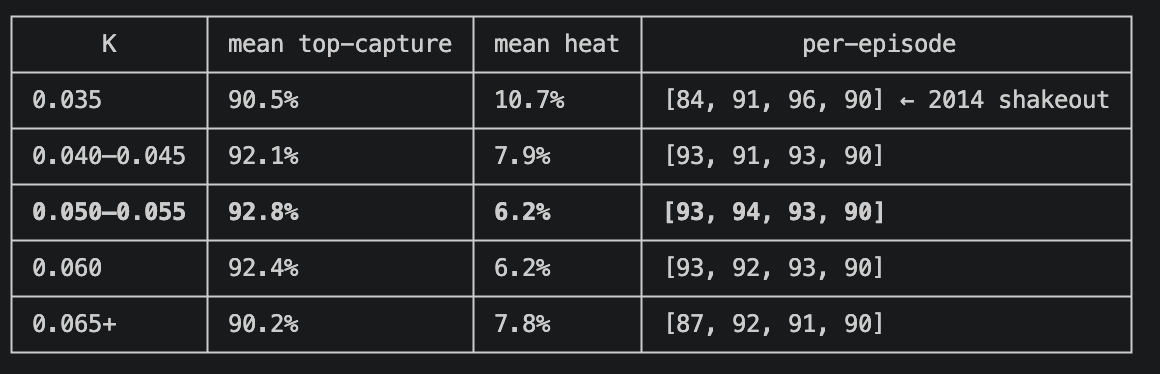
The 100 SMA is currently at $69,551 on Coinbase and slowly declining, so I’d translate it to roughly a $69k price target. Kalshi gives a 40% chance that bitcoin goes over $67.5k in July, so the price target is likely to hit in August. This is great because I’ll be able to leverage new August-specific betting market data as a fantastic independent supplement to my backtests.
A 5% exhaustion rule takes effect when the price exceeds 69k by 5%, so I’m effectively predicting a high likelihood of bitcoin going over $72.4 in August. Notably, when this wire trips, my backtests show that going 80/20 on bitcoin and ethereum short futures is an optimal strategy compared to bitcoin-only shorts or SBIT+ETHD as ethereum volatility makes ETHD daily resets expensive. In backtests, a futures-oriented strategy was not margin called at even 5x leverage, but drawdown was over 50% in the worst case, it wasn’t calmar-optimal, and I don’t want to overly trust backtests. Calmar optima was around 1.5-2x leverage.
Comment if you’d like this data. I built a backtesting and automated investing platform for myself over the past 1-2 months and I’m considering making it available as a service, or perhaps just the research portion available for purchase. The automated trading is valuable to me so that I can place trades associated with my backtests without having to continuously watch the market.
Because I see a very high likelihood of a bitcoin price over 69k in August and a good chance it goes over $72k, I’m not actually in a hurry to activate this strategy that I’ve described, although it was very useful to me because it has motivated me to keep waiting while I itch to get into the trade. Practically, I plan to keep an eye on the markets and yes if we break 69k I may get nervous and activate the strategy, but if I can afford to wait until the end of the first week of August I will do so as this is highly de-risking. We will get access to the betting market data for August and learn more about the war.
If I can identify the August high with more confidence than the 5% exhaustion rule, I can potentially set my shorts from an even higher entry, which would be fantastic and worth the wait. I would prefer the markets if they claim 80%+ confidence with high participation. In the 70s I’d consider it about equal evidence to my backtests, and I wouldn’t be motivated to listen to claims the betting markets make in the first week under 60% confidence.
The additional time between now, the start of August, and ideally the end of the first week of August will allow me to further study options strategies. I compared spot, leveraged ETF, and futures strategies, but I haven’t fully analyzed options, and the more time we burn the more potentially valuable options become because I have a high-conviction Q4 bottom expectation, so burning time enables me to buy shorter duration options which improves effective leverage in theory. I’m particularly curious about a weekly options cost averaging approach where I might have some money in ETFs or futures and gradually roll them into options as October approaches.
No posts
Comments
Nothing yet. Say the first thing.
Sign in to join the conversation.