
Vietnam is close to posting a larger trade deficit with the United States than Mexico or Canada. That single fact should reframe how Washington talks about trade imbalances and who it targets.
The geography of U.S. trade deficits looks very different today than it did before the start of the U.S.-China trade war in 2018. While the deficit with China has fallen sharply, several Asian manufacturing hubs have expanded their deficits at a pace that should raise far more concern than the North American numbers dominating today's headlines (See Chart 1). Although the stated objective of the Trump administration is to reduce the U.S. trade deficit through tariffs and other measures, what is happening on the ground is quite the opposite. The overall deficit rose 2 percent in 2025 and supply chains have reallocated accordingly.
Chart 1
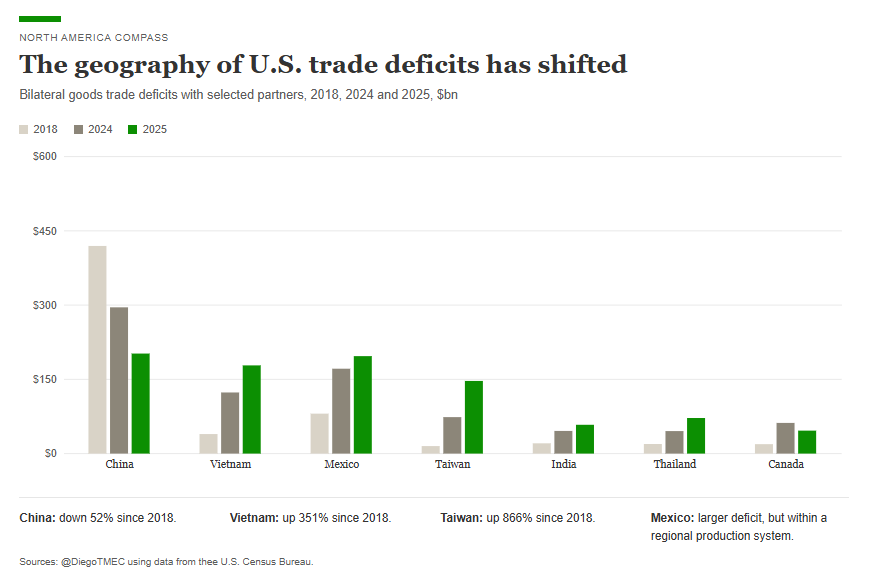
Chart 2
Takeaway 1: Tariffs did not close the deficit. They redirected it.
Since 2018, the U.S. trade deficit with China has fallen 52 percent, from $419.5 billion to $202.1 billion in 2025. That looks like progress. It is not. The deficit relocated to other Asian manufacturing hubs. Over the same period, the deficit with Taiwan increased 866 percent, from $15.2 billion to $146.8 billion, rising another 99 percent in 2025 alone. The deficit with Vietnam rose 351 percent, from $39.5 billion to $178.2 billion. The deficit with Thailand increased 270 percent, from $19.4 billion to $71.9 billion. India, often discussed as a beneficiary of supply chain diversification, saw its deficit with the United States grow 179 percent, from $20.8 billion to $58.2 billion.
With 5,000 U.S. manufacturing jobs lost in February year-over-year (Bureau of Labor Statistics), the trade war with China has yet to rebuild U.S. manufacturing. What it did was reshuffle the trade imbalance map.
Takeaway 2: Mexico and Canada are not suppliers. They are partners in production.
Mexico became the United States’ largest trading partner and export market in 2025, closely followed by Canada. Together, they absorbed $674 billion of U.S. goods exports, about a third of all U.S. goods exports and roughly $260 billion more than U.S. exports to the European Union.
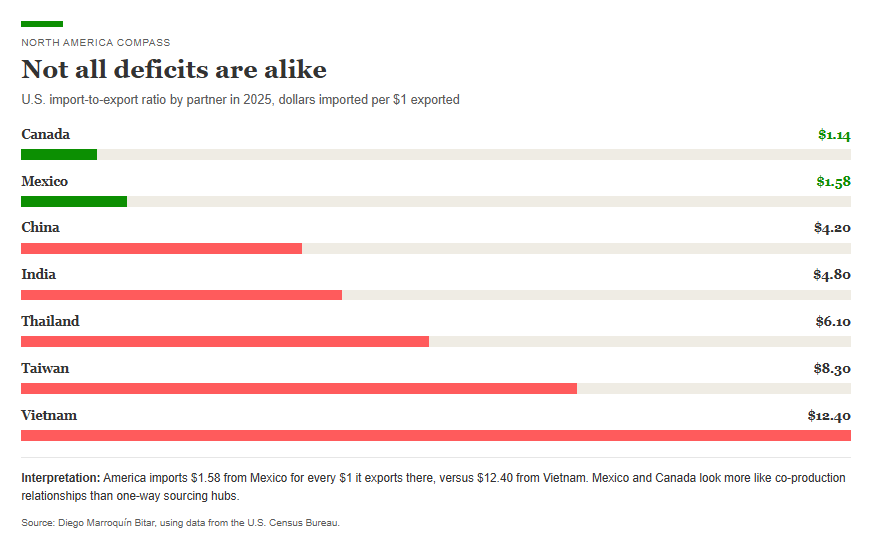
The deficit numbers look large. But size alone does not tell you what kind of trade you are looking at. About 74 cents of every dollar of manufactured goods exported from Mexico to the United States originates within North America, reflecting the large share of U.S. and Canadian inputs embedded in regional production. These are not imports competing with U.S. workers. They are the output of a joint production system built over three decades.
🔒 For paid subscribers: The ratio that changes the argument and what it means for U.S. trade policy
The most important number in this piece is not a deficit figure. It is a ratio. Subscribe to keep reading.
Comments
Nothing yet. Say the first thing.
Sign in to join the conversation.