
Although industrial production accounts for only around 12-15% of total gross domestic product, it is considered an important macroeconomic indicator as it measures output from the manufacturing (~75% of industrial production), mining (~10%), and utility (~15%) industries, and can aid in forecasting structural changes in the economy, business cycle inflection points and inflationary trends. Note industrial production is based on value so prices impact these figures. All figures m/m unless otherwise noted.
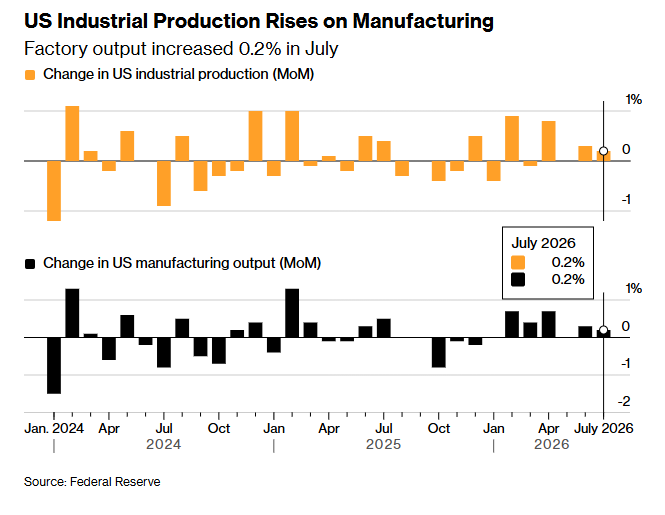
US Industrial Production (M/M) July: 0.2% (est 0.3%; prev 0.1%; prev R 0.3%)
- Manufacturing (SIC) Production: 0.2% (est 0.2%; prev 0.0%; prev R 0.3%)
- Capacity Utilization: 76.3% (est 76.3%; prev 76.1%; prev R 76.2%)
July industrial production (IP) comes in a touch below expectations at +0.20% m/m (vs +0.3% expected), but a second consecutive gain with June revised up to +0.27% (from +0.08%), lifting total IP to its highest since January 2019. The three-month average is +0.15%.
Manufacturing rose +0.16% m/m, its 6th straight monthly gain, as durables rose +0.7% (with most categories expanding more than 1.0 percent) with a -2.1% drop in autos — the most since October — masking the broader strength; excluding autos, manufacturing was +0.4%. Nondurables fell -0.4%.
Business equipment spending rose +0.80%, the 8th consecutive increase, and now up +6.59% y/y, and at the highest levels since December 2018. Spending was fueled by information processing and related equipment +1.53%, the second most since July 2024 (chart) now +8.9% y/y, the most since April 2022. The output of defense and space equipment also increased +1.75%, its eighth straight monthly gain and now at an all-time high.
Y/y total IP is +1.08% and manufacturing +1.15%, both roughly steady versus June but still negative in real terms, with neither sustainably above 2% since 2022.
Comments
Nothing yet. Say the first thing.
Sign in to join the conversation.