
I pulled a fresh backtest this week, and I wanted to walk you through it properly instead of just dropping a screenshot into a note.
The last time I did this deep dive was back in May. A lot has happened since then, the Iran ceasefire, the June chip crash, the Alphabet and Tesla selloff, July’s brutal semiconductor rout, and now this week’s sharp rally. I figured it was worth checking whether the long-term numbers still hold up after living through all of that in real time, and honestly, seeing 2026 actually show up in the data made this feel a lot more real than the last version did.
Have a look at the trades from the backtest in the excel file:
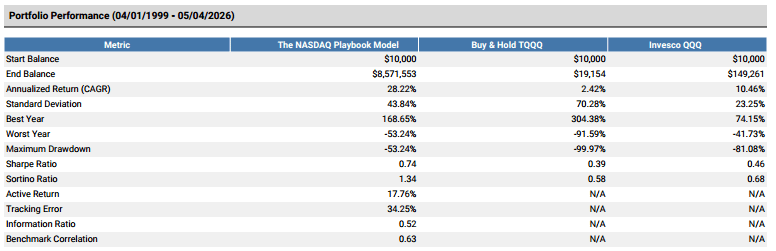
$10,000 invested in 1999, following Module 1’s rules, is now worth $9,943,586.
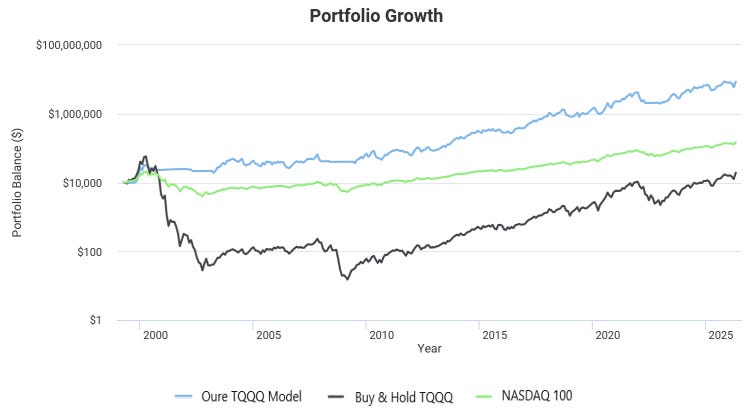
Back in May that number was $8.57 million. It’s added almost $1.4 million since then, in three months, despite everything that’s happened this year. Annualized return sits at 28.63% CAGR, up slightly from 28.22% last time I checked.
For comparison, the same $10,000 in Buy and Hold TQQQ is worth $22,220. QQQ itself turned it into $159,290. Module 1 is still producing roughly 62 times what plain QQQ did over the same stretch, and roughly 447 times what holding TQQQ with no rules produced.
One reminder, same as always: this is Module 1 in isolation, the trend engine carrying 50% weight in our overall system. Modules 2 and 3 run on different logic and aren’t reflected in these numbers.
This is the part I actually found most interesting, because I lived through this year, and now I get to see it as a single row in a spreadsheet.
January: +2.68%. A calm start, before anyone knew what was coming. February: -7.79%. The Iran war correction beginning to bite. March: -21.51%. The worst of it, this is the month with the two stop losses I’ve written about extensively, Module 2 and Module 3 both getting cut in the correction. April: +41.94%. The re-entry and the recovery, still the second-best single month in the entire 27-year dataset. May: +32.08%. The continuation, full deployment, all-time highs. June: -2.47%. Roughly flat on paper, though anyone who read the weekly updates knows it didn’t feel flat, that was the month of the hawkish Fed, the memory-chip crash, and Module 2 round-tripping four separate times. July: -20.44%. This is the one that stings to look at written out plainly. The Alphabet and Tesla reaction, the semiconductor rout that pushed the SOX close to a 20% drawdown, all of it lands here. August, month to date through the 4th: +15.57%. Which lines up with exactly what I wrote about this morning, a genuine rally that just triggered a fresh Module 3 signal.
Seeing it laid out this way is honestly a little humbling. 2026 has been one of the choppiest years in the entire backtest, and the year to date return sitting at 24.94% through early August almost undersells how much whiplash it took to get there. The full year number is going to look calm on a chart in five years. It has not felt calm living through it.
Something I hadn’t fully processed until I saw this update: the worst-10 drawdown table now includes an entry for our own correction.
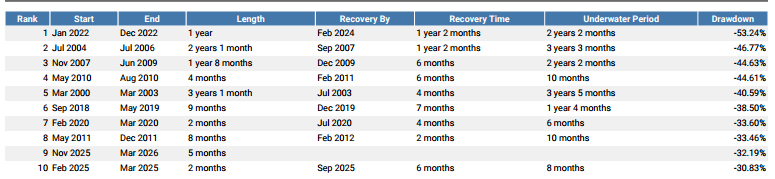
Rank 9 on the list: November 2025 to March 2026, a 5-month drawdown of -32.19%, recovered by May 2026, a 2-month recovery. That’s the Iran war correction we all lived through, now sitting in the historical record right next to the 2011 European debt crisis drawdown and the 2020 COVID crash. It’s strange to see something I personally posted trade alerts about get filed into the same table as events I only know from reading about them.
The worst drawdown on record is still 2022, at -53.24%, and it took over a year to recover from. Our correction, while it felt brutal in real time, ranks as the 9th worst in 27 years and recovered in a fraction of the time. That context genuinely helped me the first time I read it.
This newsletter is for informational and educational purposes only and does not constitute investment advice, a recommendation, an offer, or a solicitation to buy or sell any security, or to engage in any investment strategy. Any views expressed reflect the author's personal opinions and research at the time of writing and may change without notice. All backtested performance data is simulated and does not represent actual trading results — past performance is not indicative of future results. Investing involves risk, including the possible loss of principal. Leveraged ETFs such as TQQQ are complex instruments that carry significant risk and are not suitable for all investors. The author may personally hold positions in one or more of the securities mentioned in this publication. This should be considered a potential conflict of interest. You are solely responsible for your investment decisions. Before acting on any information in this publication, you should conduct your own research and consider consulting a licensed financial professional, tax advisor, or legal advisor.
Comments
Nothing yet. Say the first thing.
Sign in to join the conversation.