
Readers,
Welcome back to My Weekly Stock, where momentum meets discipline. My mission is to arm you with unbiased, data-driven insights you can act on.
Every Friday, I recap the U.S. market through a momentum lens to help you see what’s working and what’s not.
Want to go deeper? Paid subscribers get access to the full momentum framework behind my 30% average annual return since 2019: weekly picks, proprietary tools, and monthly market deep dives.

Here are this week's highlights and what to look out for next:
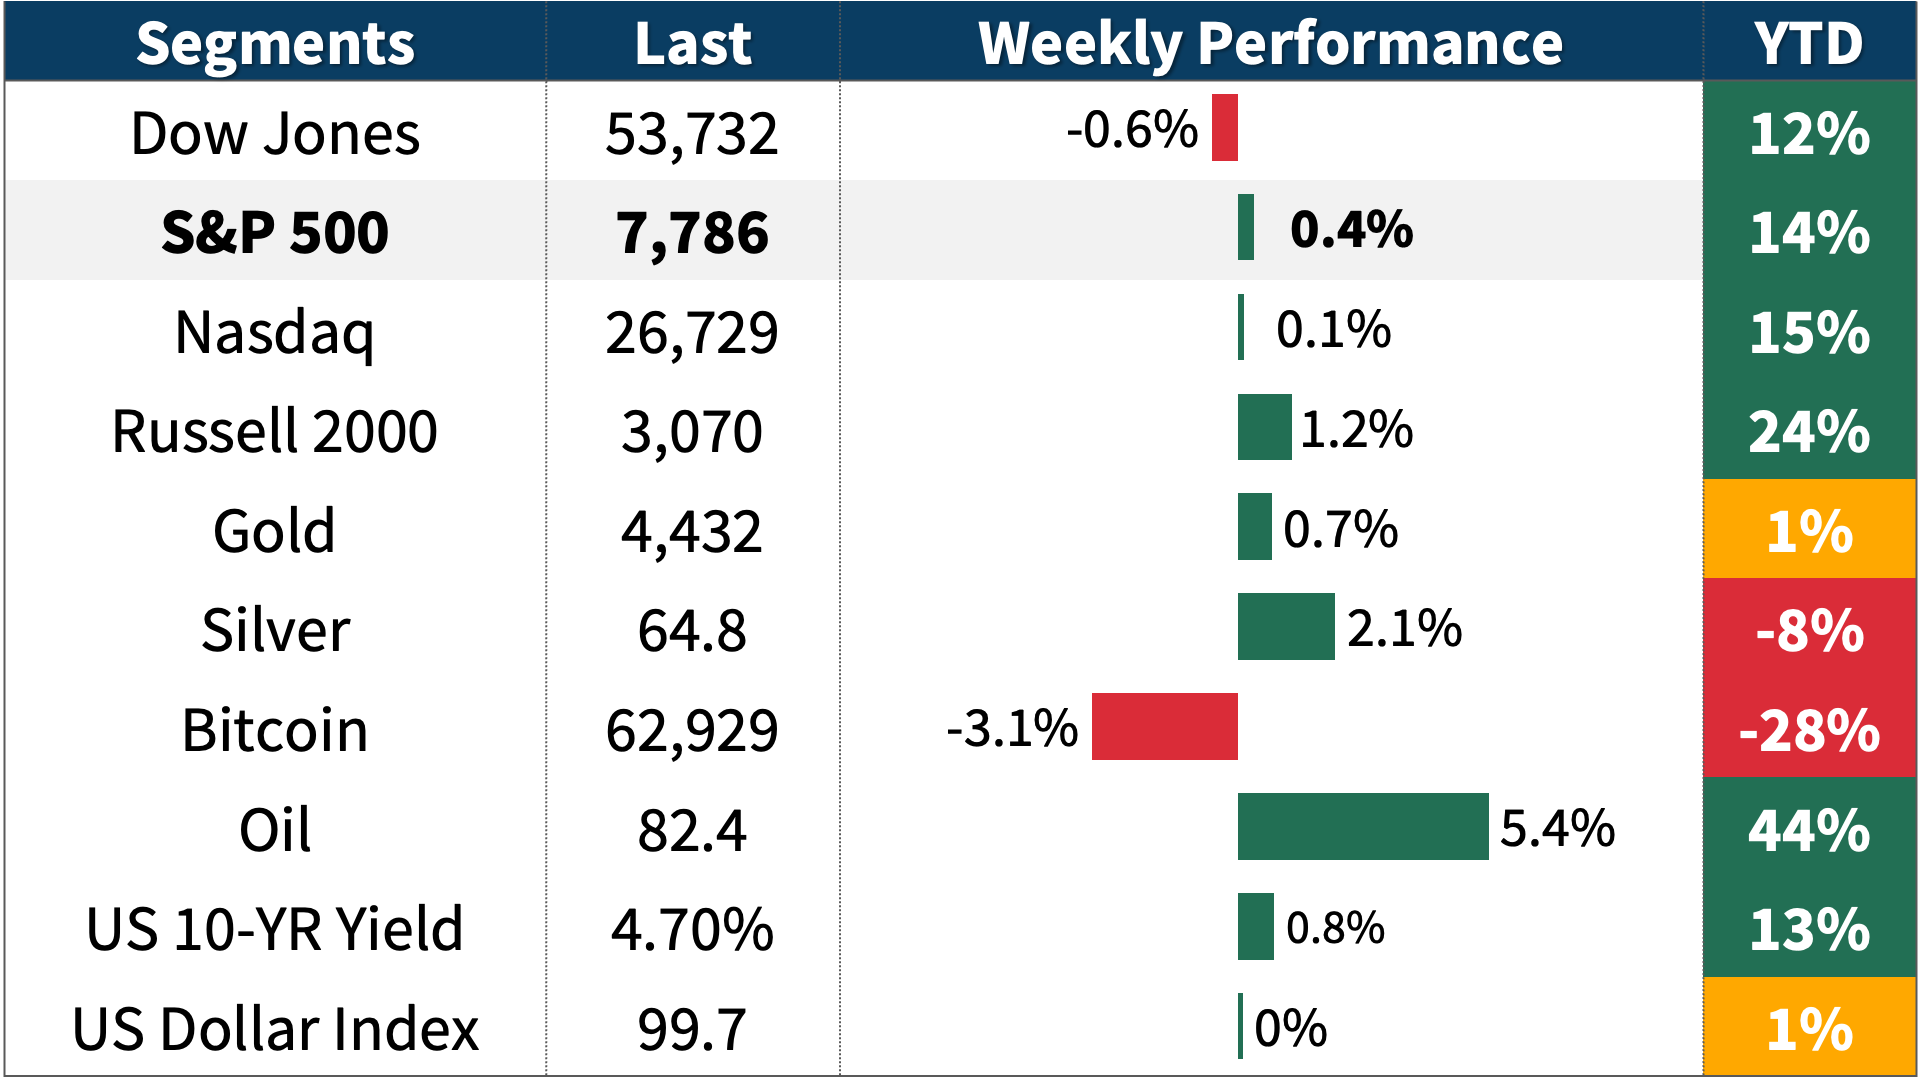
1. Performance Recap: a mixed week across the equity markets: S&P 500 (0.4%), Nasdaq (0.1%), Dow Jones (-0.6%). Sector leaders: Energy (+7.7%) and Utilities (+1.6%).
2. Momentum Pulse Check: S&P 500’s long-term trend is strong and so is the short-term momentum. Next resistance: 7,815; support: 7,630.
3. Earnings Update: 436 S&P 500 companies reported Q2 2026 earnings with 85% topping estimates. Q2 earnings growth: +51%, full-year 2026 outlook: +33%.
4. Sentiment Check: CNN Fear & Greed at 65/100 (Greed); VIX was down 4% to 14.3.
5. Next week’s agenda: Earnings from Walmart and Home Depot. FOMC meeting minutes and PMI data.
📌 My Take:
The index notched a small gain, continuing to ride the recent rally. Breadth was actually quite positive under the surface, with most S&P 500 stocks and sectors finishing higher despite the modest headline number. That looks like a typical digestion week following a strong run, and potentially the setup for the next leg higher.
That said, the 7,800 area capped gains and could be an important level to watch in the coming weeks. A clean break above it would open the door to further upside. For now, the momentum picture remains stable, with the index still well anchored in its short-term uptrend.
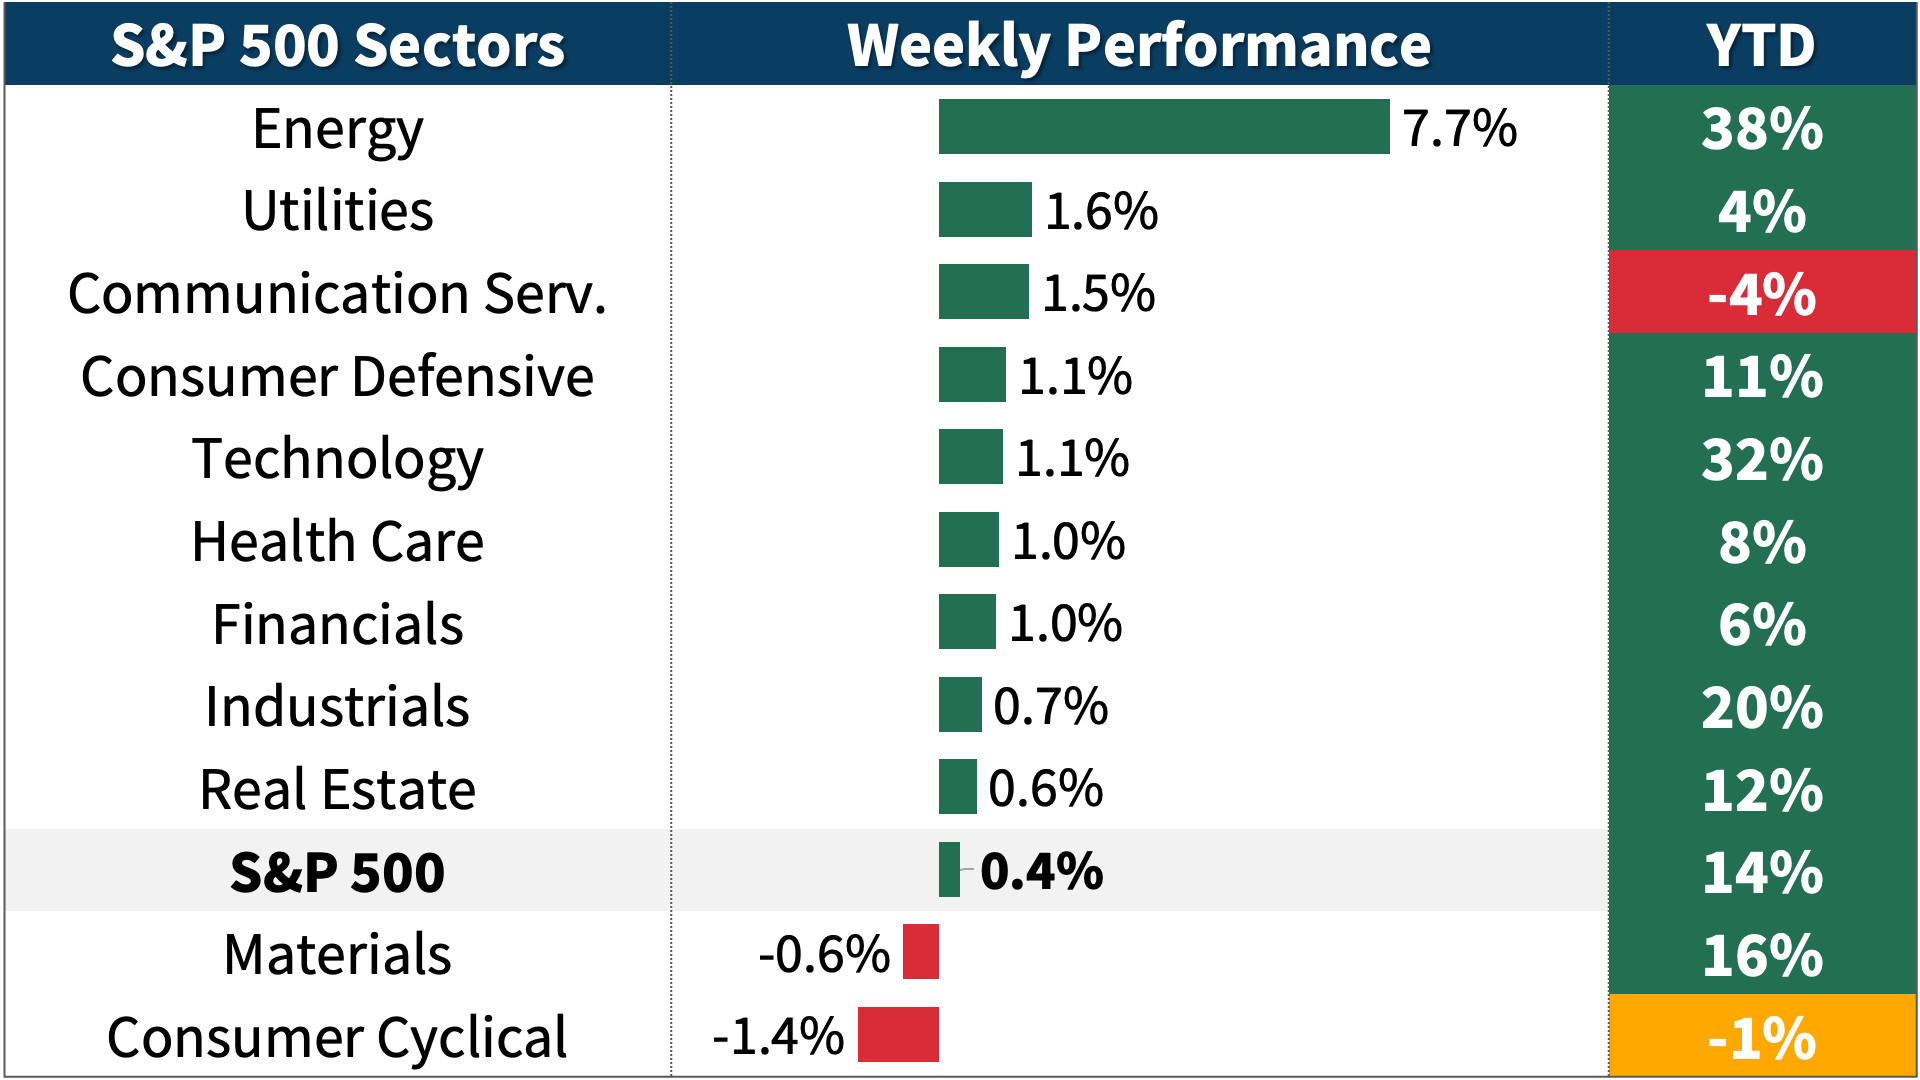
This week: 9 of the 11 sectors advanced. Energy (7.7%) was the best performer, while Consumer Cyclical (-1.4%) was the weakest.
Year-to-date: 9 sectors are positive. Energy (38.5 %) is the leader, while Communication Serv. (-4.1%) is the laggard.
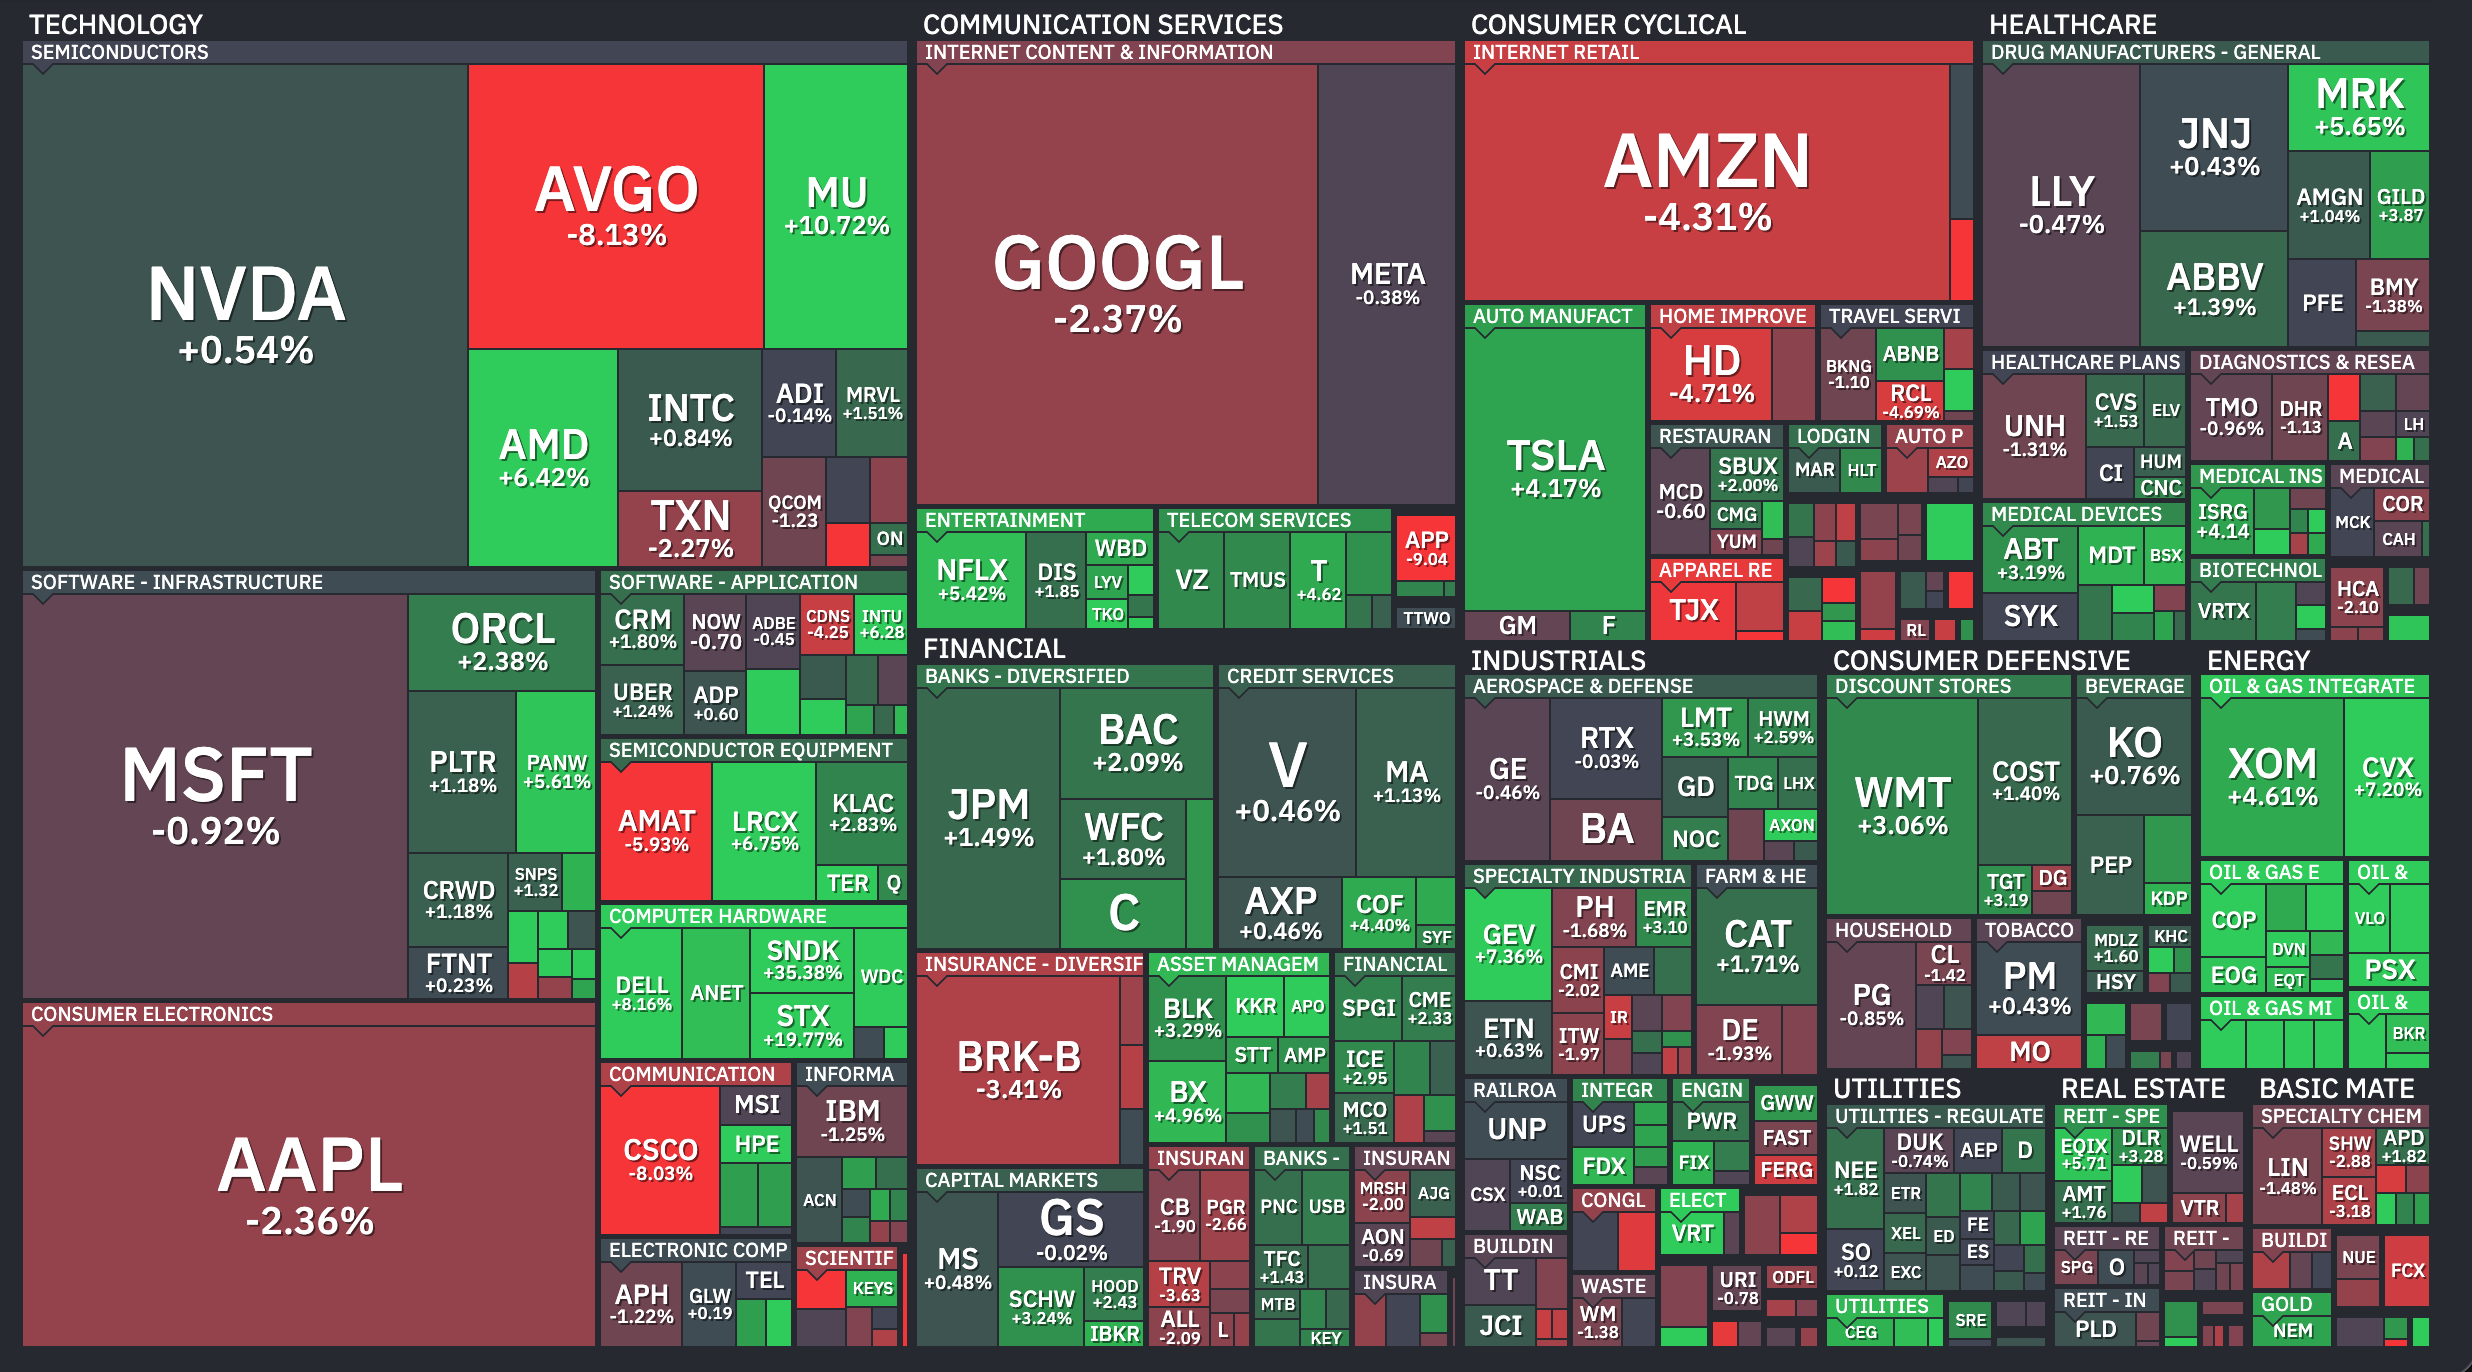
Over the last five trading days, 59% of S&P 500 stocks closed higher.
Top Performers:
$SNDK (Sandisk Corporation): 35.4%
$SMCI (Super Micro Computer, Inc.): 28%
$STX (Seagate Technology Holdings PLC): 19.8%
$MPC (Marathon Petroleum Corporation): 19.2%
$WDC (Western Digital Corporation): 17.2%
Worst Performers:
$APP (Applovin Corporation): -9%
$ULTA (Ulta Beauty, Inc.): -9.6%
$FSLR (First Solar, Inc.): -9.8%
$COHR (Coherent Corp.): -14.1%
$TPR (Tapestry, Inc.): -20.6%
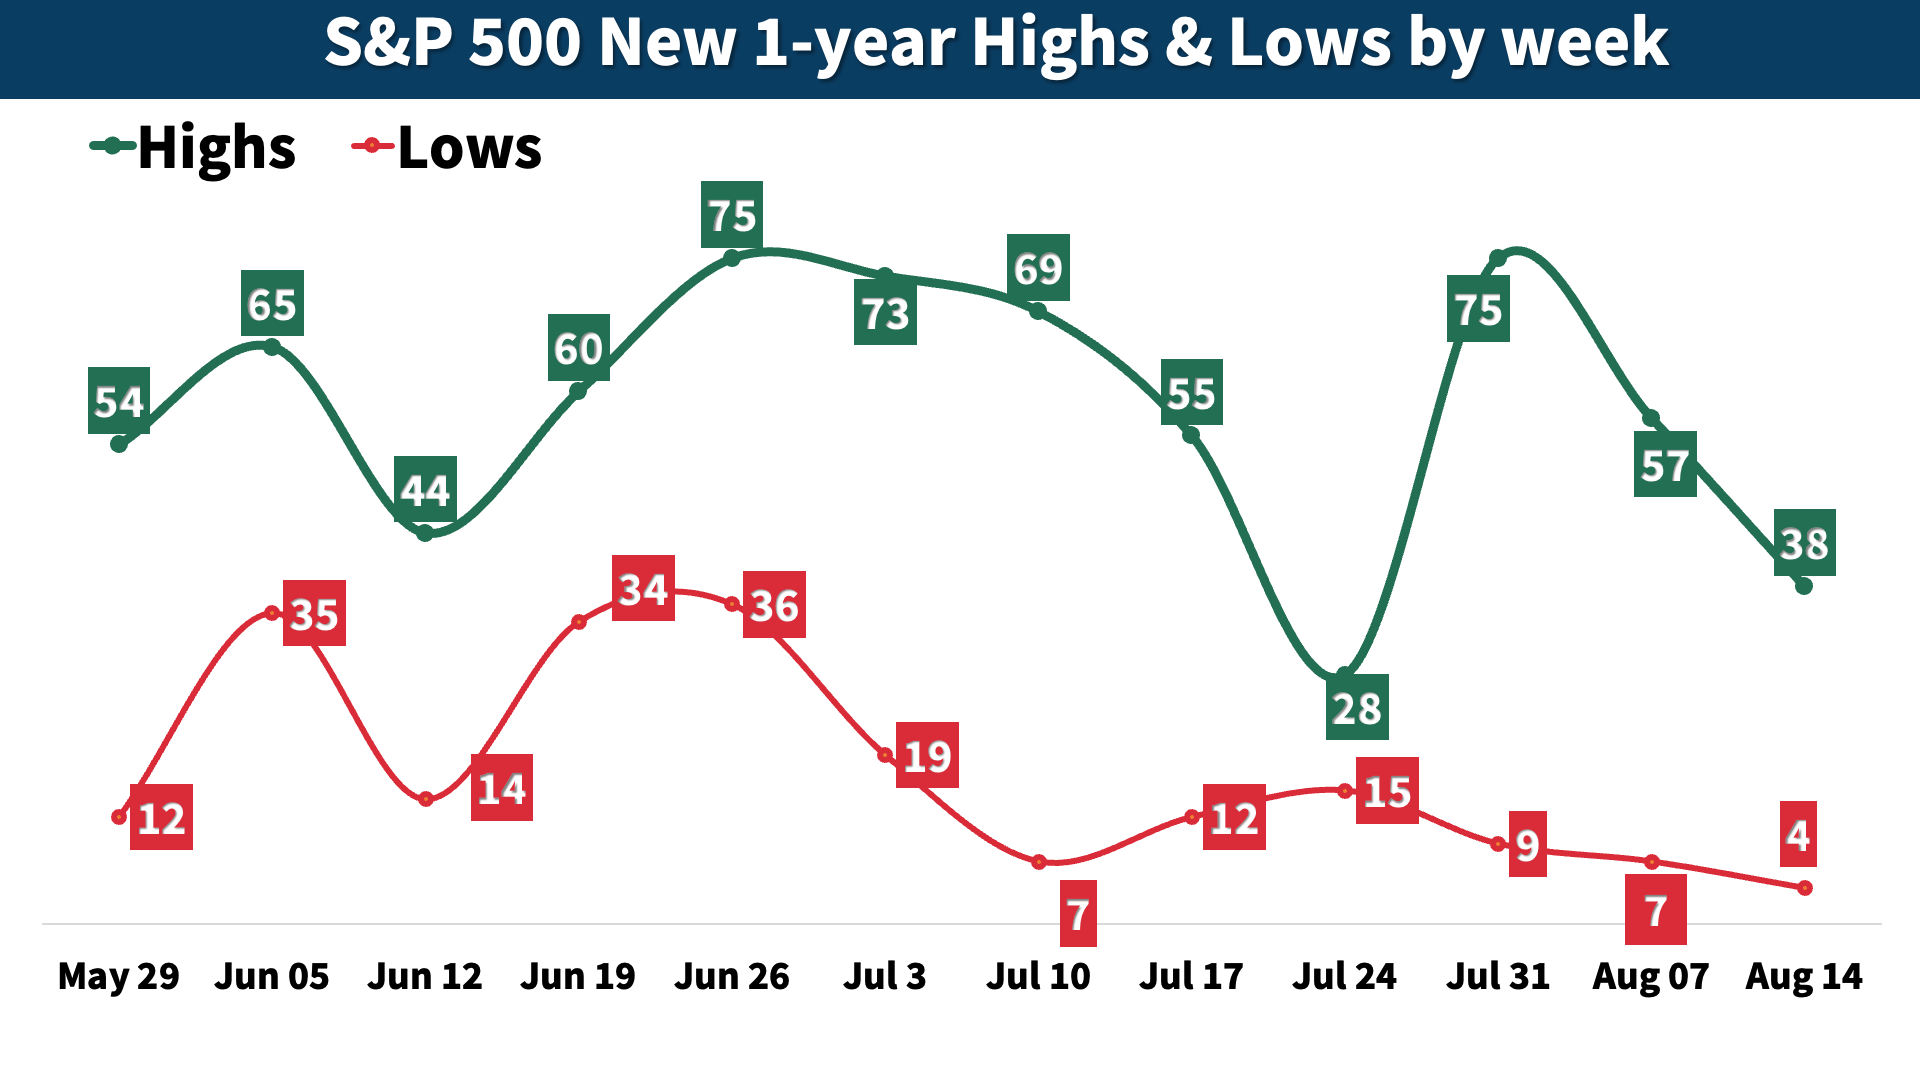
This week, 38 S&P 500 stocks hit new 52-week highs, while 4 stocks fell to new lows.Financials stood out, contributing 7 of this week’s new highs.
Notable new 52-week highs:
$BRK.B (Berkshire Hathaway Inc. New)
$JPM (JP Morgan Chase & Co.)
$BAC (Bank of America Corporation)
$RTX (RTX Corporation)
$PANW (Palo Alto Networks, Inc.)
Notable new 52-week lows:
$APP (Applovin Corporation)
$TTD (The Trade Desk, Inc.)
$ZTS (Zoetis Inc.)
$ROL (Rollins, Inc.)
📌 My take:
A positive week across the board, with most S&P 500 stocks and sectors finishing higher despite the modest headline index performance. This looks like a typical week of digesting the recent rally and potentially setting the stage for the next leg higher.
(1) Performance: positive short-term performance, and trading at short distance form 1-year high.
1-month performance: +3.4%
3-month performance: +3.8%
Distance from 52-week high: -0.2%
(2) Breadth: positive breadth reading.
Breadth measures how many stocks are joining the move. Extreme readings (>80% or <20%) often signal overbought/oversold conditions and serve as early warning signs of a trend reversal.
% of stocks above 200-day moving average: 72% (flat from last week)
% of stocks above 20-day moving average: 66% (up from 65% last week)
(3) Trends: strong long-term and short-term uptrend.
I analyze trend strength using exponential moving averages (EMAs) and score them on a 1-5 scale. A score of 3+ indicates a healthy trend worth riding.
Weekly chart (long-term/position):
Strong Uptrend ⭐⭐⭐⭐⭐, Status: Stable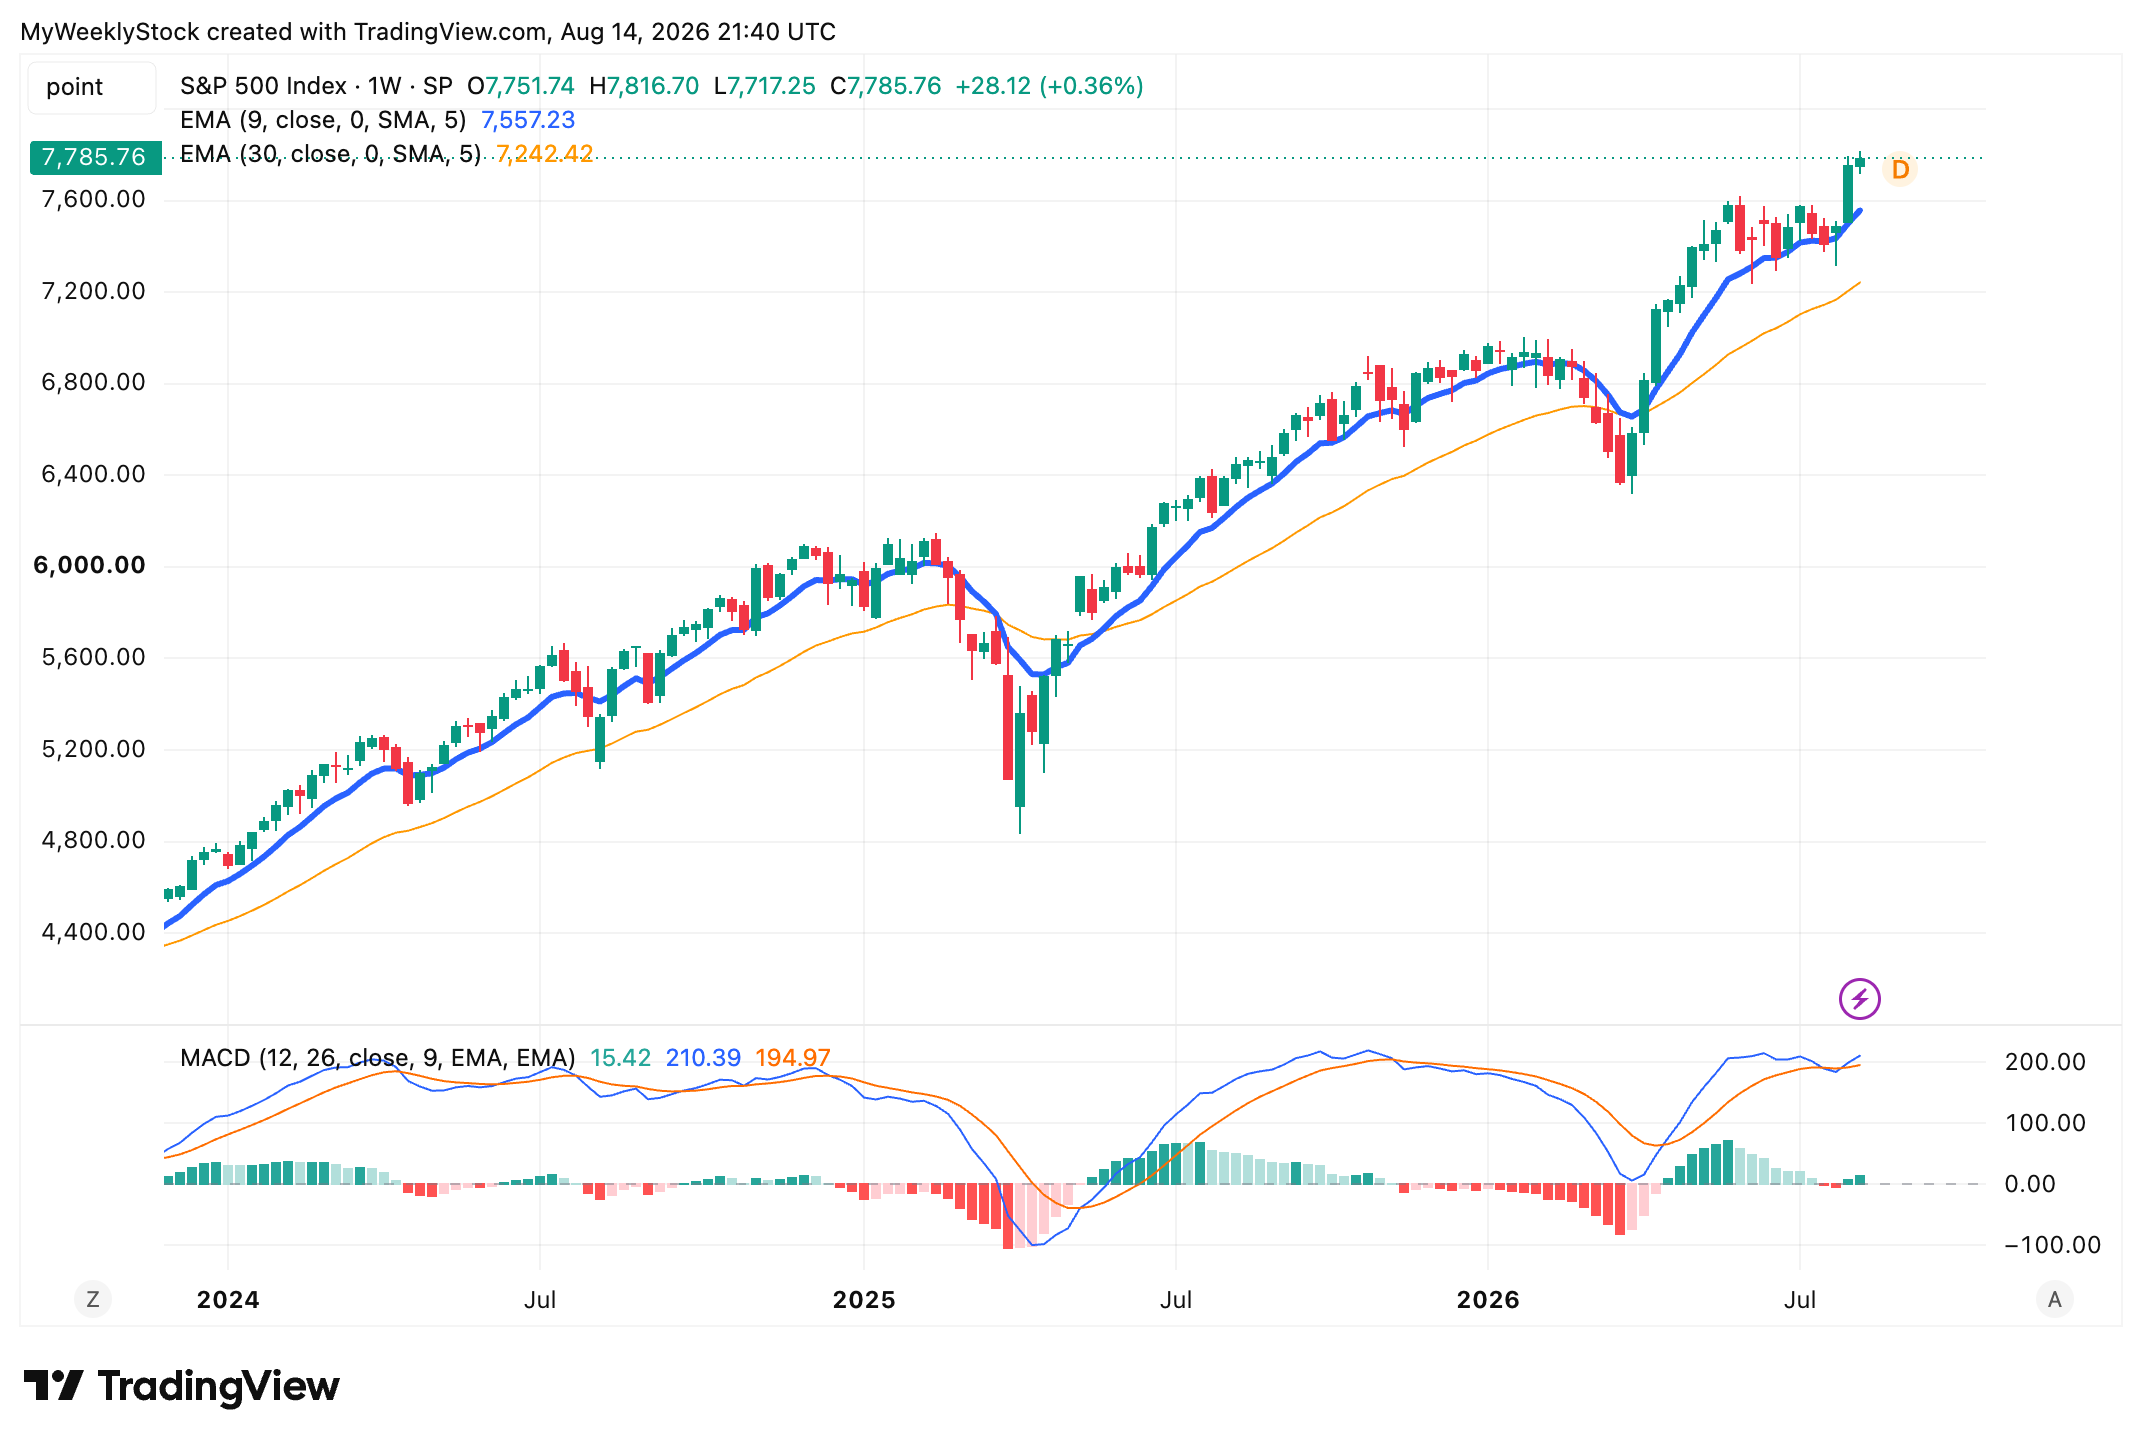
Daily chart (mid-term/swing trade):
Strong Uptrend ⭐⭐⭐⭐⭐, Status: Stable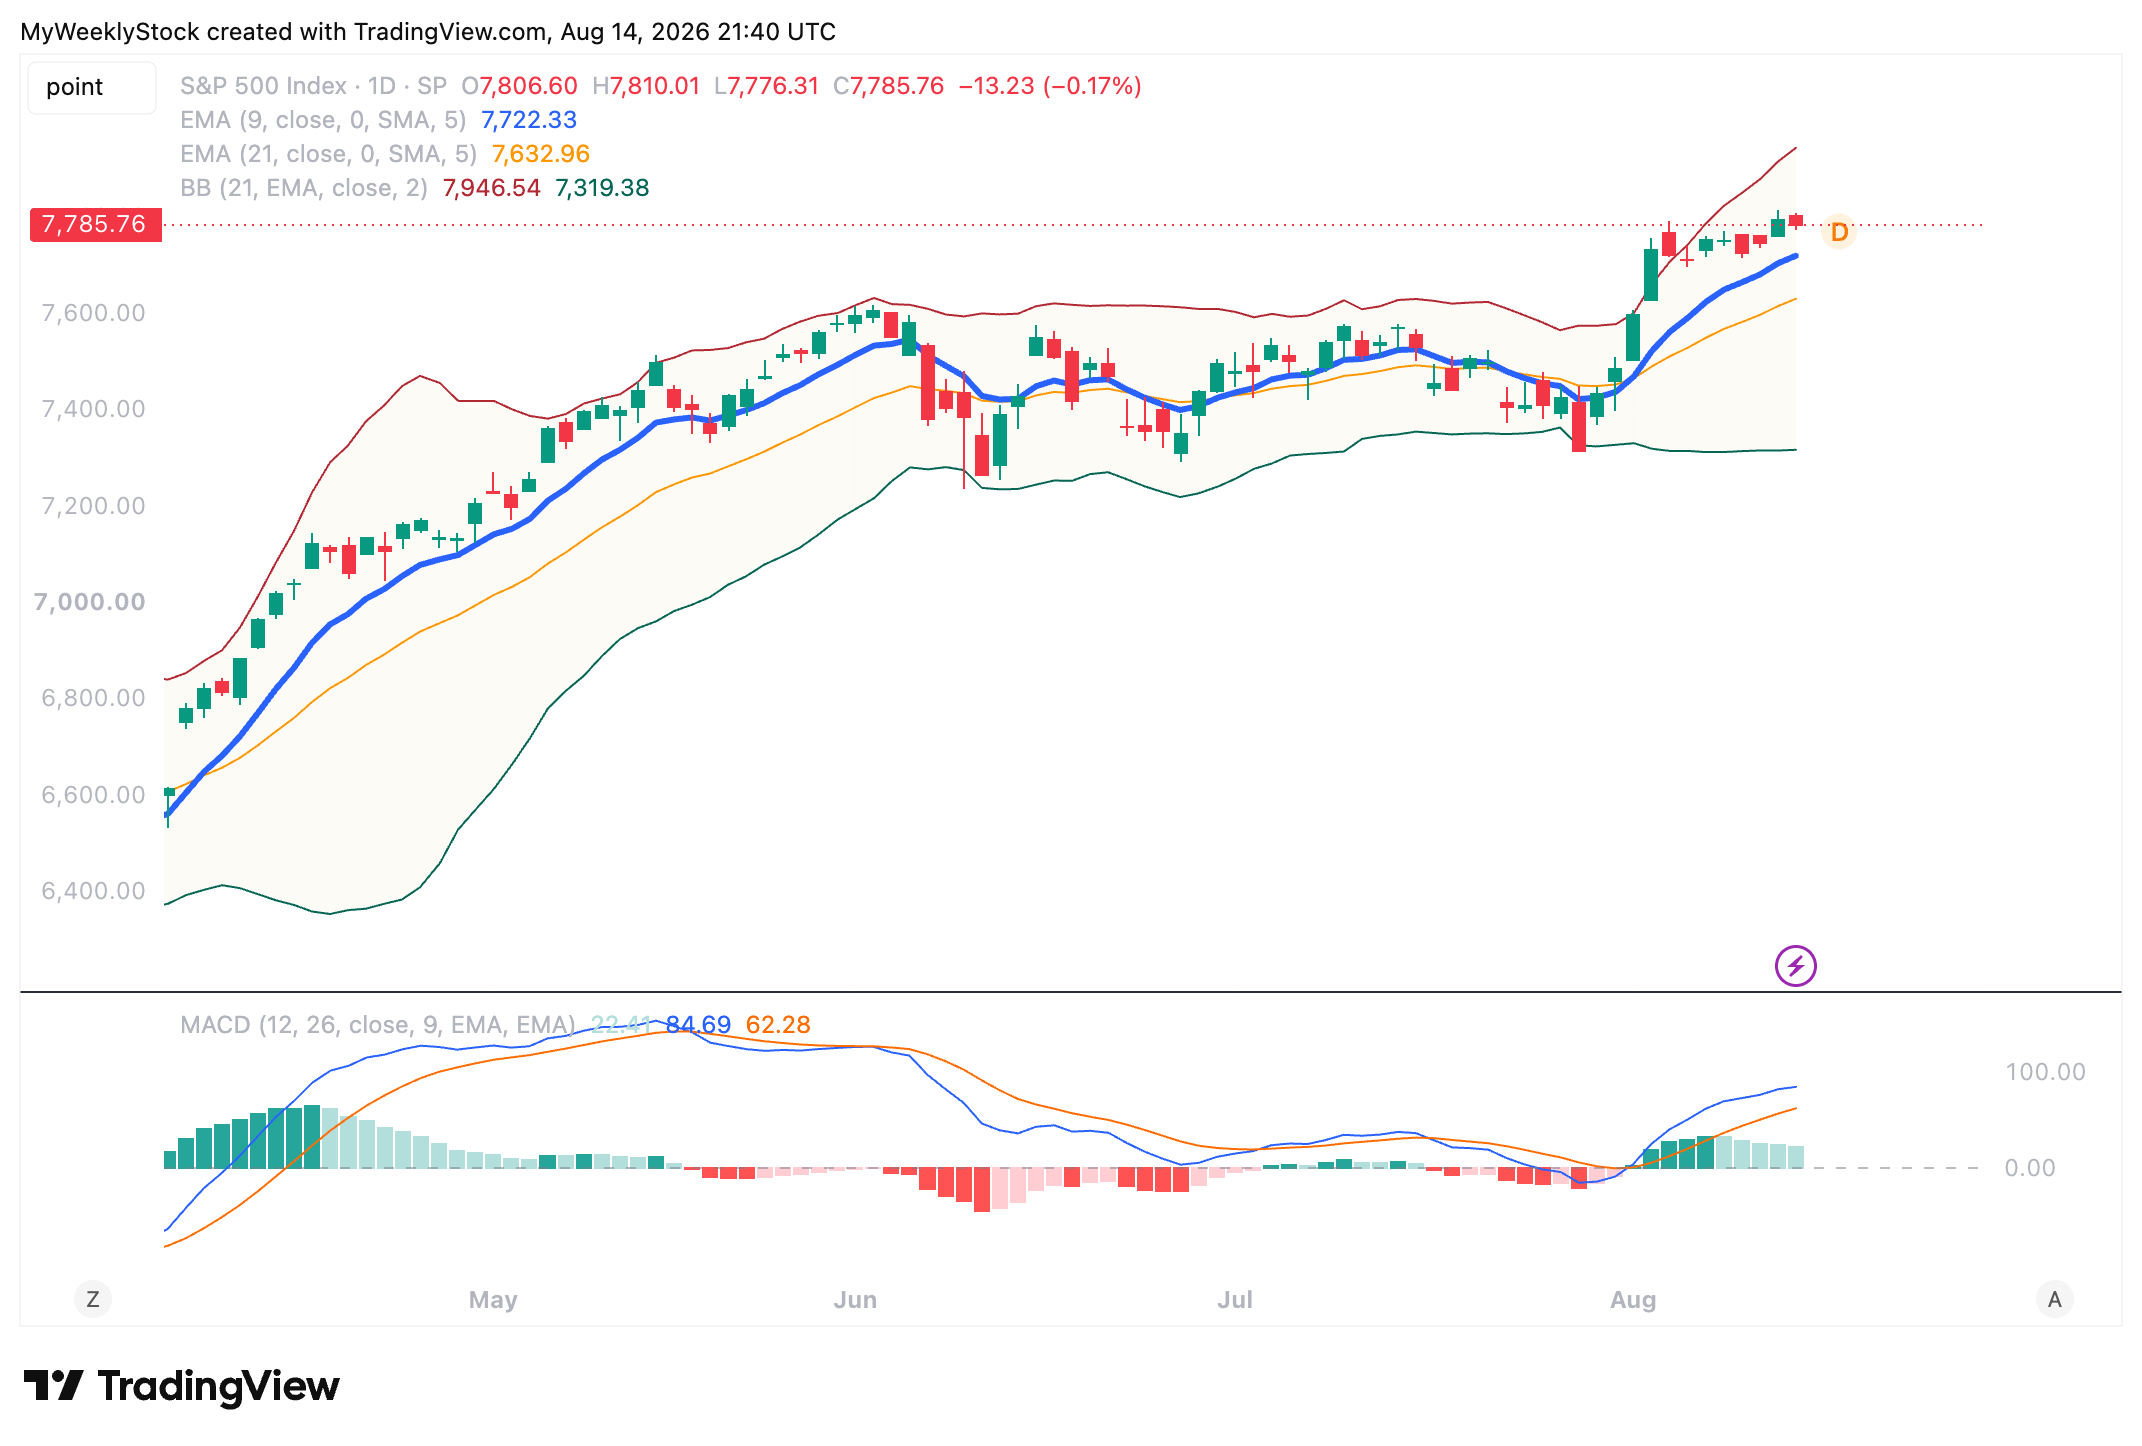
4) Key levels:
Critical price zones that either confirm the current trend or warn of a potential reversal.
Support (downside zones to watch)
7,310 (-6.1%)
7500 (-3.7%)
7,630 (2.0%)
Resistance (upside hurdles)
7,815 (+0.4%)
8,000 (+2.8%)
📌 My take:
The momentum picture remains stable week over week, with the index still well anchored in its short-term uptrend. The next key test is the 7,800 resistance level, which needs to be cleared to open the door for further upside.
Each week, I select a specific theme and run the entire framework to pinpoint where the momentum lies.
This week, the theme is the Consumer Cyclicals. Sector leaders have seen strong momentum, particularly in the travel and consumer discretionary space. $ABNB and $BKNG are clear standouts with 30%+ gains in the past month. As usual, I also like to keep an eye on the bottom of the list for potential recovery stories in the making. Only $MCD is showing an attempt at a bounce with warming momentum.
I selected a name with recently reported earnings and ran it through the full Momentum Pulse Check to assess the implications for long-term positions. This week: Eli Lilly ($LLY).
My View → HOLD
$LLY has all the marks of a reliable market leader: up more than 20% over 3 months, leading the S&P 500 by a wide margin, and trading at record highs.
But what makes this chart truly clean is not the performance but the structure. Price is trading above rising trend lines with no signs of exhaustion and not overheating. Just a healthy uptrend doing exactly what a healthy uptrend should do. And that makes continuation the base case.
The full breakdown (trend score, key levels, and implications) is available in this Substack Note.
This analysis is built using my Momentum Pulse Check, a tool I use to assess trend and momentum across markets.
Paid subscribers can access the tool to explore the same signals and context in real time.
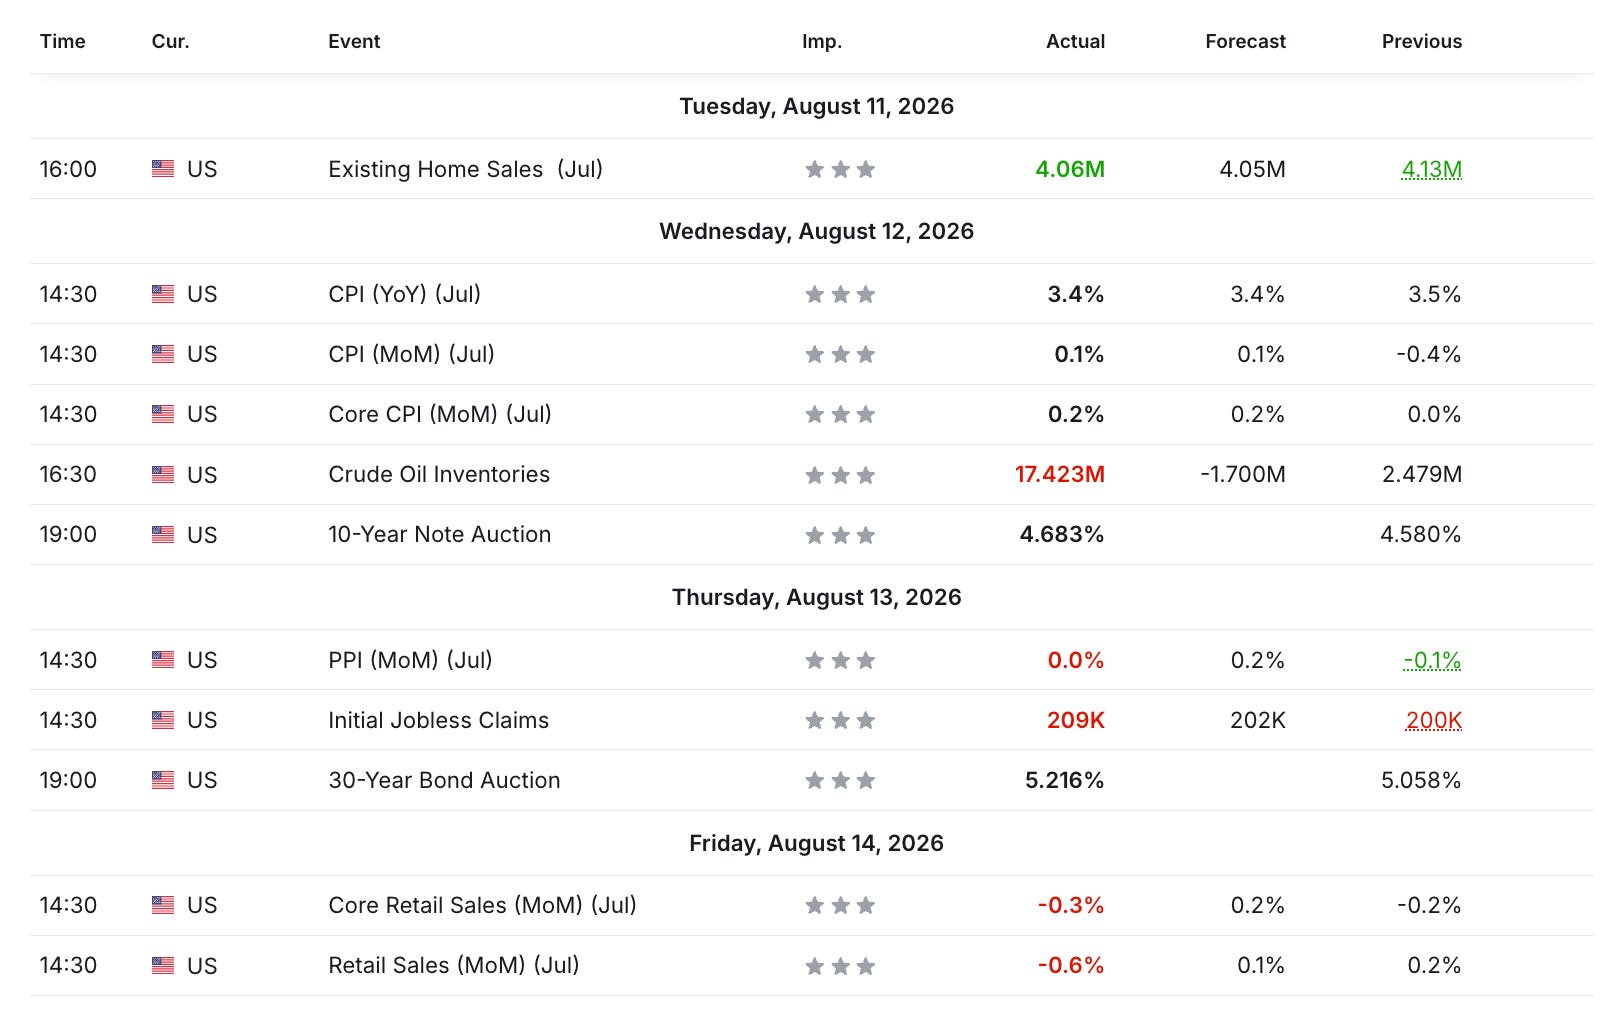
Last week was mostly about inflation and consumer data. Inflation came in largely in line with expectations, with CPI continuing to run above the Fed’s 2% target, while PPI was softer than expected. Retail sales were the bigger disappointment on Friday, with both headline and core sales contracting and missing expectations.
Key data:
CPI (MoM): 0.1% vs. 0.1% expected
Core CPI (MoM): 0.2% vs. 0.2% expected
CPI (YoY): 3.4% vs. 3.4% expected
PPI (MoM): 0.0% vs. 0.2% expected
Retail Sales (MoM): -0.6% vs. 0.1% expected
Core Retail Sales (MoM): -0.3% vs. 0.2% expected
Q2 2026 Earnings: S&P 500 earnings expected to grow +51% year-over-year (+47% when excluding Energy).
2026 Full-Year Outlook: Consensus forecasts +33% growth, largely above the 10-year average of +9 %.
Analyst Revisions: 68% of all revisions in the past month have been upward.
Valuation: Forward 4-quarter P/E ratio stands at 20.5, above both the 5-year and 10-year historical averages.
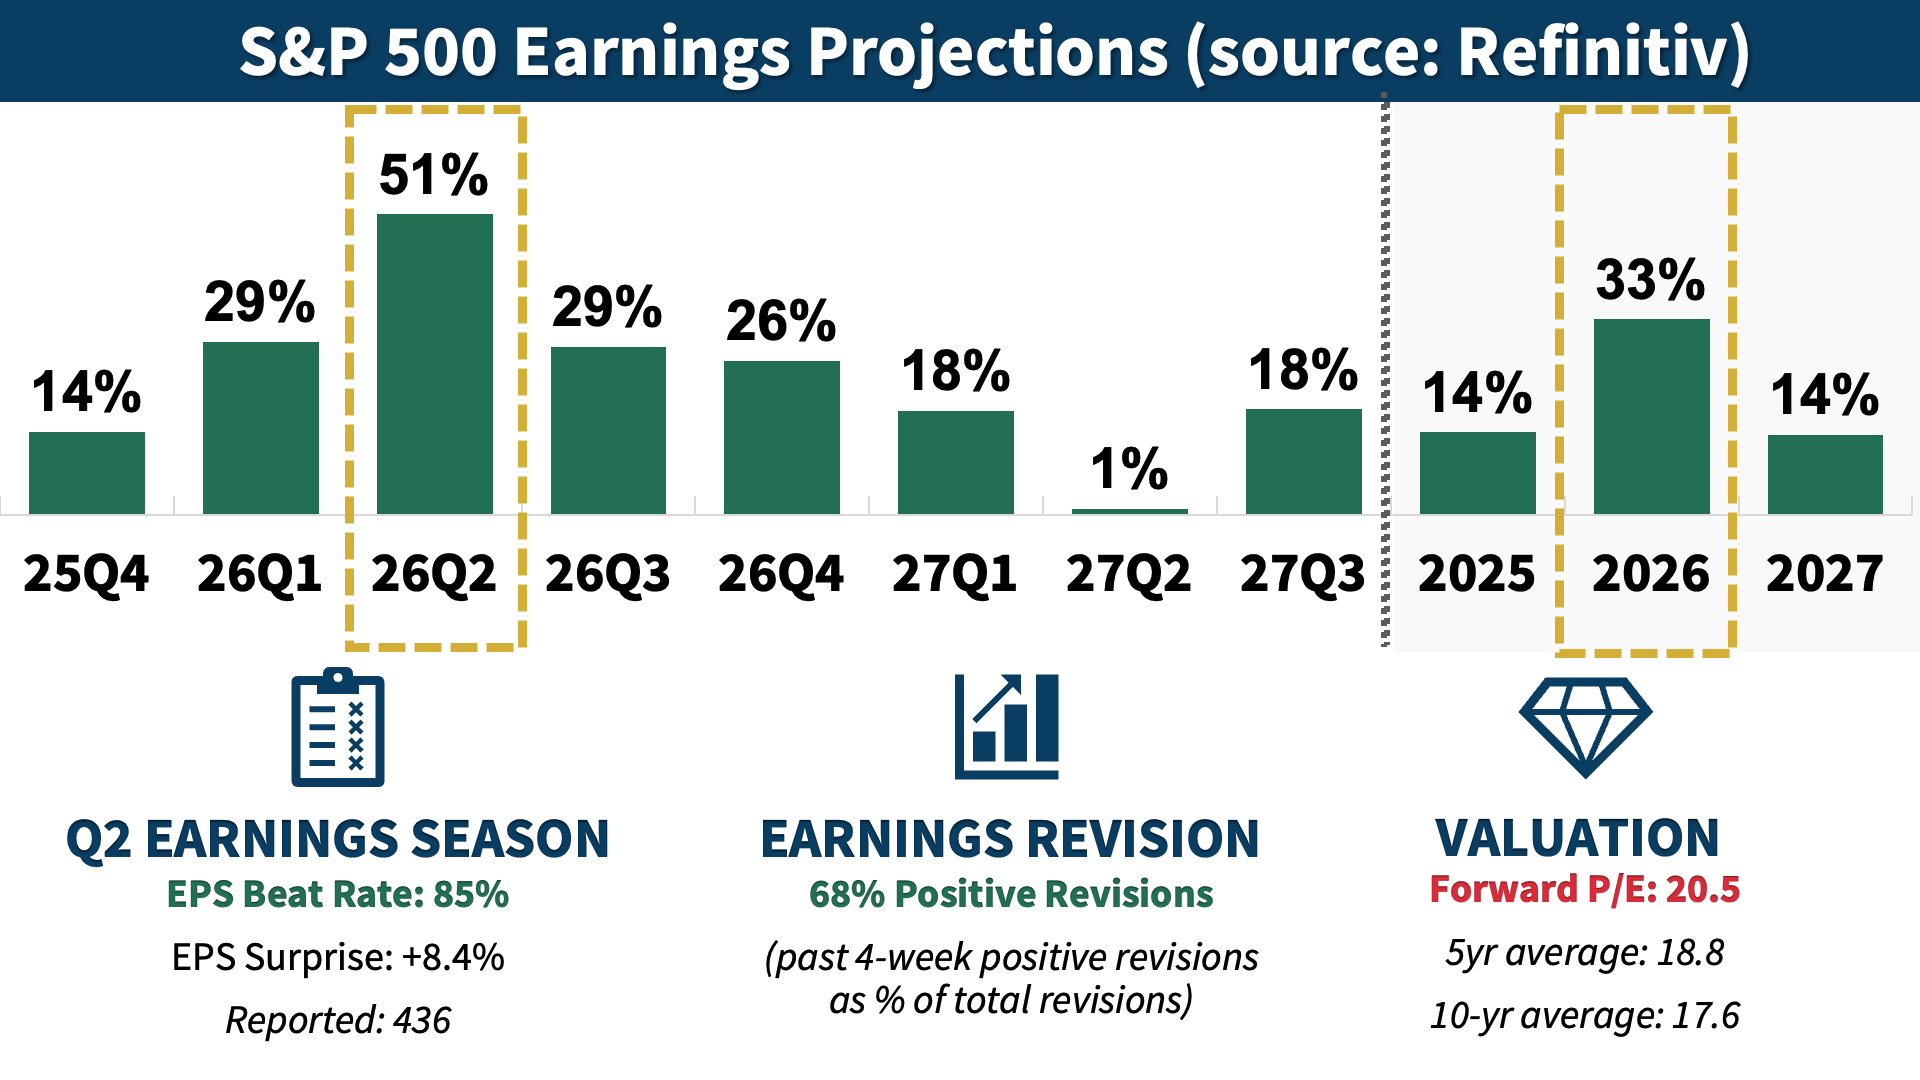
Out of the 436 S&P 500 companies that have reported Q2 2026 earnings, 85% exceeded EPS expectations, above the four-quarter average of 80% and above the historical average of 67%.
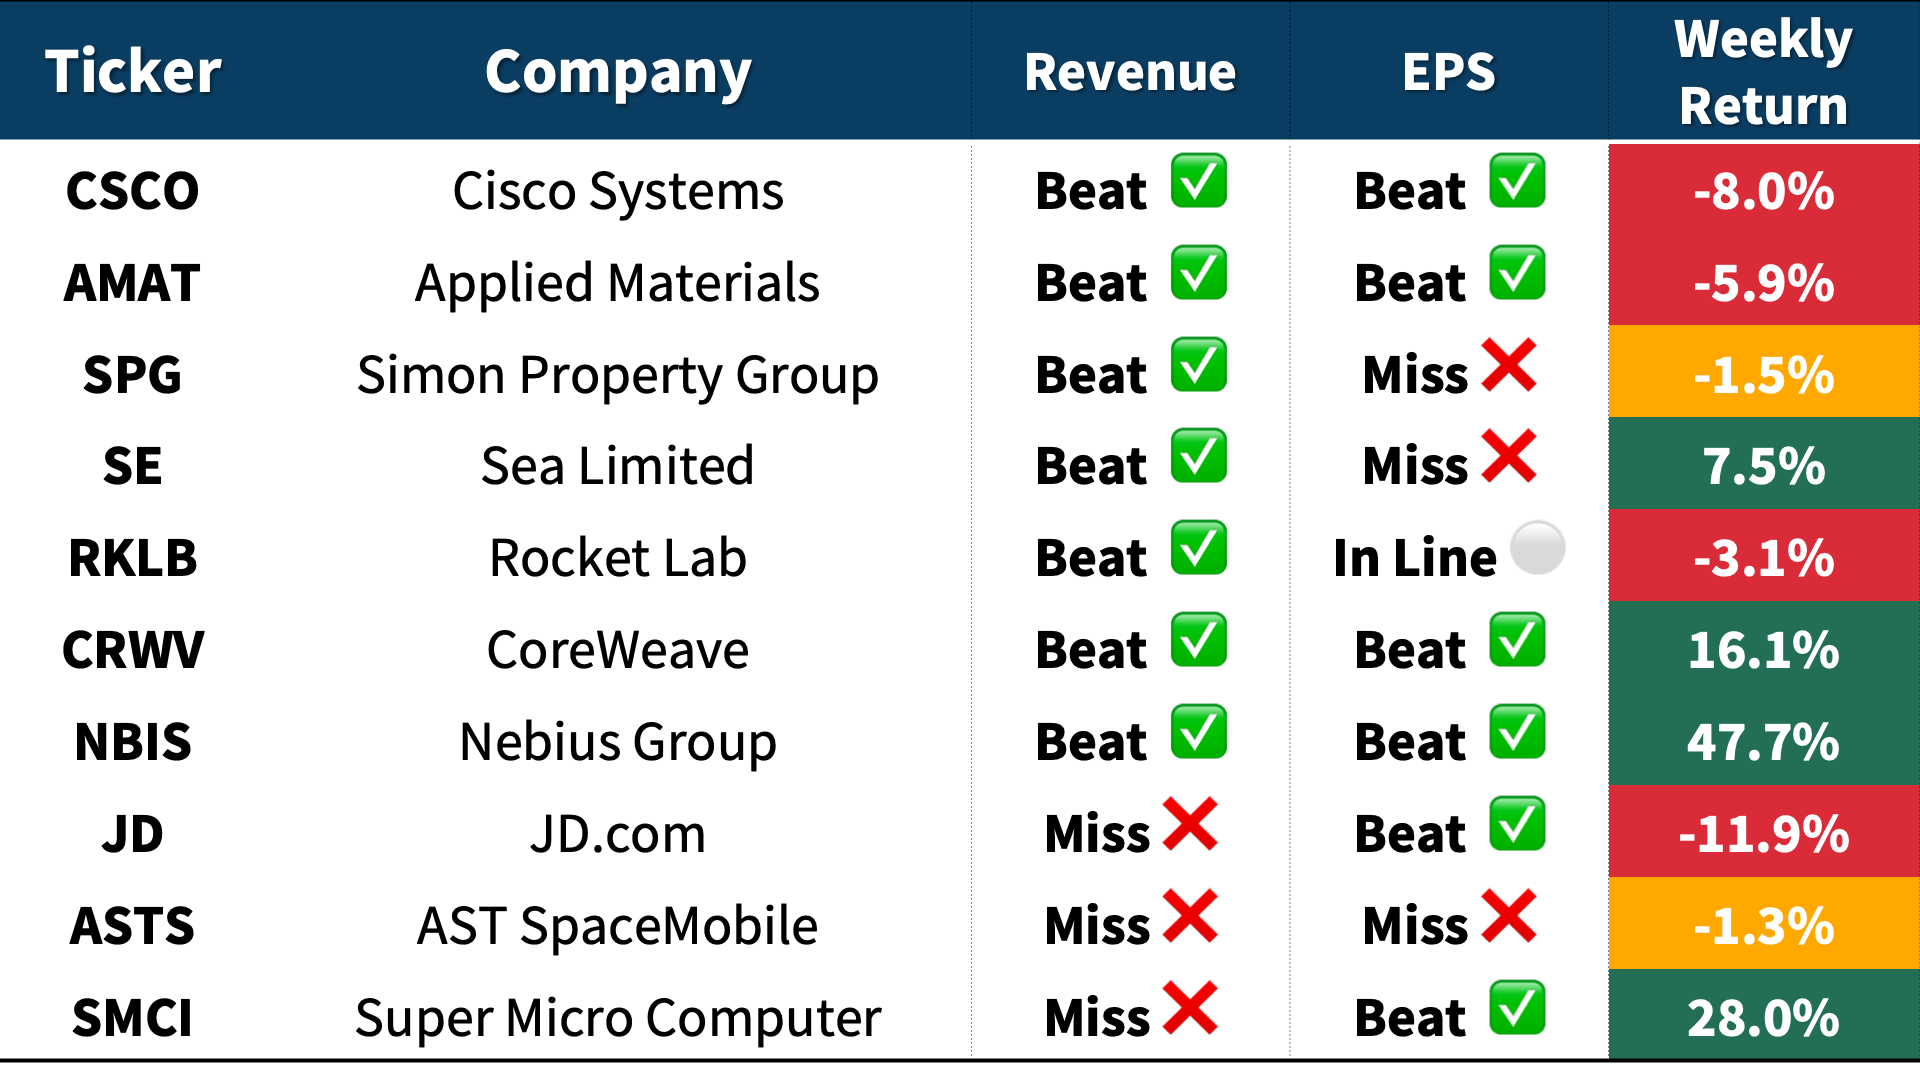
Below are some notable companies that reported last week, along with their EPS/revenue performance vs. estimates and weekly stock returns.
One highlight this week: Nebius and CoreWeave. $NBIS and $CRWV surged post-earnings as strong revenue growth, rising AI compute demand, and upbeat forward outlooks reinforced confidence that customers are absorbing aggressive capacity expansion. The stocks were up 48% and 16% respectively for the week.
📌 My take:
Inflation data coming in as expected and strong earnings from several AI names helped lift market sentiment last week.
Sentiment indicators offer a window into the views of professional and retail traders. While not predictive on their own, they complement technical and fundamental analysis, helping to assess the market’s predominant sentiment.
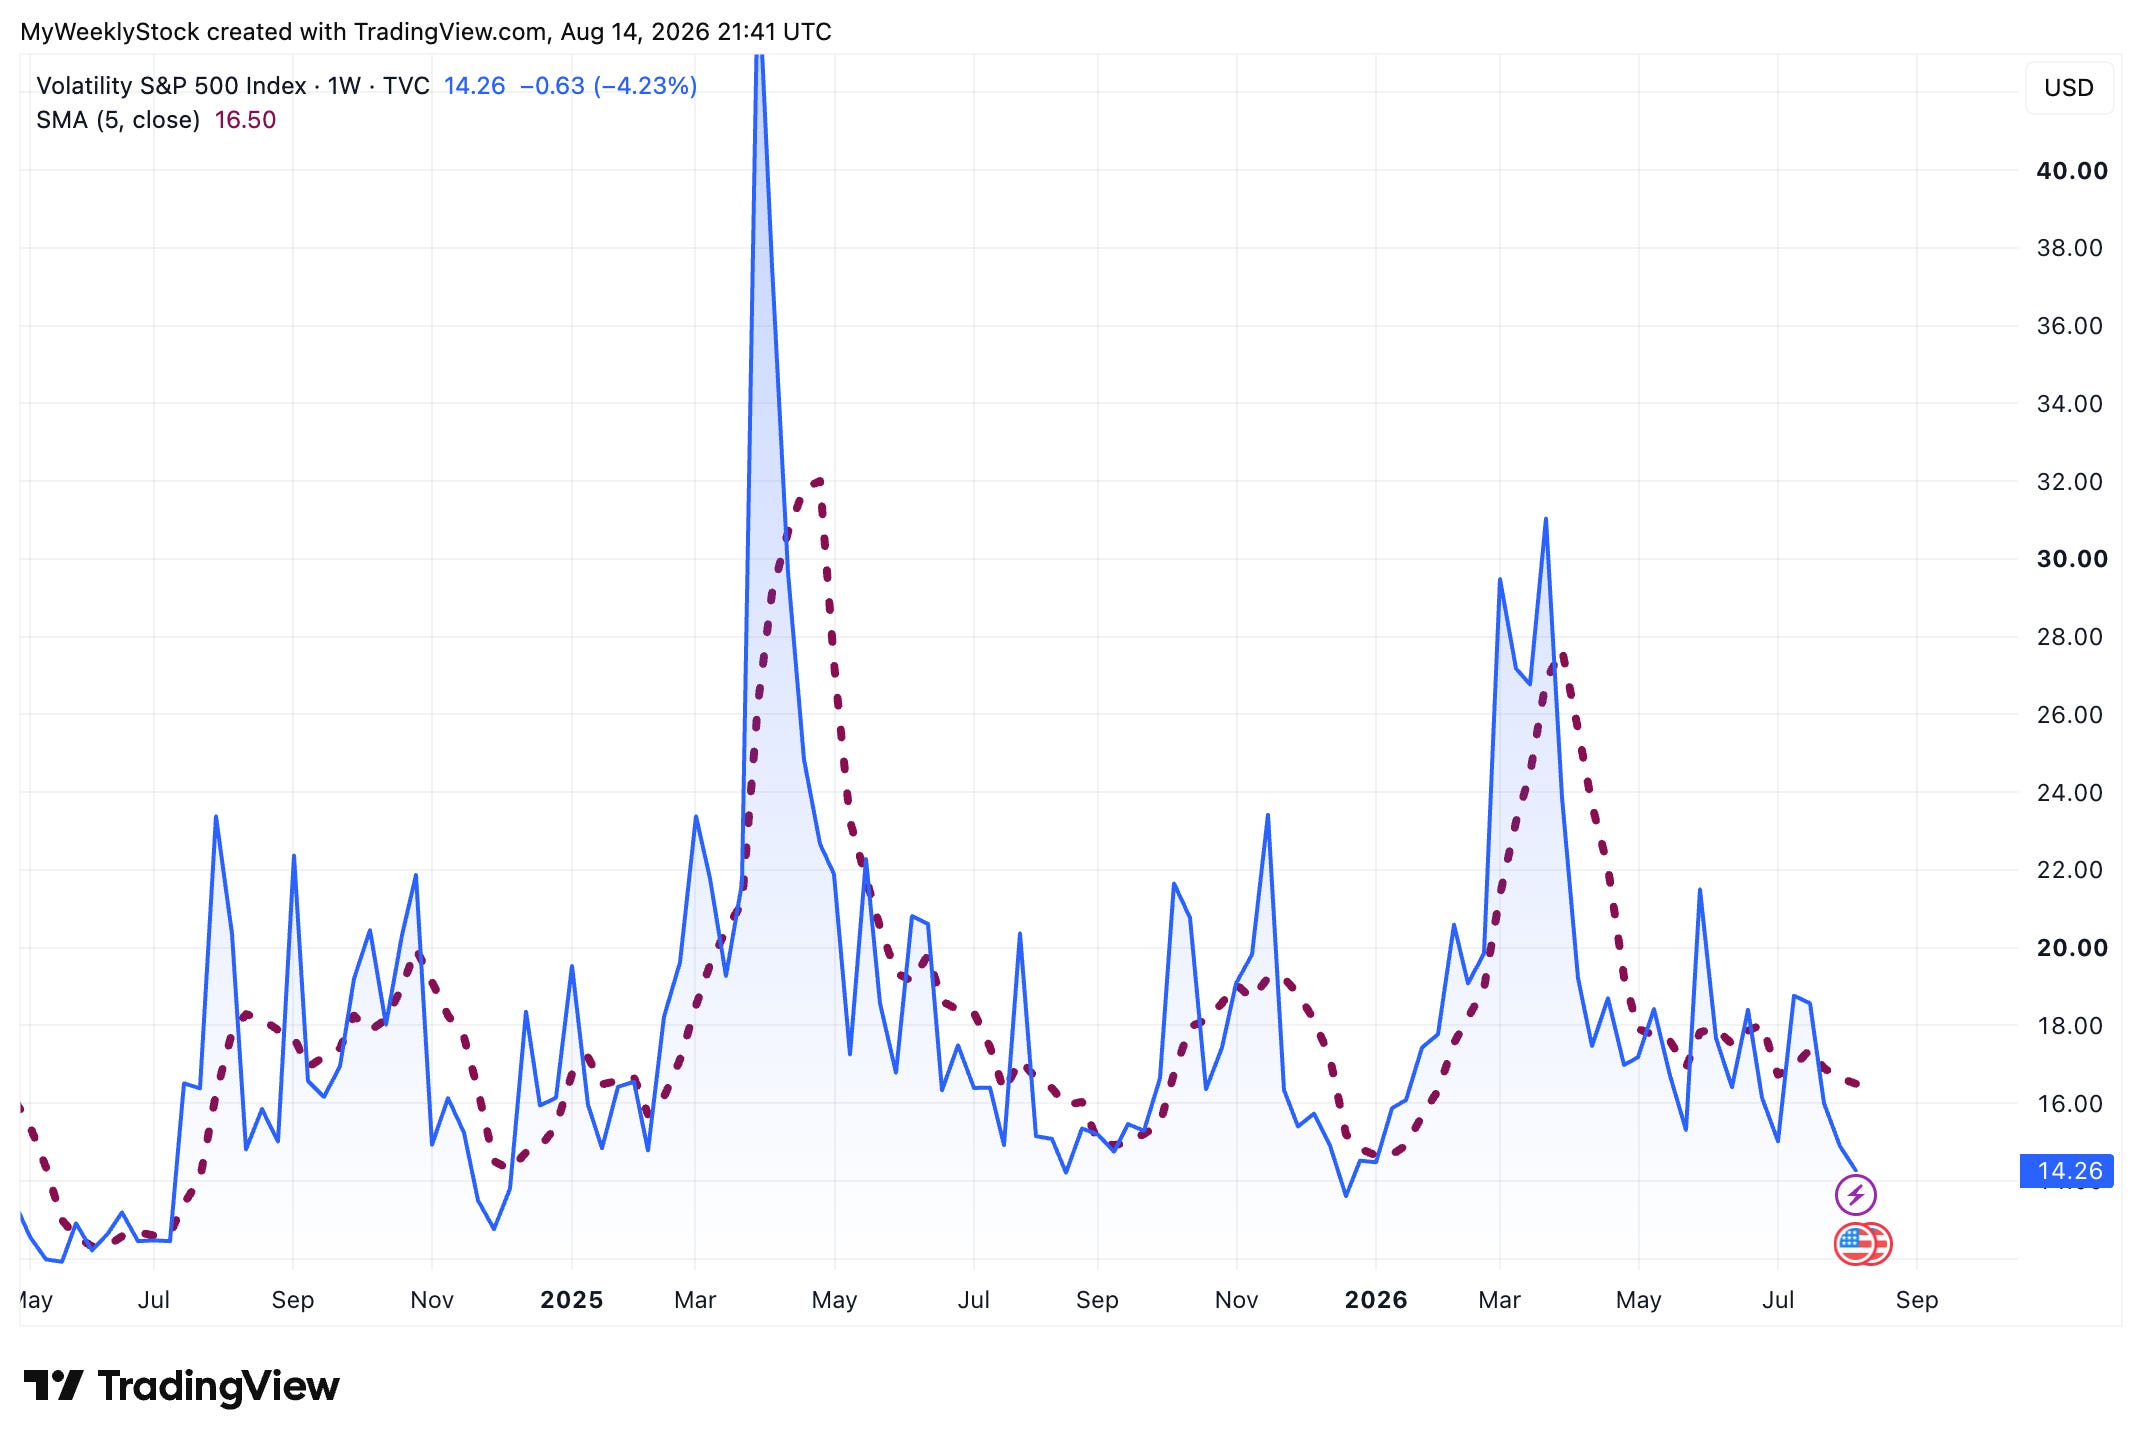
The VIX, or volatility index, measures expected volatility over the next 30 days using option prices. It is often called the “fear gauge” because it rises during uncertain times, when investors anticipate larger swings.
Current reading: 14.3, a low value, and down 4% from last Friday.
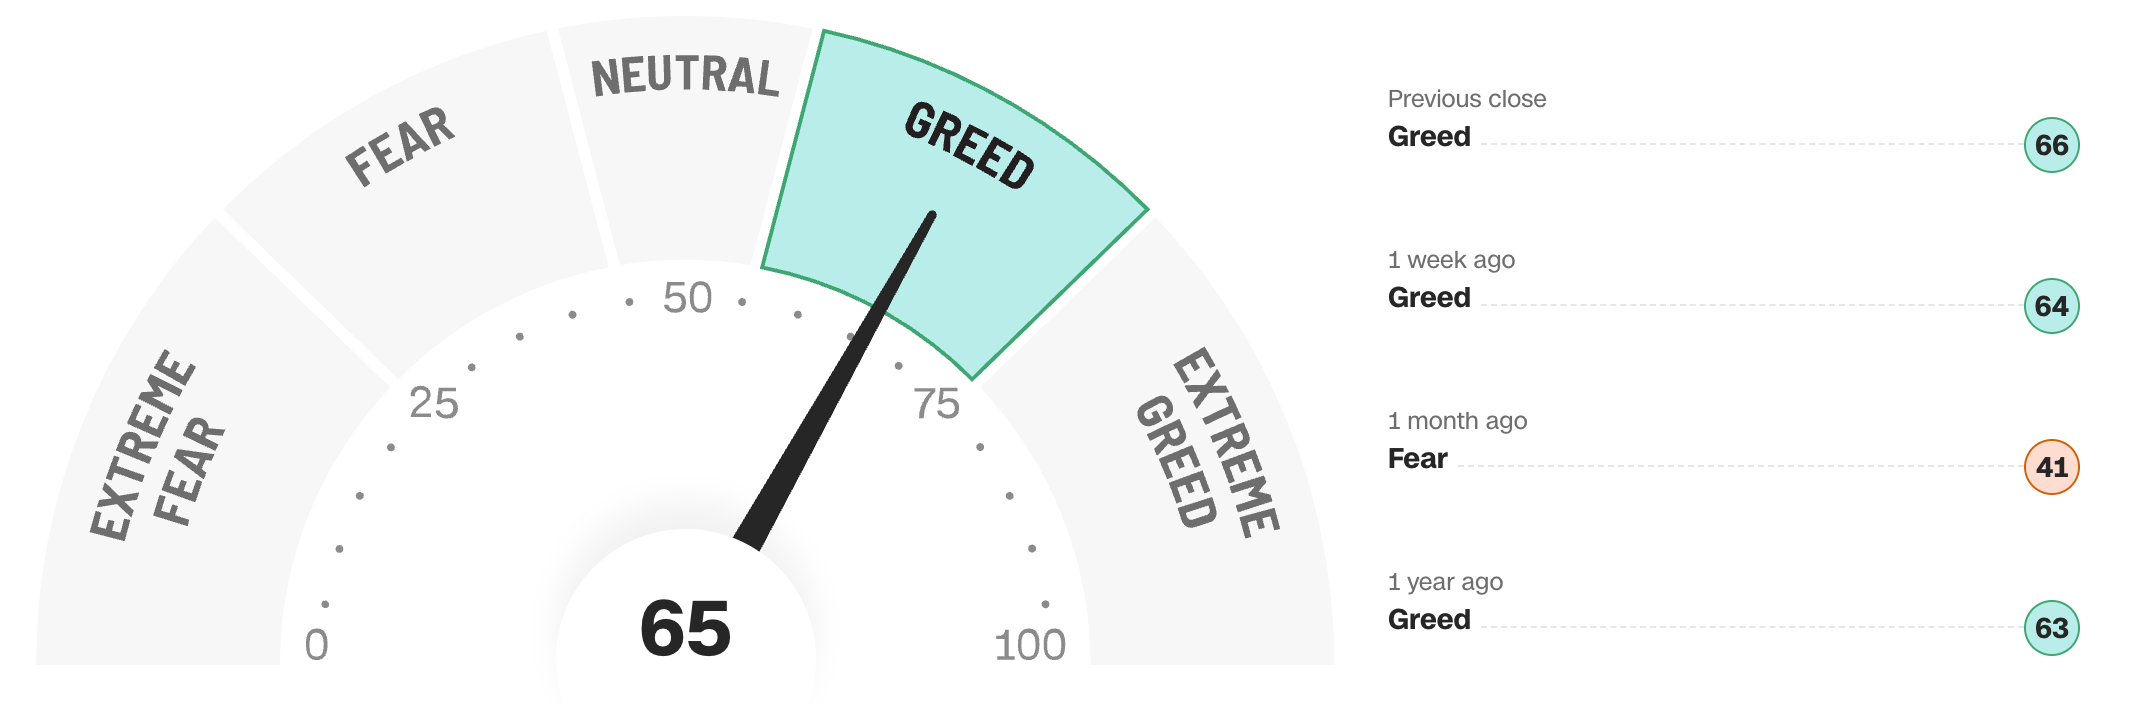
This index combines seven market indicators to score investor sentiment from 0 (Extreme Fear) to 100 (Extreme Greed).
Current reading is 65 (Greed), up from 64 a week ago.
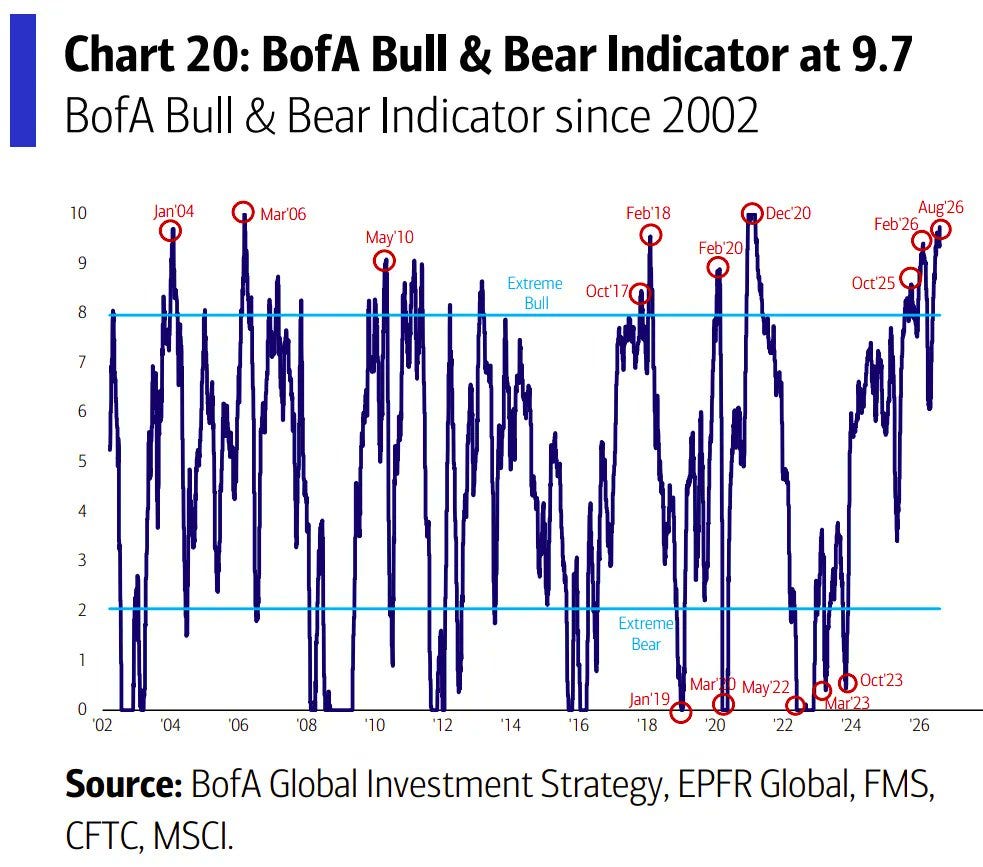
The Bank of America Bull & Bear Indicator is a contrarian tool that tracks global investor sentiment and market positioning. The indicator combines six factors, including positioning, fund flows, and various liquidity and risk metrics.
The scoring system was updated in December 2025 and ranges from 0 (extreme fear, buy signal) to 10 (extreme greed, sell signal), with >8.0 as “sell” territory and <2.0 as “buy.” I see this as a longer-term indicator.
Current reading: 9.7 an extreme bullish signal, and typically a contrarian “sell” signal.
📌 My take:
No significant change in the sentiment picture last week, with volatility remaining low and the CNN Fear & Greed Index stable in Greed territory. Sentiment is positive, but not yet showing signs of overheating.
It will be a relatively light week for economic data, with the main focus on the FOMC meeting minutes from the Fed’s July meeting. Given the growing divisions within the central bank, markets will be looking closely for more details on the debate around inflation and the future path of interest rates.
Key reports:
S&P Global Manufacturing PMI (Aug): Previous: 53.9
S&P Global Services PMI (Aug): Previous: 54.6
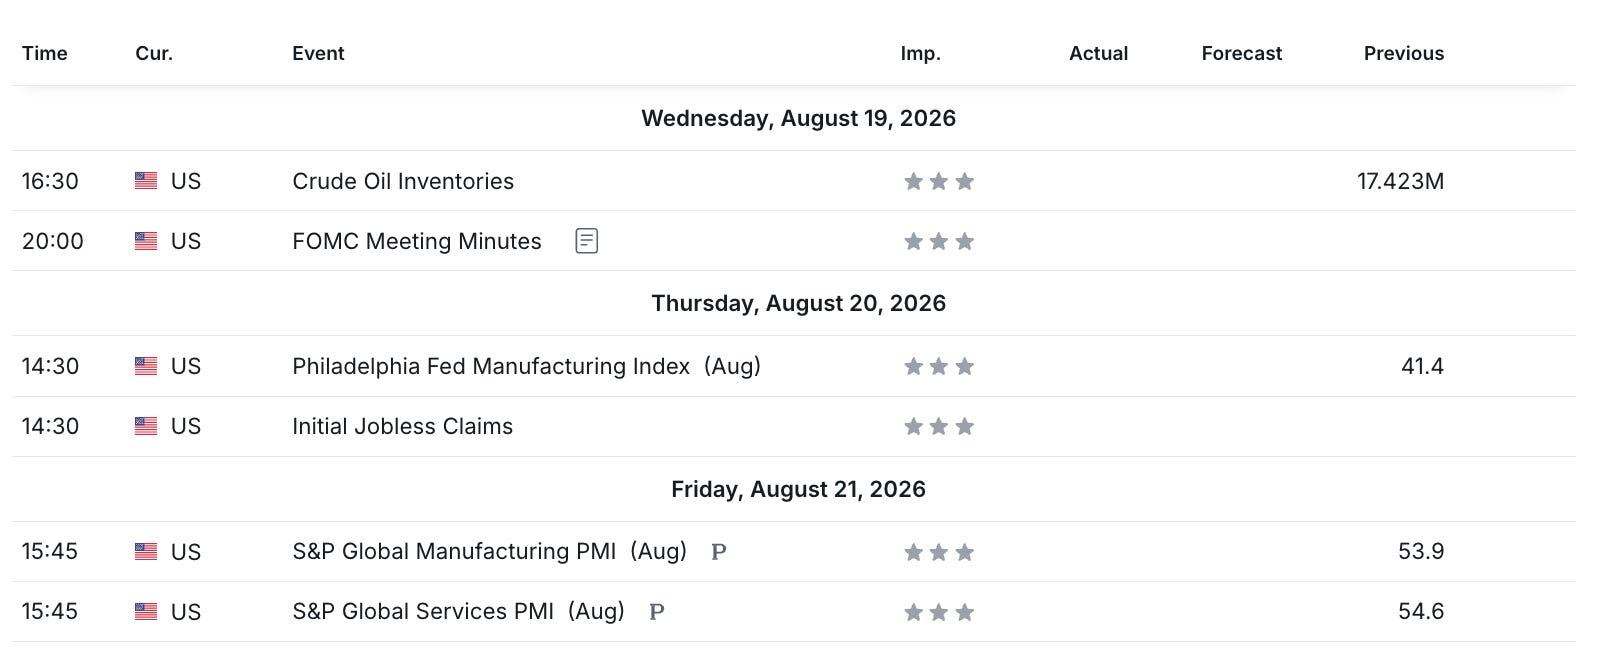
The earnings season continues next week, with 10 S&P 500 companies set to report their quarterly results.
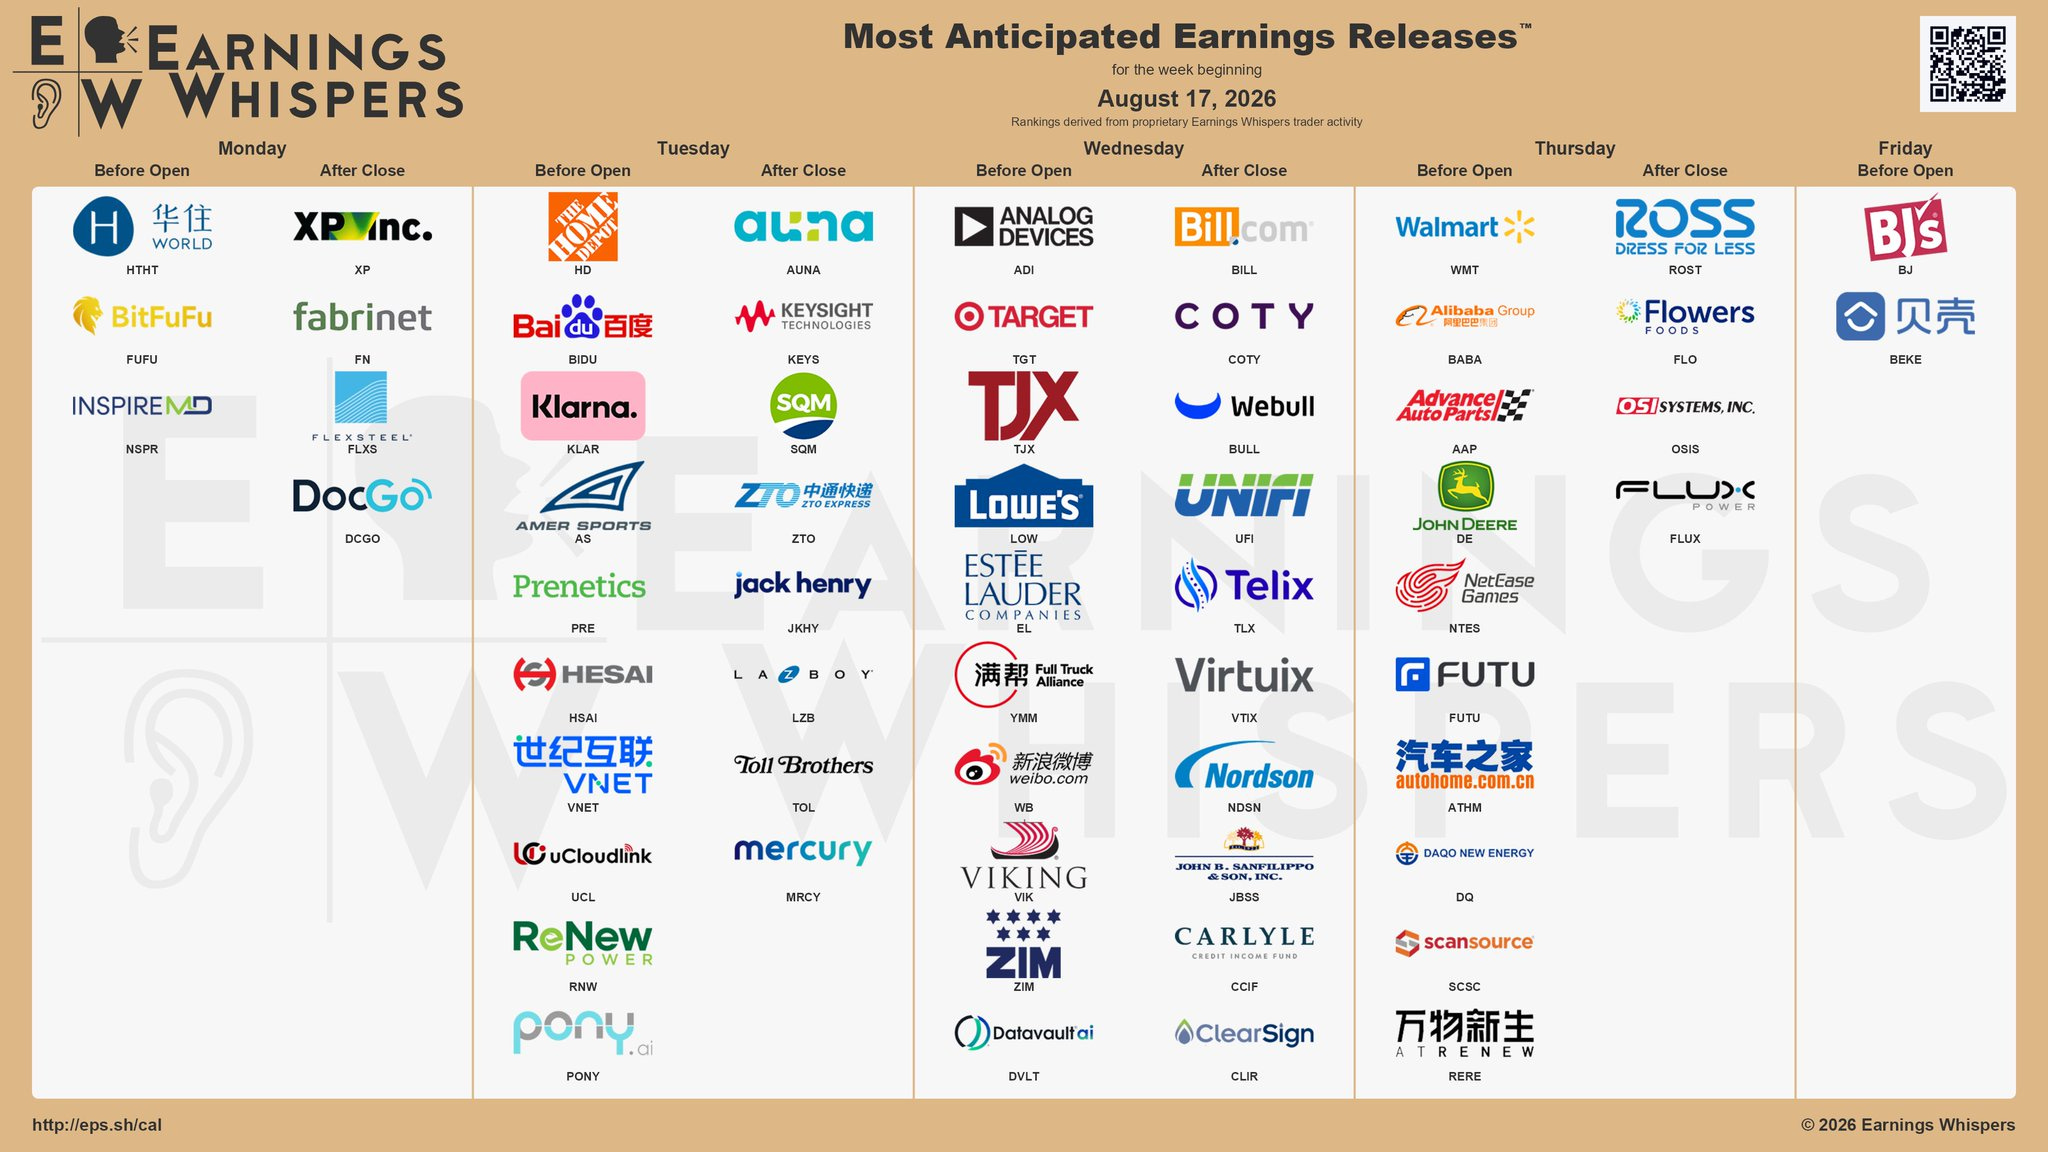
Below are notable stocks reporting earnings next week, along with my Momentum Pulse Check snapshot and implied volatility for the upcoming week.
In particular, I will keep a close eye on Walmart ($WMT). The report will provide a read on the health of the US consumer segment and signal whether demand remains resilient. Market is pricing a 5% move next week.
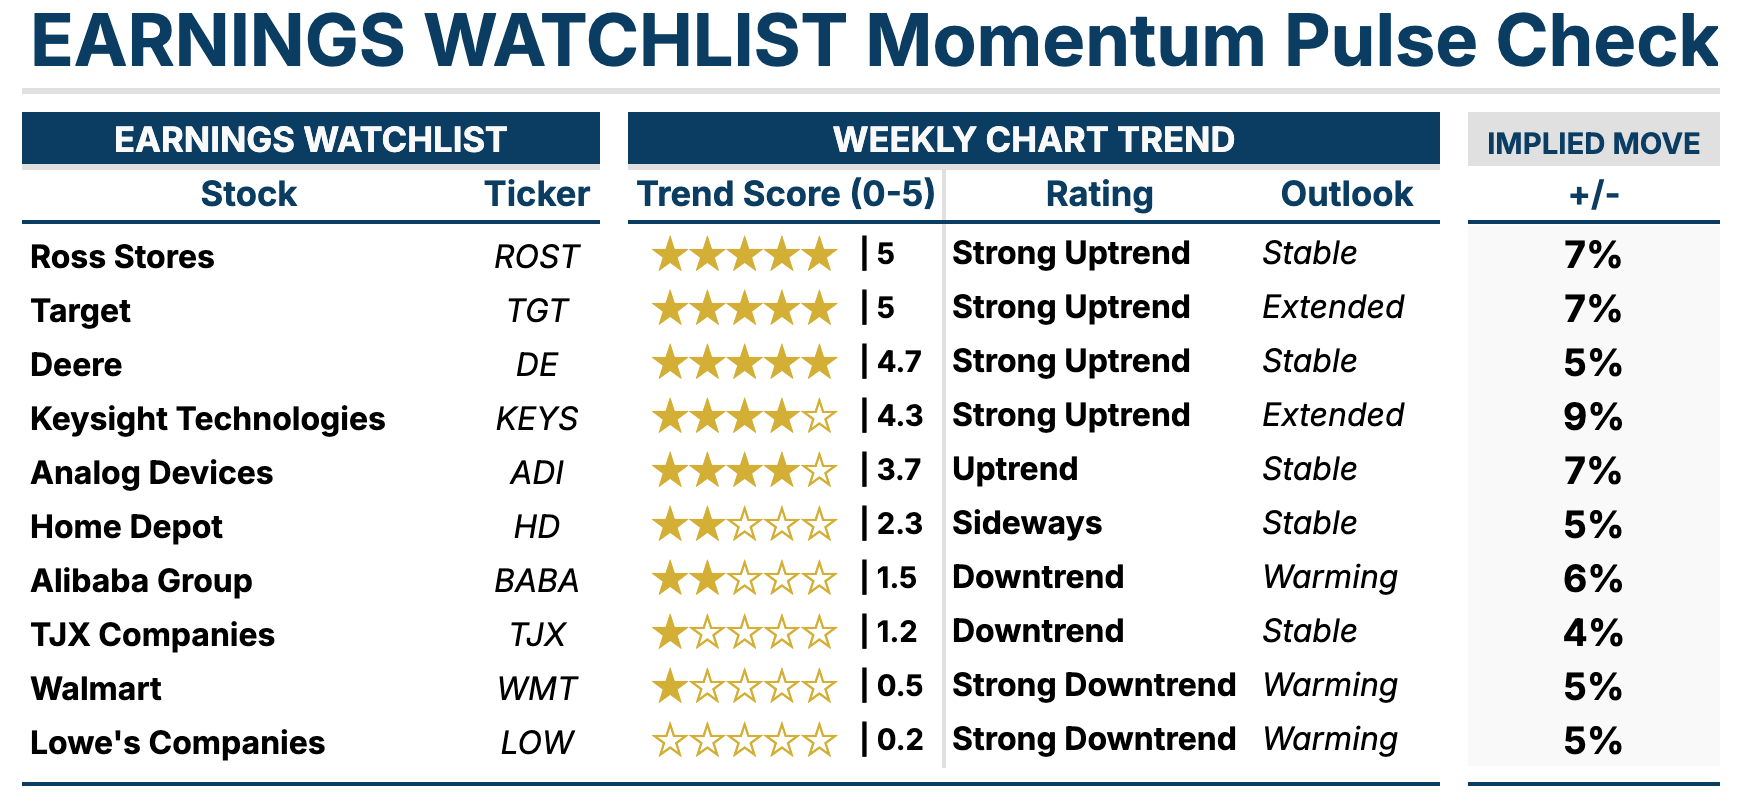
📌 My take:
FOMC meeting minutes and Retail sector earnings will set the tone for the week ahead, especially as markets continue to assess the likelihood of a potential rate hike in the coming months.
Each week, I highlight another Substack publication that offers valuable insights, fresh perspectives, or a helpful approach. This week, I’m pleased to feature Investors' Wisdom
Investors’ Wisdom curates timeless insights on investing, psychology, and philosophy from influential investors, thinkers, books, and blogs, focused on helping readers think and invest more wisely.
Here is the link to one of his post:
That’s a wrap for this recap! I spend hours every week structuring this recap so you can quickly find the insights you need, week after week.
You enjoyed this recap and want the actionable side? Paid subscribers get access to my weekly Momentum Picks, with more than 1,000% return since 2019, or 30% per year.
Happy investing,
My Weekly Stock,
DISCLAIMER
The information provided in this newsletter is for informational purposes only and should not be taken as financial advice. Any investments or decisions made based on the information provided in this newsletter are the reader's sole responsibility. I strongly recommend that readers conduct their own research and consult a qualified financial professional before making investment decisions. I do not assume any responsibility for any losses or damages arising from using the information provided in this newsletter.
No posts
Comments
Nothing yet. Say the first thing.
Sign in to join the conversation.