
Earlier this month, Nebius reported its Q2 2026 results.
Shares jumped 34% that day after management disclosed important new details around the unit economics of its recently signed contracts.
Those disclosures materially changed how some investors think about the earnings potential of Nebius’ growing infrastructure base, forcing many analysts to revisit their assumptions and update their models.
It’s time for me to do the same.
As promised, here’s my updated valuation model for Nebius Group (NBIS).
For context, my last update was published at the end of May, when the stock was trading at $226.34. At the time, my model implied a YE2026 valuation of $194.70 in the bear case, $272.92 in the base case, and $362.10 in the bull case.
Now that we’re getting closer to year-end and have significantly more visibility into 2027, this updated model shifts the focus forward and aims to establish a range of potential values for NBIS by YE2027.
Before diving in, I want to be clear that Nebius is a very difficult company to value.
The core AI cloud business is still young, the long-term economics of the sector remain unproven, and several non-core assets are private companies that require a meaningful degree of subjectivity to value.
So, as usual, this article isn’t a precise forecast or price target. It’s simply how I personally look at the business based on the information available today and the assumptions I consider reasonable.
My previous models for the company have worked well so far, but that may have been good analysis, good timing, luck, or some combination of the three.
For additional context on some of the variables, please refer to my previous valuation models. This is the latest update, but it builds on several earlier versions where I explained parts of the framework in more detail.
Capacity remains the binding constraint on this business, so that’s where I’ll start.
Q2 2026 closed with ARR at $3B, up 598% YoY and 56% QoQ, and management reiterated the $7-9B YE2026 ARR target along with the 800MW-1GW of connected power. What was raised, once again, was contracted power. The YE2026 target went from over 4GW to 5GW.
Two pieces of commentary from the call matter more to my model than the headline numbers themselves.
The first came from Andrey, who said the 800MW-1GW of connected power guided for year-end should become fully active during the first half of 2027.
The second is that Nebius now plans to bring more than 1GW of new capacity to market per year starting in 2027, with Dado adding that the company will deploy significantly more capacity in 2027 than in all of 2026.
The pipeline expanded again in Q2, with two additional sites in the UK, one in Estonia, and one in Finland. Construction is underway across the owned US AI factories, and the map now spans Minnesota, Kansas City, Pennsylvania, New Jersey, Missouri, Oklahoma, and Alabama, alongside Iceland, Finland, Estonia, the UK, France, Spain, and Israel.
Beyond the locations already announced, we have strong evidence pointing to several others. This gives me even greater confidence in the company’s diversification strategy and its ability to mitigate the impact of potential delays at any single site.
On the hardware side, Nebius has already received its first NVIDIA Vera Rubin NVL72 systems and is validating them as a full stack. Deployment is expected to start late this year or early next and continue throughout 2027.
So far, so good. The part that requires more thought this quarter is probably the regulatory and political backdrop, which moved in three directions at once.
Vineland
Let’s start with the good news, because it’s the item that generated most of the FUD of the past few weeks and it has now largely resolved. The planning board approved the site plan, and management confirmed on the call that construction remains on track, that all required Microsoft tranches have been delivered to date, and that the switch to Bloom isn’t expected to have any significant impact on the project timeline.
I want to be clear about what this does and doesn’t do to my model: nothing. I’ve always viewed that concern as overblown, so I never modeled a delay at Vineland in the first place. So this is basically a risk coming out of the narrative rather than one being added back into the numbers. I’d rather say that plainly than quietly bank it as an upgrade.
Pennsylvania
Recently, Governor Shapiro signed an executive order setting new conditions on data center development in the state. Developers now have to make legally binding commitments, enforced through a consent order with the DEP, to pay the full cost of the new generation, transmission, and distribution their project requires without shifting those costs onto Pennsylvania households and businesses, to run transparent community engagement, to hire and train local workers and enter community benefit agreements, and to meet strict water conservation standards. The order also pulls AI data centers out of the state’s fast-track permitting program and prohibits the NDAs that have become standard practice in this industry.
Now go and read the public project page Nebius published for its Highridge Business Park campus in Butler Township, Schuylkill County, and compare it line by line against what the order demands.
On paying for power, Nebius signed a dedicated Energy Service Agreement with PPL Electric Utilities covering the engineering and construction of new energy infrastructure built exclusively for the campus, with the company bearing the full cost of electricity and no rate increases passed to local residents. On water, the facility runs air-cooled and closed-loop systems that recycle on-site. On community benefit, there are commitments to K-12 STEM and AI literacy programs, partnerships with the Schuylkill Technology Center and local community colleges, and local workforce recruitment and training. On environmental standards, sound at the property line is capped at 75 dBA under the township’s Data Center Overlay District, with DEP and local air quality compliance. And the entire thing is sitting on a public webpage with the phasing, the acreage, and the power arrangement all disclosed, which is roughly the opposite of the NDA practice the order bans.
That page went up before the executive order even existed.
This is the point I’d make about the order generally: the GRID requirements describe how Nebius was already building. I don’t read this as an order aimed at projects like this one.
Phases 1 and 2 of the project, roughly 600MW, are already zoned. But zoning isn’t the same as fully permitted, and removing AI data centers from the state’s fast-track program could still add time to the development timeline, regardless of the project’s merits.
That said, Nebius’ own published schedule for the site is 260MW by October 2027, 660MW by January 2029, and over 1GW by November 2029. Schuylkill County is therefore primarily a 2028-2029 story. Even if permitting were delayed, which I view as unlikely, any impact would largely show up in those years.
Alabama
Two Oxmoor Valley homeowners sued in May over the project’s zoning approvals. In July, Judge Javan Patton Crayton rejected the argument that they should have gone through the Zoning Board of Adjustment first and allowed the case to proceed, finding that it presents a legal question for the court. The case is now set for a non-jury trial on March 8, 2027.
Construction is continuing with some small restrictions: work can’t begin before 8 AM on weekdays or 9 AM on Saturdays. Also, the preliminary injunction question wasn’t denied on its merits. It was set aside in favor of going straight to the question of whether the project should be stopped permanently. Nebius keeps building, but nothing has been decided in the company’s favor yet.
There are two further actions. One is a resident class action. The other, filed on July 10 by the Greater Birmingham Humane Society, is the one I’d pay the most attention to. GBHS is seeking judicial review of whether the approvals and permits complied with Alabama law and Birmingham’s zoning ordinances, and it’s asking for declaratory and injunctive relief. That’s the same permit-validity theory the homeowners are running, brought by an institution that has spent close to a decade planning its own new campus on the adjacent parcel and that has organized community backing behind it.
Simply put, the serious claim running through all of this is that Birmingham issued the permits illegally because “data center” wasn’t a listed use in the zoning ordinance at the time, together with a challenge to the validity of the June 2026 amendment that added it.
On the nuisance claims, though, go and read the project page for the Oxmoor site, because once again the defense was built into the design long before anyone filed anything. Cooling is closed-loop with continuous on-site recycling, no evaporation, no sewer discharge, and estimated water consumption of roughly 25% of what the former Regions Bank building on the same site used. An independent acoustic study concluded operations won’t exceed existing background noise levels, and the design adds sound walls, low-noise equipment, and tree buffers on top of that. Nebius is funding a new switching substation through Alabama Power, which confirmed the load can be met without reliability issues or rate increases. There’s a Community Engagement Panel, STEM programming, and trade apprenticeship sponsorships.
And importantly, the economic stakes are meaningful. The project is expected to generate roughly $85.7M a year in tax revenue across the city, county, and state, with about $48M going to schools. That gives the relevant local institutions a substantial financial interest in the project moving forward.
The published schedule has the initial phase commissioning in Q4 2026 with full build-out running through 2028. So the part of Birmingham that feeds my 2027 number (100MW) will have been operating for months by the time the case is heard.
I think the probability of a negative outcome is low. The city amended its ordinance in June 2026, courts are generally reluctant to unwind completed, permitted construction, and remedies in cases like this tend to involve conditions or financial compensation rather than demolition.
That said, it remains a risk worth monitoring, not so much for the initial 100MW, but for the additional 200MW expected to be deployed in 2028.
Net effect:
I’m keeping my range where it was: 1.6-2GW of active power by YE2027, with 1.8GW as the base case.
Based on everything management has communicated so far, I still view that as a very realistic assumption.
As I’ve explained before, I’m confident Nebius can work through any legal or permitting issues tied to its U.S. locations. And even if those challenges prove more difficult than I expect, the company’s diversification strategy, with dozens of potential sites in the pipeline, gives it meaningful flexibility to offset delays by temporarily shifting focus elsewhere.
What this range doesn’t include
After announcing the asset-light model, Nebius said it received dozens of inquiries from potential partners who have significant capacity and enough capital, but don’t know how to build and how to sell. Arkady’s framing was that GPUs are becoming an investable asset class, so more capital wants exposure to this market than there is operating capability to deploy it, and Nebius can rent out exactly that capability. Management called the model early stage but said they are very much encouraged by the early signs and, importantly for this section, that it has the potential to unlock new capacity in 2027 and beyond on top of the company’s own portfolio.
Every number in this section describes capacity Nebius owns or leases itself: the 5GW contracted, the 800MW-1GW connected, my 1.6-2GW of active power. Asset-light capacity would sit outside all of it, on MW that somebody else paid for and Nebius operates and monetizes.
I’m not putting any of it in the model, for two reasons. First, there are no disclosed economics yet. Second, the revenue per MW would look nothing like the rate I use below for owned capacity, because Nebius would be earning a fee on someone else’s asset rather than capturing the full contract value. Lower revenue per MW, better margin profile, but no reasonable basis for me to guess at either number today.
So read my range as capacity Nebius builds itself. Whatever the asset-light model contributes sits on top of it.
ACV
This is where the genuine change in the story sits, and it’s the main reason I’m writing this update now rather than waiting for 2027 guidance.
Management formalized how it thinks about the contract mix this quarter, splitting the book into three types that serve different purposes. That split is what makes the pricing data usable, because each type carries very different economics.
Long-term contracts with investment-grade customers, meaning Microsoft and Meta, exist primarily to finance the buildout faster and more efficiently rather than to maximize price. This is the capacity priced at ~$12M per MW.
Mid-term contracts, one to three years, signed with the world’s most ambitious AI companies, are the core AI cloud business. This is where the four landmark Q2 deals sit: Reflection, Cohere, another unnamed US-based neolab pursuing frontier model development, and a large US-based quantitative trading firm. Average total contract value across the four was more than $1B each, at annual contract values of $20-25M per MW.
Shorter-duration contracts, typically three to six months, serve customers with an acute, time-bound need. Think of a time-boxed large-scale training run ahead of a model release, or a reinforcement learning post-training sprint. These carry a significant premium, with Nebius seeing the opportunity in the $40-50M+ per MW range, and the first one was signed in Q3.
That’s the single most important fact in this update.
Then there’s the auction pilot. Marc framed it as pure price discovery, and the result was a price 15% higher than anything Nebius had ever seen and 20% above its own pipeline for Blackwells. The winning bidder said it plans to participate in future rounds. Management was careful to note this involves a small portion of overall capacity and that the business remains take-or-pay, but as a piece of real-time market evidence it’s about as direct as it gets: Nebius has been underpricing its capacity.
All of which culminates in a statement I keep coming back to. According to management, Nebius could sell its entire 2027 capacity today at $20-25M per MW with upfront payments covering 50-60% of the associated CapEx, and is deliberately choosing not to because it expects to capture more value by holding inventory back for shorter-term needs. Dado said the Q2 deals coming online from late Q4 onwards can serve as the pricing baseline for early next year.
Net effect:
I’ve used $10M of ARR per MW of active power in every model I’ve published. I chose that number as a deliberate haircut to a $12M per MW base because I wanted the monetization input to be the one place where I was clearly underwriting below reality.
That input is now the single most conservative assumption in my entire model, and at this point, I no longer think it’s defensible.
So let me rebuild it using the three deal types above.
Assume 40% of active capacity by YE2027 sits in long-term contracts at $12M per MW, 50% in mid-term contracts at $20M, and only 10% in short-duration contracts at $40M. That blends to $18.8M per MW.
I’d argue that mix is already cautious before I touch it, and it even prices every tranche at the bottom of its stated range rather than the middle: $20M when management said $20-25M, and $40M when they said $40-50M+.
Then I’ll apply an additional margin of safety, consistent with the approach I’ve been using. I’m raising my monetization assumption from $10M to $16M per MW in the bear case, $17M in the base case, $18M in the bull case. Against the $18.8M blend, that's a 15% margin of safety in the bear case, 10% in the base, and 4% in the bull.
That’s still well below what the business could generate if pricing remains anywhere close to current levels. Given how young this sector is and how unproven its economics are across a full cycle, I’d rather build in some caution and be positively surprised than make assumptions that prove too optimistic.
Margins
In my last update, I moved the EBIT margin assumption back down from 25% to 20%, the low end of management’s 20-30% medium-term guidance, mostly out of caution around the Bloom OpEx shift and component cost inflation building into 2027.
The case for going back to 25%
A common bear argument is that higher contract values simply reflect more expensive hardware, leaving the underlying economics unchanged. That’s not the case. The $20-25M per MW deals signed in Q2 are still largely tied to Blackwell capacity, while the $40-50M per MW contracts likely correspond to Vera Rubin systems.
That explains why the payback period on Q2 deals compressed to one year and ten months from the historical two-to-three-year range. Prices are rising against a capital cost that didn’t move with it, which is the cleanest ROI lever that exists in this business.
Add the mix shift on top. Token Factory production inference workloads more than tripled in Q2, and the asset-light model generates software-like revenue without carrying infrastructure on the balance sheet. Neither is priced like renting GPUs.
The case for staying at 20%
Three things hold me back.
The first is the closest thing we have to a real-world benchmark. CoreWeave guided to FY2026 revenue of $12.4-13.2B against adj. EBIT of $960M-1.15B, roughly an 8% margin, reaching low teens by Q4 at close to $5B of quarterly revenue. That’s a revenue scale Nebius probably doesn’t reach until late 2027/early 2028. CoreWeave leases all of its data centers rather than owning a portion of them, and it has less exposure to the current GPU repricing. Over the long term, that should support higher margins for Nebius. But putting myself at 25% means assuming roughly double the margin of the largest and most mature operator in this industry at comparable scale, and as you know, I usually prefer to stay conservative. In fairness, low teens is likely just a point on a steeply rising curve rather than a terminal margin, which is exactly why I’m not going below 20% either.
The second is Bloom. We got further indication this quarter that the fuel cell arrangement might be used across more data centers, not just Vineland. Every time that happens, part of the power equation moves out of an owned-asset model based on CapEx and depreciation and into a recurring service fee that sits in operating costs. That’s a fair trade for speed and flexibility, but it still lowers the margin on the sites where it’s used.
The third connects back to the section above. I argued there that permitting friction and litigation shouldn’t move my capacity estimate, because Nebius can absorb a delay at an owned US site through regional flexibility and additional colocation. I still believe that. But it’s worth being clear about what absorbing a delay that way actually costs. Colocation is leased capacity, so the hedge that protects the top line is the same one that pressures the margin line.
The offsets I flagged in May also haven’t gone away. Component and memory cost inflation still builds into 2027 as more of the buildout is exposed to current pricing.
Net effect:
I’m keeping my 20% EBIT margin assumption unchanged.
And again, if I’m wrong, I’d rather be wrong because the underlying economics turn out better than expected.
Prepayments (during the quarter)
Prepayments hit an all-time high, with roughly 70% of closed deals including upfront payments covering 50-60% of the associated CapEx, and management said it intends to push that share higher. Deferred revenue on the balance sheet reached roughly $6B, up from about $4.8B at the end of Q1, and management expects customer prepayments to bring in more than $9B of upfront funding across 2026. This remains the best possible way to fund this kind of growth, as it requires neither debt nor equity.
The ATM (through June 30)
The ATM was finally touched. Nebius sold 12.7M Class A shares at a weighted-average price of $223.6, generating roughly $2.8B of gross proceeds, with 12.3M shares still available under the program.
I’ve said for a long time that using it was inevitable in an industry this capital intensive, and every model I’ve published has assumed the full program eventually gets used. They also did it from a position of strength, at a price well above where the stock traded for most of this year.
The asset-backed facility (July)
The $775M facility closed at SOFR + 250bps, a mid-single-digit all-in rate, secured against deployed GPU infrastructure and contracted cash flows from an investment-grade customer.
This is the one I’d pay the most attention to strategically. The shareholders’ letter explicitly called it a repeatable framework, and with more than $40B of committed backlog to borrow against, I expect a great deal more of it. When Dado was asked whether volatile debt markets change the funding calculus, her answer was that this facility demonstrated the opposite: even in a choppier market there’s strong demand to finance contracted cash flows on attractive terms.
Corporate-level debt, of which Nebius has almost none today, remains an entirely untapped pool on top of that.
The $5.75B convertible offering (August)
Then, after Q2 results, Nebius priced an upsized private offering of convertible senior notes, raised from $4.5B to $5B at pricing and then closed at $5.75B with the initial purchasers exercising their option in full. It's split into $3.45B of 2030 notes carrying a 0.5% coupon and $2.3B of 2034 notes carrying a 4.5% coupon. Net proceeds are roughly $5.68B.
The 2030 notes convert at $313.46 per share, a 40% premium to the $223.90 reference price, and the 2034 notes at $324.65, a 45% premium. If every note converts, that's 18.1M new Class A shares. Against 271.9M outstanding, 6.7% dilution.
The amount owed accretes on a fixed schedule: every $1,000 borrowed becomes $1,100 on the 2030s and $1,250 on the 2034s. So $5.75B borrowed becomes roughly $6.67B owed at maturity. But interest is calculated only on the original principal, meaning annual cash interest is just $121M. The accretion still flows through interest expense as a non-cash charge, so reported interest expense from the deal will be roughly $295M a year while only $121M actually leaves the bank.
Important: the accretion is only paid if the notes are repaid in cash. If holders convert, they give it up. That pushes the effective breakeven conversion price at maturity to ~$345 for the 2030s and ~$406 for the 2034s.
Separately, $800M of the 2029 and 2031 notes (issued back in June 2025) were exchanged for ~15.8M shares. Those notes convert at $51.45, so they stopped being debt long ago and have been sitting in the diluted count for a year. At that conversion rate, $800M was always going to become ~15.5M shares. The cost is the gap, roughly 250k shares, or about $56M, in return for holders giving up the paper years early. For that, Nebius kills $20M a year of coupons, kills the accretion drag running through interest expense, and removes the tail risk of that principal ever coming due in cash. That’s a good trade.
Dilution has never been the open question here. The real question is how that capital gets deployed. It’s fair to say the latest earnings only reinforced the continued improvement in unit economics. Overall, I’m happy with the terms.
On another note, I believe management is deliberately holding off on taking on significant debt for as long as possible, particularly after seeing how aggressively the market has punished more leveraged names such as Oracle and CoreWeave. Nebius will almost certainly raise tens of billions through a combination of asset-backed financing and corporate debt over time, but with all of 2026 CapEx now funded, there’s little urgency to do so today.
If that read is correct, the objective goes beyond simply supporting the stock price just for the sake of it. A higher share price reduces dilution when raising the same amount of capital and can improve the economics of convertible debt. At the same time, keeping leverage low for longer should help Nebius reach a healthier bottom line sooner, potentially strengthening its credit profile and lowering future borrowing costs.
Ultimately, the goal should be to strike the right balance between prepayments, debt, and equity-linked financing. So far, the market appears to be rewarding Nebius for taking a more measured approach to capital structure, particularly when compared with CRWV’s recent price action.
Let’s do the share count math.
Nebius ended June with 271.9M shares outstanding. That’s up from 253.9M QoQ, reflecting the ATM usage and shares issued in the acquisitions.
On top of that base sit the transactions already announced: roughly 15.8M shares from the note exchange, roughly 18.1M underlying the new converts, and the 12.3M still available under the ATM.
Add it up and you get roughly 318M shares, before accounting for the older convertible notes still outstanding.
Net effect:
In every model I’ve published so far, I’ve handled the capital intensity of this business with a single crude lever: an adjusted share count well above the real one. In May that meant 349.2M against 253.9M actually outstanding. The logic was that the buildout has to be paid for somehow, and if I inflate the share count enough, I’ve accounted for it in a simple way.
That was always a proxy rather than an analysis. It charges the entire funding requirement to equity holders as dilution, when in reality most of it is funded by customers and lenders. It was a tolerable simplification while Nebius sat close to net cash and had almost nothing on the balance sheet.
That’s changed. Debt has become a real instrument for the company, and a model that only has a dilution lever can’t see it.
So I’m splitting this into two explicit lines.
First, a share count that reflects what I actually expect to be issued rather than a buffer standing in for everything. Starting from the roughly 318M above, I’ll add an allowance for the older convertible notes still outstanding, in the high teens of millions of shares, plus a modest buffer for issuance beyond the current ATM. That puts me around 350M, so I’m simply keeping the 349.2M I used in May.
In May, I used 349.2M against 253.9M actually outstanding, and plenty of people thought that was excessive. Since then, Nebius has tapped the ATM for the first time, issued 15.8M shares in the note exchange, and placed another $5.75B of convertibles. All of that dilution was already captured in the share count I published three months ago. That’s the point of being conservative upfront: when the dilution actually happens, the model doesn’t need to move.
Second, a net debt deduction.
The multiple I apply in the valuation section is an enterprise value multiple. When I benchmark against CoreWeave at roughly 23x forward EV/EBIT, that figure already accounts for the debt on CoreWeave’s balance sheet. Applying a multiple to Nebius’ EBIT gives me an enterprise value as well, not an equity value, and getting from one to the other means subtracting net debt.
This year’s spending is already covered. 2027 is the open question, and we don’t have CapEx guidance yet. For simplicity, I’ll assume $40B of net debt by the end of 2027.
$40B of net debt, plus the operating cash flow that prepayments keep generating ($9B this year alone, so I’m expecting even more in 2027), plus the ATM and buffer issuance already sitting in my share count, covers a 2027 CapEx program well north of $50B.
So: 349.2M shares and $40B of net debt.
If anything, this change makes the model more conservative, not less.
In my last update, I assumed 1.6-2GW of active power by YE2027, and as explained in the capacity section, I’m keeping that range unchanged, with 1.8GW as the base case.
On monetization, I’m using $16M of ARR per MW in the bear case, $17M in the base case, and $18M in the bull case, for the reasons laid out above.
Under those assumptions, ARR at YE2027 would be $25.6-36B, with $30.6B as the base case.
If Nebius stopped deploying new capacity in 2028, that ARR range would roughly be its revenue range. I don’t think that will happen, so as in my previous models, I’ll apply a conservative 10% uplift to each scenario to account for continued deployment. That brings the 2028 revenue range to roughly $28.2-39.6B.
That uplift is far more conservative than it was three months ago. Management now plans to bring more than 1GW of new capacity to market every single year starting in 2027. That said, I’d rather stay conservative and keep the same convention I’ve used in every model.
On profitability, as explained in the Margins section, I’m staying at 20%, the low end of management’s 20-30% medium-term EBIT guidance.
On the multiple, I’m keeping the 20-30x Fwd EBIT range I’ve used since November.
Beyond the arguments I’ve already laid out before, a market anchor is ultimately more useful than relying on my reasoning alone. Consider CoreWeave: even after falling more than 50% from its highs, it currently trades at ~23x Fwd EV/EBIT.
The obvious counterargument is fair, and I’d rather address it directly.
Every scenario here assumes a relatively stable market backdrop. If the broader AI trade undergoes a meaningful multiple compression, all three valuation cases would compress with it, and strong execution alone wouldn’t offset that. More importantly, such a re-rating would likely reflect deteriorating economics across the AI ecosystem, which could also put pressure on several of the operating assumptions underpinning this model.
That risk falls outside the scope of the valuation range I’m presenting here, but I’ll revisit it at the end.
One structural note before the numbers. In my previous models, I applied a 15% discount rate to bring the YE2027 value back to a YE2026 present value. Because this model measures YE2027 directly, there’s no discounting step.
Applying all of the above, here’s the core business range at YE2027:
Bear Case: $28.2B revenue × 20% EBIT margin × 20x Fwd EBIT multiple → $112.6B
Base Case: $33.7B revenue × 20% EBIT margin × 25x Fwd EBIT multiple → $168.3B
Bull Case: $39.6B revenue × 20% EBIT margin × 30x Fwd EBIT multiple → $237.6B
I’m keeping every assumption in this section exactly where it was in May. The operational progress across all four units has been good, but none of it changes the exit valuations or the stakes I was already using, and I’d rather not adjust private-company assumptions quarter to quarter on the basis of news flow.
There’s one structural change, and it’s the same one from the core business section. I assume these exit events happen in early 2028. In my previous models I discounted those values back to YE2026’s present value. Because this model measures YE2027, the exits now land closer to the valuation date, so the figures below are undiscounted. That accounts for the difference vs. the numbers in my last update, but it isn’t a change in how I value any of these businesses.
As always, I explained the reasoning behind each assumption in more detail in my previous valuation updates, with most of the ranges based on comparable companies.
Avride
Valuing Avride remains inherently difficult given its dual focus on autonomous ride-hailing and delivery robotics, and the early stage of its monetization.
The operational momentum continues to be strong.
The AV-capable fleet has nearly tripled since YE2025, passing 200 vehicles in May, with more than one million autonomous miles completed this year. Avride has now completed over 100,000 commercial rides on Uber in Dallas, and the Dallas operating map has doubled since launch.
Robot deliveries more than tripled YoY and have exceeded 600,000 since inception, with Q2 launches in Arlington, Virginia and Miami through UberEats. In July, Avride signed a master services agreement with Chartwells Higher Education, one of the largest on-campus food service providers in the US, and momentum with vendor partners has picked up following a competitor’s exit from campus deliveries.
By September, the company expects to have more than 1,000 active delivery robots operating across 25+ campuses, with a potential reach of more than 610,000 students. That would represent roughly 4.5x its previous campus footprint. Avride has already launched on 10 additional campuses this semester, with another 11 expected to go live by the end of September.
Still, I’m keeping my assumptions unchanged: Avride reaches an exit event in early 2028 at a $10-20B valuation, with Nebius’ stake diluted to 30%.
Bear Case: $10B valuation × 30% stake → $3.0B
Base Case: $15B valuation × 30% stake → $4.5B
Bull Case: $20B valuation × 30% stake → $6.0B
TripleTen
TripleTen remains the least valuable of Nebius’ non-core businesses from a near-term valuation perspective, with a practically negligible impact today.
Consistent with keeping non-core assumptions unchanged, I’m holding my prior range.
Bear Case: $75M
Base Case: $120M
Bull Case: $170M
Toloka
Toloka is Nebius’ AI data solutions business, now held as a non-controlling stake following the strategic investment round led by Bezos Expeditions.
Operational momentum remains healthy, but the business is likely still relatively small in absolute revenue terms, and there’s nothing new that justifies raising my outlook. I’m therefore keeping my assumptions unchanged: an exit by early 2028 at a $5-10B valuation, with Nebius’ stake diluted to 20%.
Bear Case: $5B valuation × 20% stake → $1.0B
Base Case: $7.5B valuation × 20% stake → $1.5B
Bull Case: $10B valuation × 20% stake → $2.0B
ClickHouse
ClickHouse remains the most promising non-core asset in the portfolio, and it’s the one where I’m most confident my assumptions are conservative.
Nothing formally changed this quarter. The shareholders’ letter reiterated the January 2026 $400M Series D at a ~$15B valuation, with Nebius continuing to own a significant minority stake, last updated at around 25%.
But the trajectory here is hard to ignore. ClickHouse continues to look like a category leader in modern data infrastructure, taking share from Snowflake, Databricks and Elastic, with a customer base that includes Anthropic, OpenAI, Microsoft, Meta, Tesla, Netflix and thousands of other enterprises. It recently reached $350M in ARR and expects to close the year in the $700-900M range. That’s not the growth profile of a company that should remain valued at $15B for long, particularly given that it’s widely regarded as one of the hottest AI startups in the market.
At the Nebius Inflection event in June, I spoke with a few industry participants about ClickHouse, and the consensus was strikingly uniform: this is a beast in the making.
So my honest view is that ClickHouse ultimately ends up being worth considerably more than what I’m carrying in the model, and I wouldn’t be surprised to see it raise again at a $25B+ valuation before year-end.
That said, my exit assumption remains $25-35B by early 2028.
Bear Case: $25B valuation × 15% stake → $3.75B
Base Case: $30B valuation × 15% stake → $4.5B
Bull Case: $35B valuation × 15% stake → $5.25B
Total Non-Core Business Units
As I always stress, valuing Nebius’ non-core assets involves a high degree of subjectivity, which is exactly why I use a multi-scenario approach. Here’s the combined range for the four units at YE2027.
Bear Case: $3.00B + $0.08B + $1.00B + $3.75B → $7.83B
Base Case: $4.50B + $0.12B + $1.50B + $4.50B → $10.62B
Bull Case: $6.00B + $0.17B + $2.00B + $5.25B → $13.42B
The total non-core range is therefore $7.83B to $13.42B, with $10.62B as the base case. Every input behind those figures is identical to my last model. The increase vs. what I published in May is entirely the removal of the discounting step, not a revaluation of anything.
In my view, this range remains reasonable and may even prove conservative if ClickHouse continues executing at its current pace.
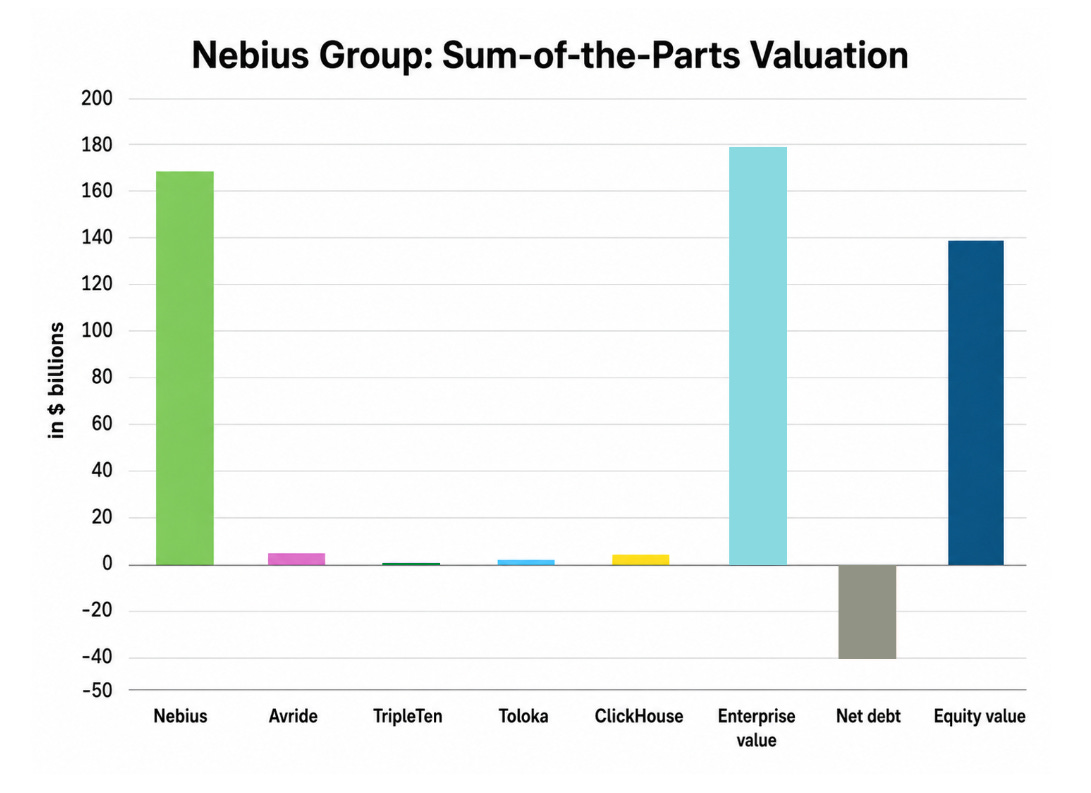
Summing everything up, the updated model gives an enterprise value range between $120.4B and $251.0B, with $178.9B as the base case, all measured at YE2027. After deducting the $40B of net debt explained in the financing section, that leaves an equity value range of $80.5B to $211.0B, with $138.9B as the base case.
Three things drive the change compared to my previous model.
The first, and by far the most important, is the improvement in contract rates: how many dollars Nebius earns per MW of power. That input went from $10M to $16M, $17M and $18M of ARR per MW across my three scenarios, and it moved because the market repriced compute, not because I changed my view of the company. Everything else in the core business is where I left it in May.
The second works against the first, and it’s the reason the headline number isn’t even higher. I’ve added a $40B net debt deduction that none of my previous models carried, while leaving the share count exactly where it was in May. That means the count is now doing a narrower job than it used to, since it’s no longer being asked to stand in for the debt as well.
The third is the shift in measurement date. This model estimates values for NBIS at YE2027 rather than YE2026, so there’s no longer a discounting step. That mechanically lifts every figure.
Based on all the assumptions outlined throughout the article, here’s the final table showing the potential share-price scenarios for YE2027:
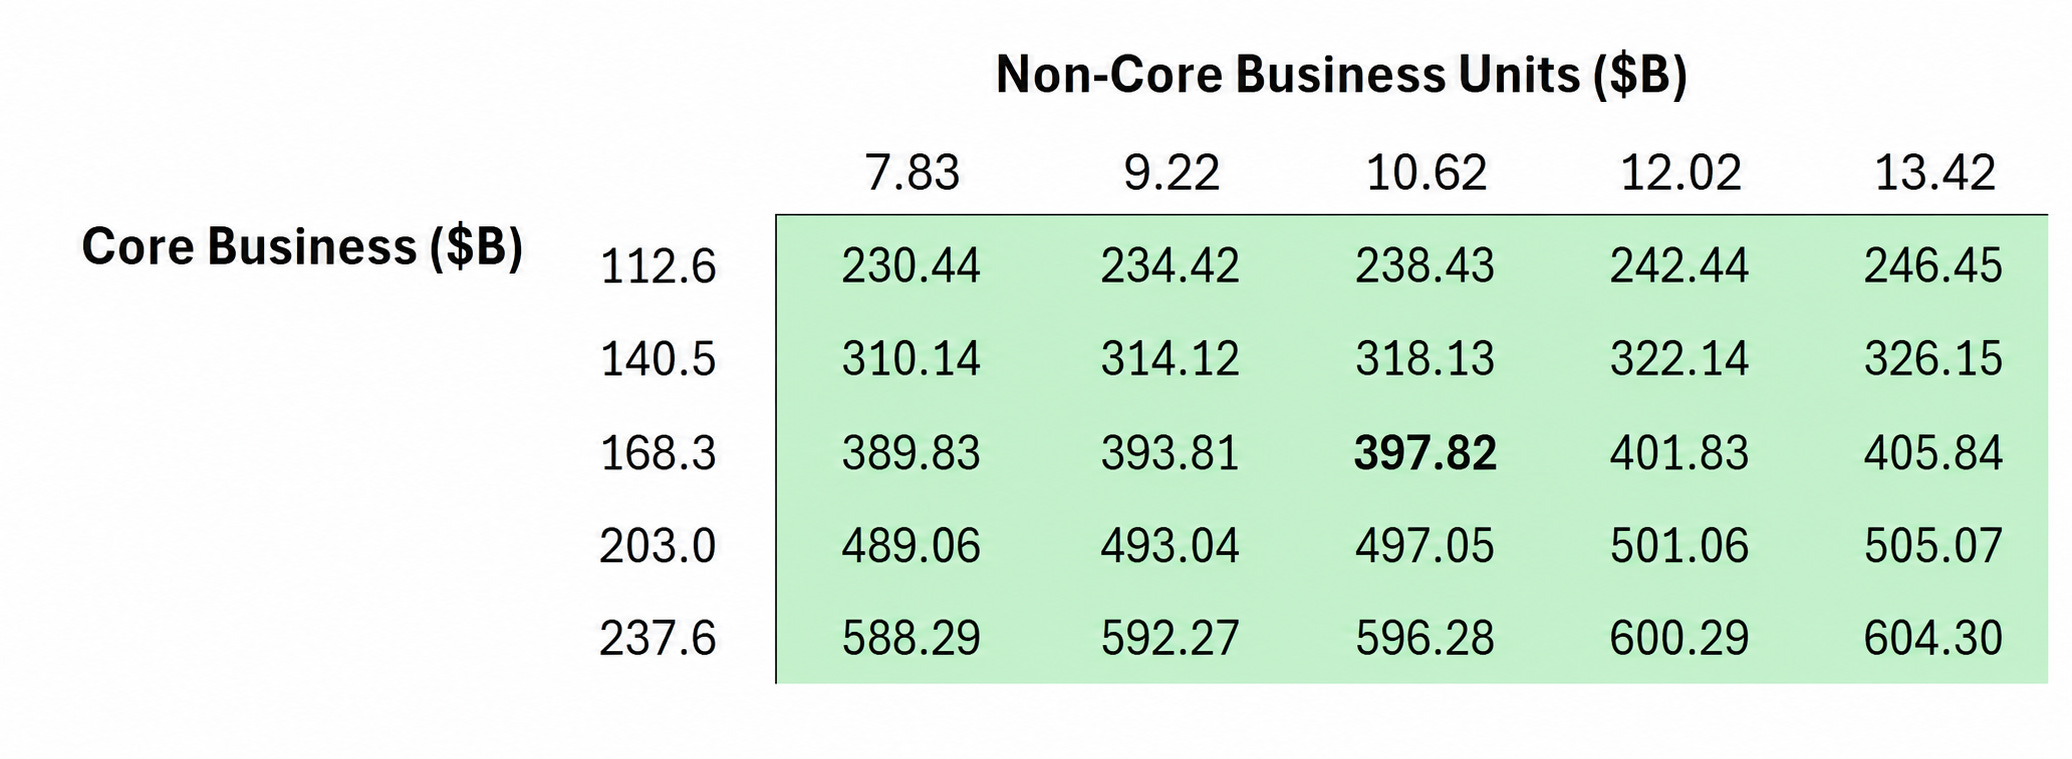
For reference, today’s closing price was $221.97/share.
As you know, I’m probably biased, given that NBIS is by far my largest position. That’s why I prefer to keep the written model relatively conservative and let readers examine the assumptions themselves, evaluate the variables I’ve laid out, and decide which outcomes they believe are most likely.
Two important points worth clarifying.
1) The “bear case” isn’t a floor.
My bear case sits at roughly where the stock trades today, which means this model has almost nothing to say about downside. That’s not because I think there isn’t any.
These three scenarios measure execution outcomes against a relatively stable market backdrop. They flex capacity delivery, contract pricing, the multiple, and the balance sheet. What they don’t flex is the market itself. A genuine bear case for NBIS doesn’t come from Nebius energizing 1.6GW instead of 1.8GW. It comes from a broader disruption in AI compute demand. If that happens, every AI-exposed company would miss expectations and sector-wide valuations would compress sharply at the same time.
So read the range as: if the AI infrastructure cycle holds together, here’s what execution is plausibly worth. As I’ve said since the beginning, this is a high-risk, high-volatility business, and investors need to be prepared for that.
2) It’s still not a price target.
The $397.82 figure isn’t a price target, just as my prior models weren’t. Execution will evolve, new data will emerge, and assumptions will need updating, as I’ve grown used to with this company. It’s simply a benchmark to illustrate that, even under what I consider reasonable inputs, the risk-reward remains compelling, even after my position has appreciated nearly 800%.
The stock is obviously no longer as asymmetric as it was when I first built my position at $25.67/share. That would be impossible after such a strong move. But the company has also de-risked dramatically since then.
In my opinion, the most important takeaway from this model isn’t the exact base case number. It’s that while the stock has already moved a lot, the company’s fundamentals have improved just as significantly.
The next two major catalysts remain the same: formal 2027 guidance, coming later this year, and another large contract.
That’s it. Thanks for reading!
Best regards,
M. V. Cunha
Disclaimer: As of this writing, M. V. Cunha holds a position in Nebius Group (NBIS) at $25.67/share.
Disclaimer: The views expressed in this article are solely my own and are based on my personal research and analysis. This content is for informational purposes only and should not be considered financial, investment, or legal advice. Always conduct your own research before making investment decisions.
No posts
Comments
Nothing yet. Say the first thing.
Sign in to join the conversation.