Converting Sigma Rules to Dynamic Grafana Alerts
This is the fourth article in a series on RSigma. The first article introduced RSigma as a CLI tool for evaluating Sigma rules against JSON logs. The second covered running it as a streaming daemon with HTTP and NATS input, stateful correlation, and persistent state. The third showed how to convert Sigma rules into PostgreSQL SQL and run them as detection queries on TimescaleDB.
Each article added a layer. CLI forensics, then streaming detection, then SQL on stored data. But one question kept coming up: where do the alerts go? You have RSigma detecting threats in real time, correlating individual events into high-confidence attack sequences, but there is no pager going off at 2 AM when the correlation fires. There is no dashboard showing detection trends over the last week. There is no way to search detection history from last month. This article closes that loop.
We will build a complete detection-to-alert pipeline using RSigma and the Grafana LGTM stack. “LGTM” refers to the Grafana observability ecosystem: Loki, Grafana, Tempo, and Mimir. This article uses three of the four: Loki for log storage, Grafana for dashboards and alerting, and Mimir for metrics. We skip Tempo since this pipeline deals with logs and metrics, not traces. Alloy, Grafana’s OpenTelemetry collector, ties everything together.
By the end of this article, a single Okta cross-tenant impersonation sequence will flow from Helr through Alloy into RSigma, trigger a critical correlation, update a Prometheus counter with the rule name and severity, light up a Grafana dashboard, and fire a dynamically-labeled alert that routes to the right channel.
What we are building
The stack has seven components, all open source, all running locally via Docker Compose:
- Helr: polls log sources (Okta, GitHub, custom APIs) and writes NDJSON to stdout. Helr supports recording API responses with --record-dir and replaying them offline with --replay-dir. For this demo, Helr replays pre-recorded Okta audit events every 60 seconds with no live API access required.
- Alloy: reads Helr’s log output, sends events via OTLP to RSigma for detection and to Loki for long-term storage. Also scrapes RSigma’s Prometheus metrics and forwards them to Mimir.
- RSigma: the detection daemon. Evaluates Sigma rules against incoming OTLP log records, maintains correlation state, and exposes per-rule Prometheus metrics.
- Loki: stores raw log events for search and exploration.
- Mimir: stores RSigma’s detection and correlation metrics. Runs in monolithic mode (mimir/config.yml) for simplicity.
- Grafana: dashboards for detection visibility and alert rules with dynamic labels that route alerts by severity. Datasources are provisioned automatically.
- Webhook Tester: a self-hosted webhook receiver with a web UI for inspecting alert notifications in real time. Acts as a stand-in for PagerDuty, Slack, or Opsgenie during development.
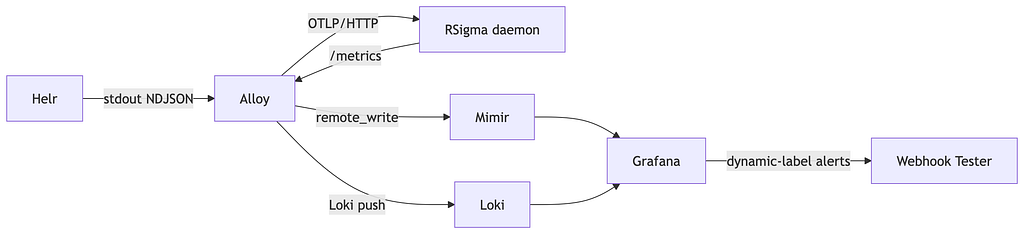
Alloy plays a dual role. First, log fanout: it reads Helr’s output, converts each NDJSON line to an OTLP log record, and sends the same event to both RSigma (for detection) and Loki (for storage). Second, observability collection: it scrapes RSigma’s /metrics endpoint and forwards the counters to Mimir via remote write.
The scenario
We reuse the Okta cross-tenant impersonation scenario from the second article. If you have not read it, here is the short version.
In August 2023, Okta disclosed attacks where threat actors compromised Super Administrator accounts and used legitimate identity federation features to impersonate users across tenants. The attack chain has four steps:
- Session via anonymizing proxy: log in through a VPN or Tor to hide the origin
- MFA deactivated: remove the second factor to maintain access
- Admin role assigned: escalate privileges on another account
- Identity provider created: set up a rogue IdP for cross-tenant impersonation
Each step maps to a real SigmaHQ detection rule. A custom correlation rule ties them together with temporal_ordered: all four must fire in order, from the same actor.alternateId, within a 30-minute window. Individual detections are noise. The correlated sequence is an incident.
For this demo, Helr replays pre-recorded Okta API responses containing six events. Bob’s normal login and an ops team app update are noise. The four superadmin@acme.com events complete the attack chain. The recordings were captured with helr run --once --record-dir ./recordings against a test environment and are included in the companion repo.
The stack
Here is the Docker Compose file. Every component is pinned to a specific version for reproducibility.
services:
  # Helr replays recorded Okta API responses and writes NDJSON to stdout.
  # Each line is a Helr envelope: {ts, source, endpoint, event, meta}.
  # The inner `event` field contains the raw Okta System Log event.
  # In production, replace --replay-dir with a real Okta API URL.
  helr:
    image: debian:bookworm-slim
    volumes:
      - ./helr/config.yml:/etc/helr/config.yml:ro
      - ./recordings:/recordings:ro
      - helr-logs:/var/log/helr
    entrypoint: ["/bin/sh", "-c"]
    command:
      - |
        apt-get update -qq && apt-get install -y -qq curl tar >/dev/null 2>&1
        ARCH=$$(uname -m)
        case "$$ARCH" in
          aarch64) TRIPLE="aarch64-unknown-linux-gnu" ;;
          *)       TRIPLE="x86_64-unknown-linux-gnu" ;;
        esac
        curl -sL "https://github.com/timescale/helr/releases/download/v0.6.0/helr-$${TRIPLE}.tar.gz" \
          | tar xz -C /usr/local/bin
        sleep 5
        while true; do
          helr run --config /etc/helr/config.yml --once --replay-dir /recordings \
            >> /var/log/helr/events.ndjson 2>/dev/null
          sleep 60
        done

  # RSigma detection daemon with OTLP ingestion enabled.
  # The GHCR image is built with --all-features, which includes daemon-otlp.
  # OTLP endpoints (/v1/logs for HTTP, LogsService/Export for gRPC) are
  # always active on the same --api-addr port alongside the REST API.
  rsigma:
    image: ghcr.io/timescale/rsigma:latest
    volumes:
      - ./rules:/rules:ro
    command:
      - daemon
      - -r
      - /rules/
      - --api-addr
      - 0.0.0.0:9090
      - --input
      - http
    ports:
      - "9090:9090"

  # Grafana Alloy: log fanout and metrics collection.
  # Reads Helr's NDJSON output, extracts the inner event from the Helr
  # envelope, sends events via OTLP to RSigma and to Loki.
  # Scrapes RSigma's /metrics and forwards to Prometheus.
  alloy:
    image: grafana/alloy:latest
    volumes:
      - ./alloy/config.alloy:/etc/alloy/config.alloy:ro
      - helr-logs:/var/log/helr:ro
    command:
      - run
      - /etc/alloy/config.alloy
      - --stability.level=public-preview
    ports:
      - "12345:12345"
    depends_on:
      rsigma:
        condition: service_started
      loki:
        condition: service_started
      mimir:
        condition: service_started

  # Loki: log storage for raw events and detection history.
  loki:
    image: grafana/loki:3.4.3
    command: -config.file=/etc/loki/local-config.yaml
    ports:
      - "3100:3100"

  # Mimir: metrics storage for RSigma detection counters.
  # Runs in monolithic mode (-target=all) with multi-tenancy disabled.
  # Natively accepts Prometheus remote_write at /api/v1/push.
  mimir:
    image: grafana/mimir:2.15.0
    volumes:
      - ./mimir/config.yml:/etc/mimir/config.yml:ro
    command:
      - -config.file=/etc/mimir/config.yml
      - -target=all
    ports:
      - "9009:9009"

  # Grafana: dashboards and alerting with dynamic labels.
  grafana:
    image: grafana/grafana:12.4.3
    volumes:
      - ./grafana/provisioning:/etc/grafana/provisioning:ro
    environment:
      - GF_AUTH_ANONYMOUS_ENABLED=true
      - GF_AUTH_ANONYMOUS_ORG_ROLE=Admin
      - GF_ALERTING_ENABLED=true
      - GF_UNIFIED_ALERTING_ENABLED=true
      - GF_INSTALL_PLUGINS=grafana-lokiexplore-app
    ports:
      - "3000:3000"
    depends_on:
      - mimir
      - loki

  # Webhook tester: catches and displays alert notifications in a web UI.
  # Open http://localhost:8080/s/e5a31f16-2ac3-4174-88f7-5f1130817784 to
  # see Grafana alerts arrive in real time.
  webhook-tester:
    image: tarampampam/webhook-tester:2
    environment:
      - AUTO_CREATE_SESSIONS=true
    ports:
      - "8080:8080"

volumes:
  helr-logs:
The helr container downloads a pre-built binary from the Helr GitHub releases at startup, selecting the correct architecture (aarch64 or x86_64) automatically. It then uses Helr's --replay-dir mode to serve pre-recorded Okta API responses. Helr starts a local HTTP server, rewrites the source URL to point at it, and runs the normal polling pipeline against the recordings. The output is NDJSON on stdout, appended to a shared volume. In production, you would drop the --replay-dir flag and point the url in helr/config.yml at the real Okta System Log API.
One detail: Helr wraps each raw event in an envelope with ts, source, endpoint, event, and meta fields. The actual Okta event lives inside the event field. The Alloy configuration handles this unwrapping, as we will see next.
The rsigma container uses the GHCR image, which is built with --all-features and includes OTLP support. The --input http flag enables the REST API for health checks and metrics, while the OTLP endpoints (/v1/logs for HTTP, LogsService/Export for gRPC) are always active on the same port when built with the daemon-otlp feature. No separate flag needed.
The webhook-tester container runs a self-hosted Webhook Tester instance. It receives alert notifications from Grafana and displays them in a web UI at http://localhost:8080. The AUTO_CREATE_SESSIONS=true setting lets Grafana post to a fixed session URL without manual session creation. After docker compose up, open http://localhost:8080 and navigate to the session to watch alert payloads arrive as RSigma triggers detections. This gives you a feedback loop while building the pipeline, without setting up external services.
Before starting the stack, log in to GHCR. Docker requires authentication for pulling from ghcr.io, even for public packages. If you have the GitHub CLI installed:
gh auth token | docker login ghcr.io -u YOUR_GITHUB_USERNAME --password-stdin
Or with a personal access token that has the read:packages scope:
echo $GITHUB_TOKEN | docker login ghcr.io -u YOUR_GITHUB_USERNAME --password-stdin
Then start the stack:
docker compose up -d
Within a few seconds, Alloy begins tailing Helr’s log file and sending events to both RSigma and Loki.
OTLP: the universal log intake
Previous articles showed RSigma ingesting events over HTTP (POST /api/v1/events) and NATS. RSigma v0.9.0 added a third path: native OpenTelemetry Protocol (OTLP) log ingestion. This is the path Alloy uses.
OTLP is the standard wire protocol for the OpenTelemetry ecosystem. Every major observability vendor and collector speaks it. By accepting OTLP logs natively, RSigma can receive events from any OTLP-capable agent without a translation layer: Alloy, the OpenTelemetry Collector, Fluent Bit’s OTLP output, or anything else that can export ExportLogsServiceRequest.
RSigma supports two OTLP transports:

Both share the same --api-addr port (default 0.0.0.0:9090). The REST API (/healthz, /metrics, /api/v1/events) and the OTLP endpoints coexist on a single listener via HTTP/1.1 and HTTP/2 multiplexing.
When RSigma receives an OTLP LogRecord, it flattens it into a JSON event for rule evaluation:
- Resource attributes get a resource. prefix (e.g., resource.service.name)
- Log attributes are unprefixed and become top-level fields
- Scope is preserved as scope.name and scope.version
- KV-list bodies are flattened to top-level fields
This means that when Alloy extracts the inner Okta event from the Helr envelope and places it as the log record body (a KV-list), RSigma flattens it to top-level JSON fields. The Sigma rules match eventType, securityContext.isProxy, and actor.alternateId against those fields without any processing pipeline.
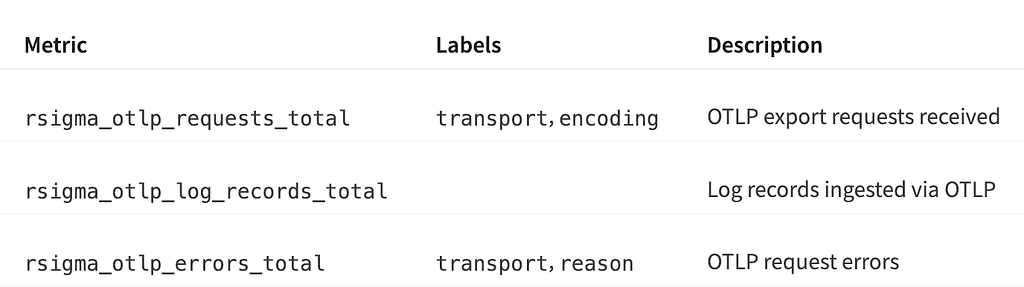
Three new Prometheus metrics track OTLP traffic:
Configuring Alloy
The Alloy configuration wires together the log fanout and metrics collection. Here is the full config; each block gets a brief explanation. For details on any component, see the Alloy documentation.
// ============================================================================
// Grafana Alloy configuration for RSigma security observability pipeline.
//
// Two responsibilities:
//   1. Log fanout: read Helr's NDJSON output, extract the inner event from
//      the Helr envelope, send via OTLP to RSigma for detection and to
//      Loki for long-term storage.
//   2. Metrics collection: scrape RSigma's /metrics endpoint and forward
//      to Prometheus via remote_write.
//
// Docs: https://grafana.com/docs/alloy/latest/
// ============================================================================

// ---------------------------------------------------------------------------
// 1. Log ingestion: read Helr's NDJSON log file
// ---------------------------------------------------------------------------
// Helr outputs NDJSON lines with an envelope: {ts, source, endpoint, event, meta}.
// The `event` field contains the raw log event (e.g., an Okta System Log entry).
// The operators below parse the envelope and extract the inner event so that
// Sigma rules can match against the original field names (eventType, actor, etc.).

otelcol.receiver.filelog "helr" {
  include  = ["/var/log/helr/*.ndjson"]
  start_at = "beginning"

  operators = [
    {type = "json_parser", parse_from = "body", parse_to = "body"},
    {type = "move", from = "body.source", to = "attributes.helr_source"},
    {type = "move", from = "body.ts", to = "attributes.helr_ts"},
    {type = "move", from = "body.event", to = "body"},
  ]

  resource = {
    "service.name"             = "helr",
    "deployment.environment"   = "demo",
  }

  output {
    logs = [otelcol.processor.attributes.add_loki_hints.input]
  }
}

// ---------------------------------------------------------------------------
// 2. Add Loki label hints so the exporter creates useful stream labels
// ---------------------------------------------------------------------------

otelcol.processor.attributes "add_loki_hints" {
  action {
    key    = "loki.resource.labels"
    value  = "service.name, deployment.environment"
    action = "insert"
  }

  output {
    logs = [otelcol.exporter.otlphttp.rsigma.input, otelcol.exporter.loki.default.input]
  }
}

// ---------------------------------------------------------------------------
// 3. OTLP export to RSigma for real-time detection
// ---------------------------------------------------------------------------

otelcol.exporter.otlphttp "rsigma" {
  client {
    endpoint = "http://rsigma:9090"
    tls {
      insecure = true
    }
  }
}

// ---------------------------------------------------------------------------
// 4. Loki export for long-term log storage
// ---------------------------------------------------------------------------

otelcol.exporter.loki "default" {
  forward_to = [loki.write.default.receiver]
}

loki.write "default" {
  endpoint {
    url = "http://loki:3100/loki/api/v1/push"
  }
}

// ---------------------------------------------------------------------------
// 5. Metrics: scrape RSigma's /metrics and forward to Mimir
// ---------------------------------------------------------------------------

prometheus.scrape "rsigma" {
  targets = [{
    __address__ = "rsigma:9090",
  }]
  metrics_path    = "/metrics"
  scrape_interval = "10s"
  forward_to      = [prometheus.remote_write.default.receiver]
}

prometheus.remote_write "default" {
  endpoint {
    url = "http://mimir:9009/api/v1/push"
  }
}
The otelcol.receiver.filelog block reads Helr's NDJSON file and uses four stanza operators to unwrap the Helr envelope. The json_parser parses each line into a structured body. Two move operators preserve the Helr metadata (source, ts) as OTLP log attributes. The final move replaces the body with the inner event field, so the OTLP log record's body contains only the raw Okta event. When RSigma receives this record, it flattens the KV-list body to top-level JSON fields, and the Sigma rules match against eventType, securityContext.isProxy, and actor.alternateId directly.
The output fans out to two destinations: otelcol.exporter.otlphttp sends to RSigma's /v1/logs for detection, while otelcol.exporter.loki converts the OTLP records to Loki format and pushes them for storage. The same event goes to both, with a single read.
On the metrics side, prometheus.scrape polls RSigma's /metrics endpoint every 10 seconds and prometheus.remote_write pushes the scraped metrics to Mimir.
Per-rule Prometheus metrics
The second article mentioned RSigma’s aggregate Prometheus metrics: rsigma_detection_matches_total, rsigma_correlation_matches_total, rsigma_events_processed_total, and others. These tell you how many detections fired, but not which rules fired.
RSigma v0.9.0 added per-rule counters with metric labels:
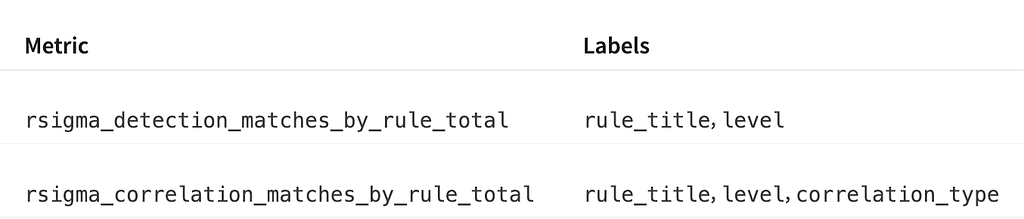
After the Okta attack sequence fires, curl localhost:9090/metrics shows:
rsigma_detection_matches_by_rule_total{rule_title="Okta User Session Start Via An Anonymising Proxy Service",level="high"} 1
rsigma_detection_matches_by_rule_total{rule_title="Okta MFA Reset or Deactivated",level="medium"} 1
rsigma_detection_matches_by_rule_total{rule_title="Okta Admin Role Assigned to an User or Group",level="medium"} 1
rsigma_detection_matches_by_rule_total{rule_title="Okta Identity Provider Created",level="medium"} 1
rsigma_correlation_matches_by_rule_total{rule_title="Okta Cross-Tenant Impersonation Sequence",level="critical",correlation_type="temporal_ordered"} 1
The level label comes directly from the Sigma rule's level: field. This is the key to what comes next.
Grafana dashboards
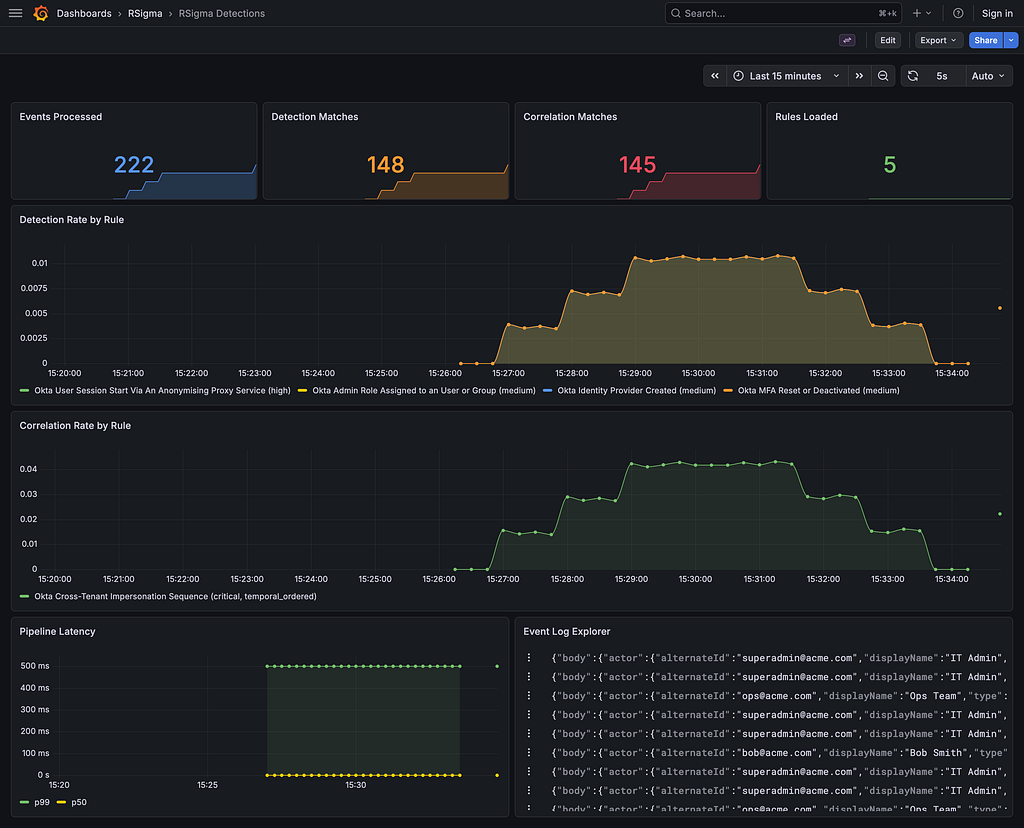
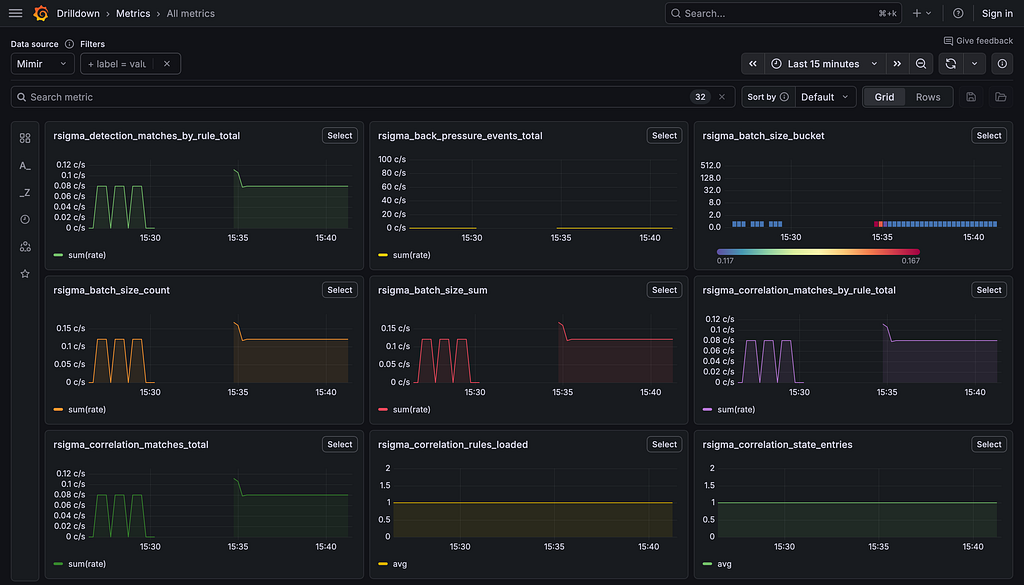
The companion repo includes a provisioned Grafana dashboard with:
- Stat panels for events processed, detection matches, correlation matches, and rules loaded
- Time series for detection and correlation rates by rule, using rate(rsigma_detection_matches_by_rule_total[5m]) with a {{rule_title}} ({{level}}) legend
- Pipeline latency histogram quantiles (p50, p99)
- Log explorer panel querying Loki for raw events from Helr
The dashboard is provisioned automatically on startup and available at http://localhost:3000. It is useful for visibility, but the real payoff is in alerting.
Grafana Alerting with dynamic labels
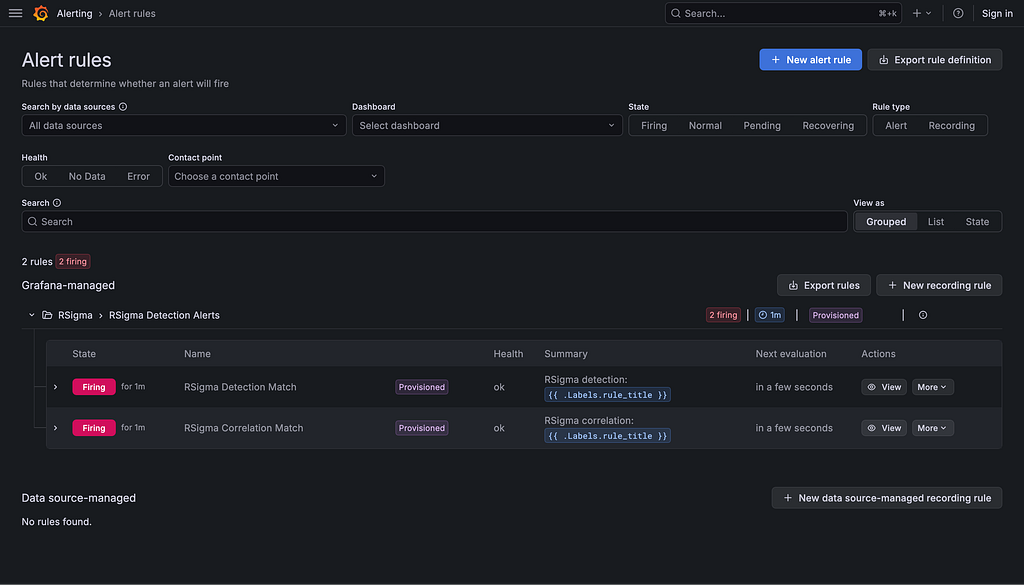
This is the centerpiece. Grafana Alerting supports dynamic labels where label values are computed at evaluation time using Go templates. Combined with RSigma’s per-rule metrics, this means the Sigma rule’s severity level flows directly into Grafana’s alert routing.
The alert rule
We create an alert rule on rsigma_detection_matches_by_rule_total (and a second one on the correlation metric). The rule has three query stages:
- Query A: increase(rsigma_detection_matches_by_rule_total[5m]) returns one time series per rule, each carrying rule_title and level labels.
- Reduce B: reduce each series to its last value.
- Threshold C: fire when the value is greater than 0.
Each alert instance inherits the rule_title and level labels from the metric. A detection of "Okta MFA Reset or Deactivated" produces an alert instance with level="medium". The cross-tenant impersonation correlation produces one with level="critical".
The dynamic severity label
We add a severity label with a Go template that reads the level label from the alert instance:
{{- if eq $labels.level "critical" -}}P1
{{- else if eq $labels.level "high" -}}P2
{{- else if eq $labels.level "medium" -}}P3
{{- else -}}P4
{{- end -}}
This template maps Sigma severity levels to a P1-P4 priority scale. The mapping is evaluated per alert instance, so different rules produce different severity values in the same alert rule definition. No separate alert rules per severity level. No manual label assignment.
The connection is worth emphasizing. The level: high field in a Sigma YAML file, written by the SigmaHQ community and committed to a Git repository, flows through RSigma's evaluation engine into a Prometheus metric label, then into a Grafana alert instance label, and finally into a dynamic severity label that determines which notification channel receives the alert. One line of YAML. No manual wiring.
Notification policies
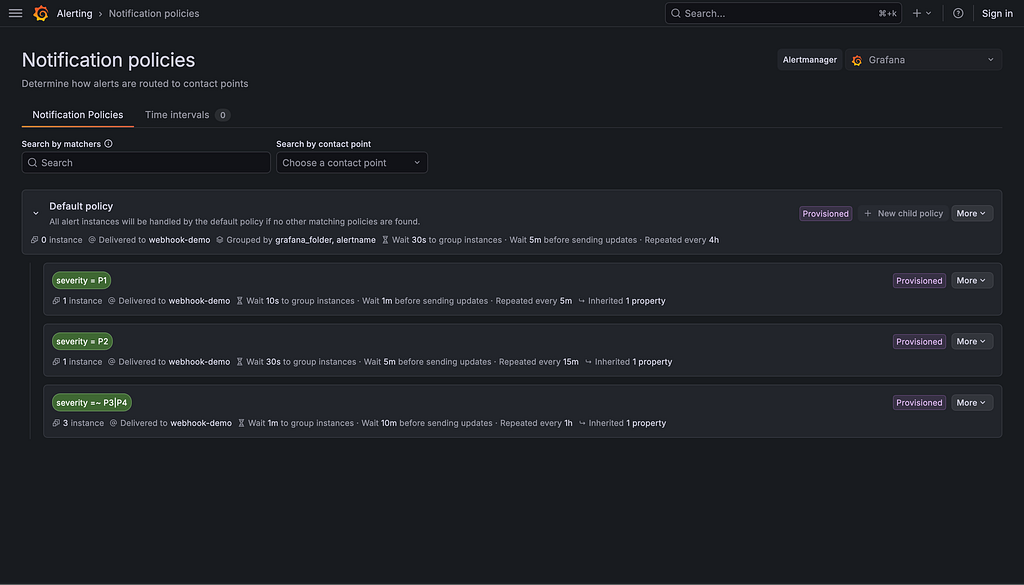
With the severity label in place, notification policies route alerts by priority:
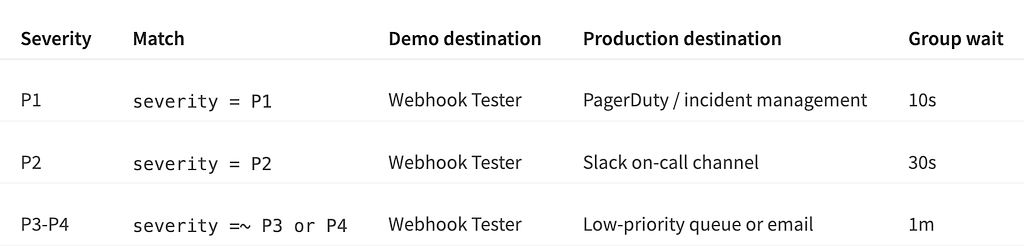
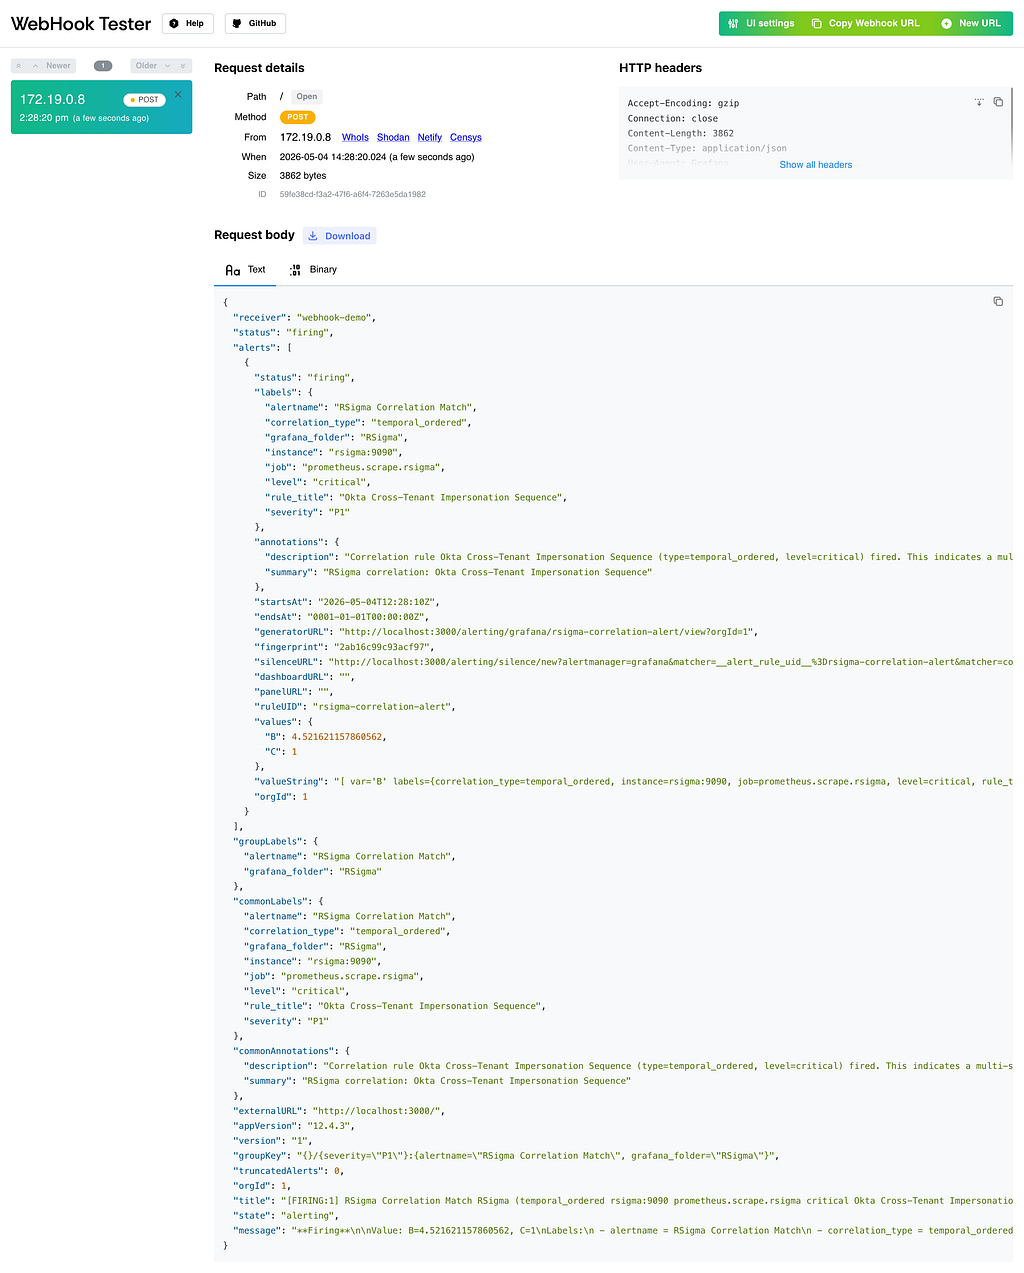
In the companion repo, all routes point to the Webhook Tester service, a lightweight self-hosted receiver that captures and displays each alert notification in a web UI at http://localhost:8080. Open the session URL shown in the docker-compose.yml comments to watch alerts arrive in real time. In production, you would replace this with actual Slack, PagerDuty, or Opsgenie contact points.
Provisioning
The entire alerting configuration, including contact points, notification policies, and alert rules with dynamic labels, is provisioned via grafana/provisioning/alerting/alerting.yml. No manual Grafana UI clicks required. The file is version-controlled alongside the Sigma rules.
Triggering the scenario
With the stack running (docker compose up -d), the helr container automatically replays the six Okta events. You can also trigger a manual replay:
./scripts/replay.sh
(See scripts/replay.sh in the companion repo.)
Here is what happens:
- Helr appends six NDJSON events to the shared log file.
- Alloy reads each line, parses the JSON, and sends it as an OTLP log record to both RSigma and Loki.
- RSigma evaluates each event against the four Okta detection rules. Bob’s login and the ops update produce no matches. The four superadmin@acme.com events each trigger a detection.
- When the fourth detection (Identity Provider created) fires, the temporal_ordered correlation completes: all four rules have fired in order, from the same actor.alternateId, within the 30-minute window. RSigma emits a critical correlation match.
- Mimir receives the updated per-rule metrics via Alloy’s scrape and remote write.
- Grafana evaluates the alert rules on the next cycle. Five alert instances fire:
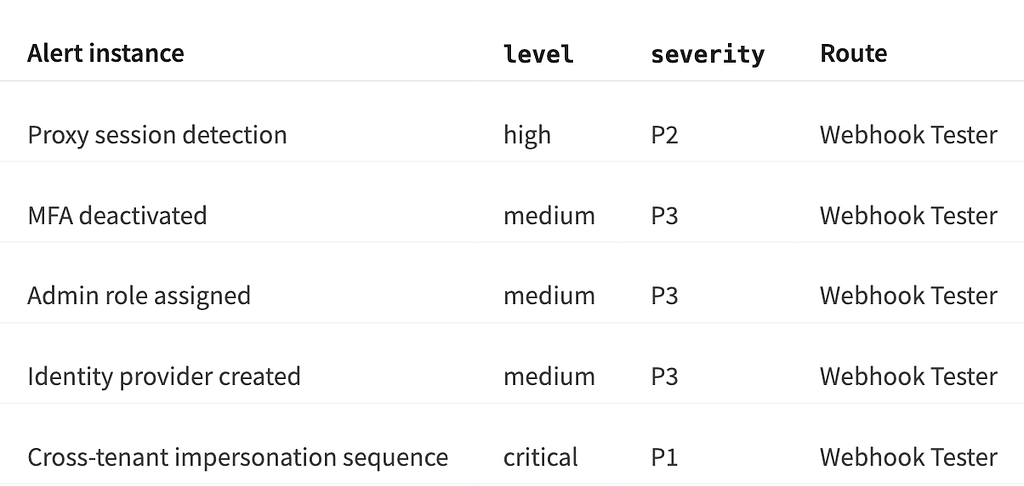
Four routine events, one critical correlation, all arriving at the Webhook Tester UI where you can inspect the full notification payload including the dynamic severity labels. In production, the P1 route would go to PagerDuty, P2 to a Slack on-call channel, and P3-P4 to a low-priority queue. The severity comes from the Sigma rules themselves.
What we did not cover
RSigma v0.9.0 shipped several other features that are outside the scope of this article but worth knowing about:
- NATS production hardening: at-least-once delivery, authentication, TLS, dead-letter queues, replay from offset or timestamp, and consumer groups for horizontal scaling.
- Smart correlation state restoration: sequence-aware auto-restore that prevents double-counting during replay.
- rsigma fields: a new subcommand that lists every field referenced by a set of rules, useful for validating pipeline mappings and auditing detection scope.
See the v0.9.0 release notes for the full changelog.
Wrapping up
This article completes a four-part arc. The first article showed RSigma as a CLI tool for pattern detection in JSON logs. The second turned it into a streaming daemon with correlation. The third showed how to convert Sigma rules to PostgreSQL SQL for historical detection. This one wired RSigma into a complete detection-to-alert pipeline using the Grafana observability stack.
What makes this pipeline interesting is where the alert severity comes from. It is not hand-coded in a Grafana alert rule. It is not mapped in a spreadsheet. It comes from the level: field in a Sigma YAML file, the same field that the SigmaHQ community maintains across 3,800+ rules. RSigma turns that field into a Prometheus metric label. Grafana's dynamic label template turns it into a routing decision. The Sigma rule is the single source of truth for both detection logic and alert priority.
This is a single-node setup. It is not a replacement for enterprise SIEMs at scale. But for small-to-medium teams that want a complete detection pipeline, from log collection to alert routing, without buying a SIEM license, it is a docker compose up away. The Webhook Tester makes it easy to validate the full loop end to end before wiring up production notification channels. The full stack, including Sigma rules, sample events, Alloy config, Grafana 12 dashboards, and alert rules with dynamic labels, is in the companion repository.
RSigma is open source under the MIT license:
cargo install rsigma
Or grab the Docker image:
docker pull ghcr.io/timescale/rsigma:latest
Security Observability with RSigma and the LGTM Stack was originally published in ITNEXT on Medium, where people are continuing the conversation by highlighting and responding to this story.
Comments
Nothing yet. Say the first thing.
Sign in to join the conversation.