
In this issue:
a showdown with yourself
unique job opening
real-returns
trading stock-bond correlation
confidence intervals on bounded ranges
Friends,
Earlier this summer, while still in the midst of reading, I recommended this book:

I wrote:
My wife and I are both reading this. It’s laugh-out-loud funny. Gary is an excellent writer. The novel is written from the point of view of an elite school’s endowment CIO. It presents as a series of meetings with prospective managers, deals with politics within the endowment but also with the external culture of the investing world. If you are in finance, Gary’s sharp eye will delight you til no end.
I’m less than halfway through it and already I can’t recommend it enough. It was recommended to me by an allocator (thanks Tom!) and I saw in a recent Byrne Hobart letter that one of Byrne’s friends physically accosted him for not having read this book yet.
You can see Matt Levine’s endorsement in the screenshot. I wouldn’t have articulated what Matt wrote, but once he said it, I noticed that’s the exact feeling I get reading it.
The CIO’s banter, verbal chess, and inner monologue reveal a fox-like savvy honed by years of battle with both the market and the managers who make convincing cases for how they’ve mastered them. It gave me a tremendous appreciation for the difficulty of the job. If you are not a professional investor and have confused the most generous market run in anyone’s living memory for your own brilliance, then considering the CIO’s constraints will update your context for the pro version.
I’m done with the book. So what do I have to say now?
Go read it this second if it sounds even remotely interesting to you.
I was so enamored of the protagonist's wit, smarts and integrity…but it is all a setup. It’s not a twist like he turns out to be Marty Bird or something like that. The twist is subtle enough that not everyone would notice there even is one, and yet it knocked me right over.
It’s not a spoiler to say that the story is all a set-up for a showdown with a character named Michael Hermann. Which is, depending how much you hate yourself (in my case apparently a whole lot), a showdown with yourself.
I’ll leave things a tad vague as I don’t want to ruin anything, but this book’s mark of greatness is that you are left to tangle with a particular instance of the Witch illusion.

You might never unsee the possibility that free-thinking and excellence might be exclusionary of all else.
I posted a bunch of screenshots from the book on X, but I won’t link to them. Better to go in raw. But in case that weren’t enough to frighten you

Seriously.
A grab bag of topics.
Old Mission is a large derivatives market-maker founded by SIG alum nearly 20 years ago. Mike Suh is their head of education amongst other things. Mike was a colleague at SIG and as my friend Tina says, he’s not just smart like “smart smart” which says so much with so little.
He is hiring an Associate Head of Trader Education. If you are qualified and live in Chicago this is worth checking out. OM is a very impressive firm (and lured Mike out of early retirement) and this is a rare opportunity.
Speaking of SIG, here’s a headline you don’t see often…a reference to literal goats:
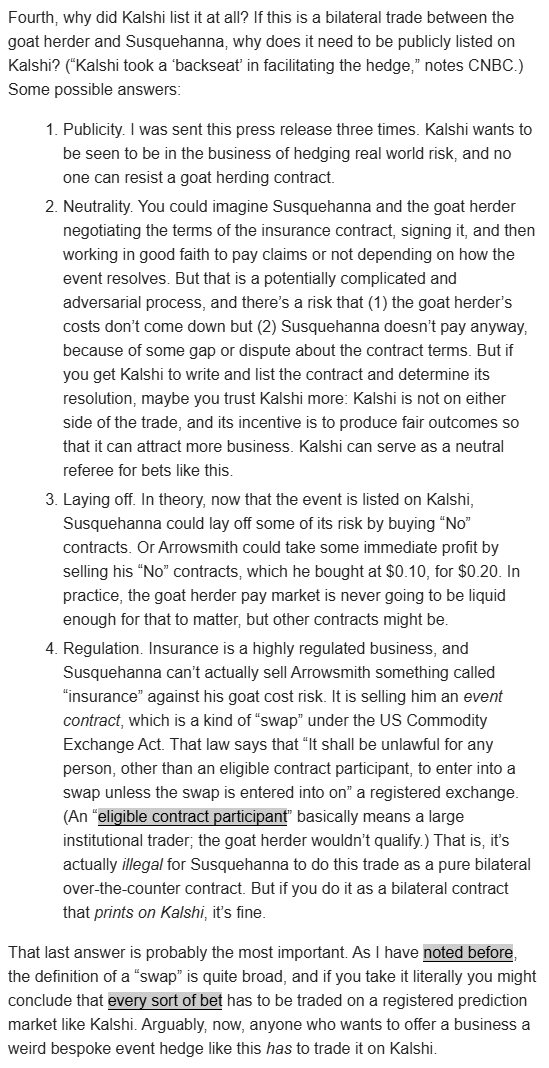
You’re welcome to read that article but the Matt Levine post Bilateral Goat Hedge unpeels the most interesting angles which come down to the evolving legal architecture of betting in the U.S.
Excerpt of note:
Speaking of betting, Erik and I published this episode in early August.
📺Is Trading Just Fancy Gambling? | The Options Trench
The question has never been more relevant considering this story which made the rounds all over social media this week and opens with a doozy:
More than half of Gen Z investors redirected money for investing toward sports betting in the past year, according to Betterment‘s 2026 Retail Investor Survey released this week.
This is from you can ONLY eat risk-adjusted returns:
There’s a question bandied around Twitter every now and then…What would the TIPs yield need to be for you to plow all your savings into it and not concern yourself with investing anymore? In this interview, Corey and Victor frequently speak in terms of real returns and what sticks out to me is how much higher people think equity real returns are above TIPs but in reality that number over long periods is ~ 3% give or take 2%, maybe 3%. If the TIPs yield were 4% you could really live by the 4% rule without worrying.
Well, dust off the discussion.
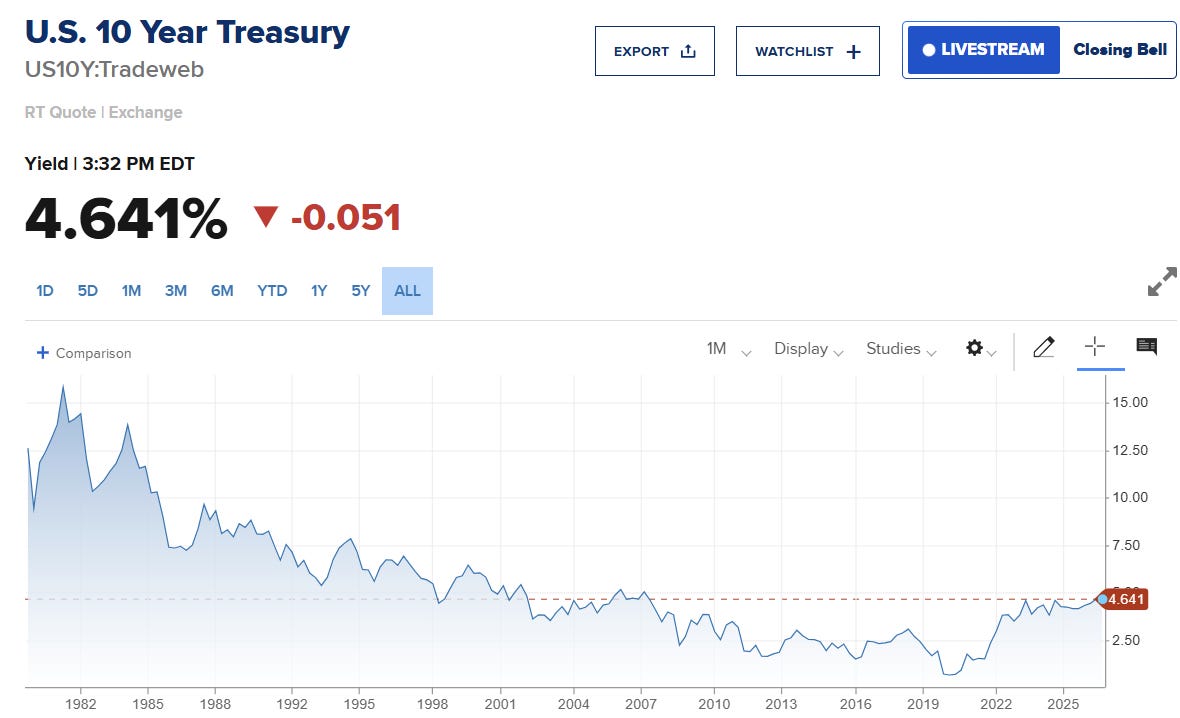
10-year bond yields are near 20-year highs.
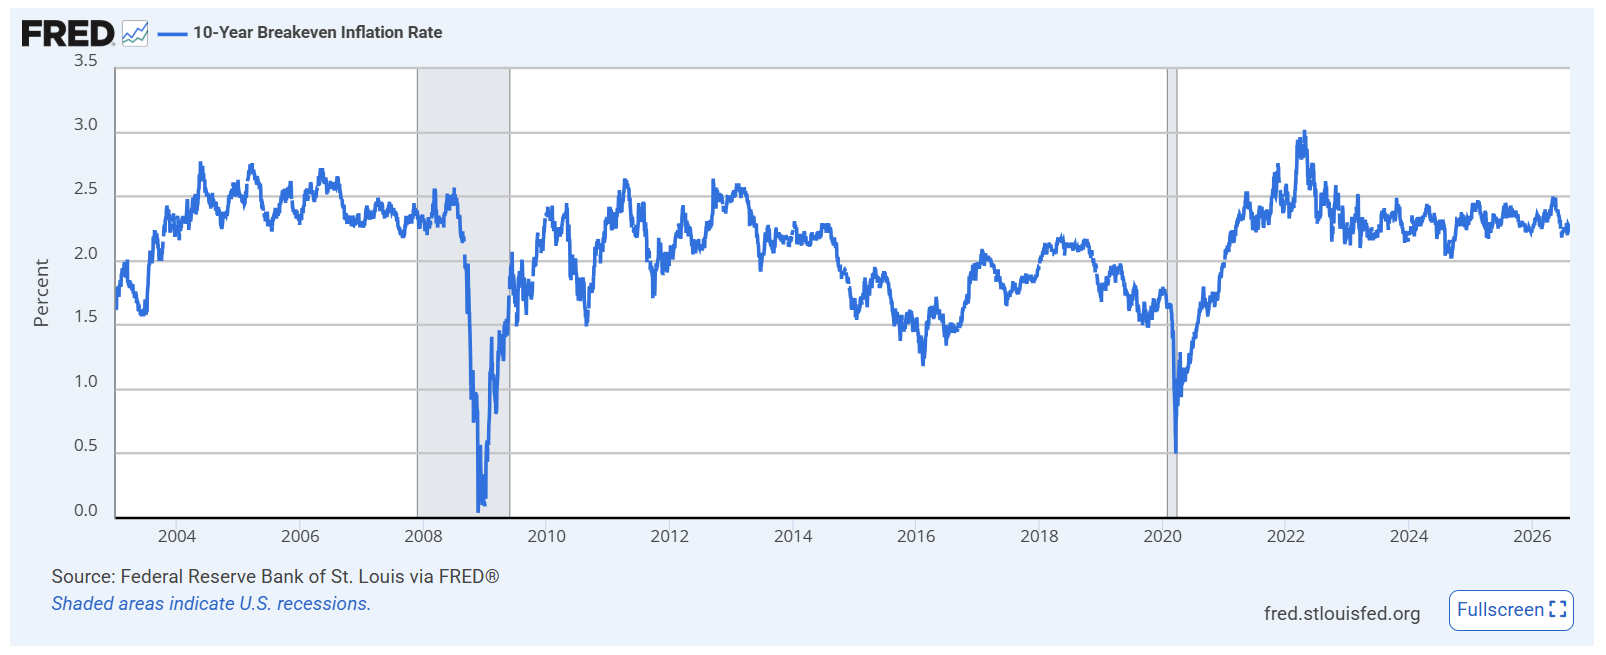
but also…TIPs breakevens are on the skinny side of their 5-year range, meaning the TIPs yield is relatively attractive versus the nominal bond yield. If that’s confusing, just imagine they both had the same yield (ie the breakeven inflation were 0)…in that case you’d definitely prefer the TIPs.
Here’s Nick’s post from a few weeks ago regarding the 30-year:

Nick G.@nickgiva1
If you are a rich old geezer with a bus pass...this is starting to look interesting. And if you don't agree...guess what? You can piss your money up the wall anyway you like, I won't stop you. And you won't stop me.

2:00 PM · Jul 31, 2026 · 16.4K Views
11 Replies · 3 Reposts · 107 Likes
I focus on the 10-year because my bias is that the term premium for the 30-year isn’t enough to consider.
Current 10-Year TIPS Yield: ~2.40%
Recent 10-Year Nominal Treasury Yield: ~4.65%
Implied 10-Year Breakeven Inflation Rate: ~2.25% (calculated as the difference between the nominal yield and the TIPS real yield)
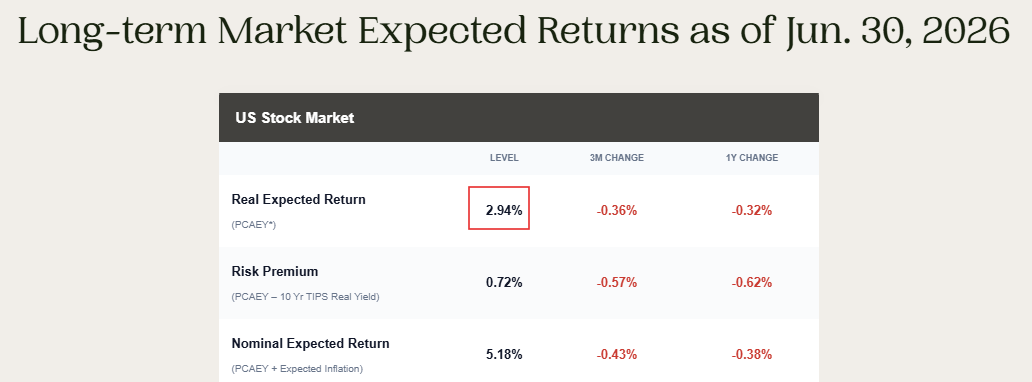
And this is Elm Wealth’s most recent model update:
I have my eye on more TIPs for my IRA. I know it’s boring stuff. If you want more excitement, remember all the collar stuff I published this week. The high rates improve the collar risk-reward profiles.
We are not in a TINA environment. There are reasonable prices to diversify out of equities if you feel defensive. Elm expects historically low compensation for taking equity risk, but that’s been the story for years. That’s why this isn’t easy. I just know that diversification is my best ex-ante strategy so I’m thankful for the alternatives.
Learn more:
🔗What I Learned About TIPs | 10 min read
Reading Correlation Through RSSB Options | 12 slides
Return Stacked’s RSSB gives you a dollar of global equities and a dollar of Treasuries on the same dollar of capital. They just listed options on it this week. It will be a useful option market to watch if it gathers liquidity because its implied vol allows you to back out an implied stock-bond correlation since we know the vol of the legs.
Risk-parity funds and strategies are diversified, which gives them cover to use leverage but also means they are structurally short stock-bond correlation. In theory, they should be natural buyers of RSSB vol. If they actually did that, I’d expect the implied vol to trade at a healthy risk premium since it’s a one-way risk. There’s no real natural seller of that correlation.
I asked the Moontower Agent to work out the details and generate a deck (which is also a heat check on its abilities.) It produced a deck I could download, walking through the variance identity, a IEF-for-GOVT proxy swap, a scenario table for implied ρ across RSSB IV levels, and the noise associated with realized correlation.
The deck is short and educational:
Reading Implied Correlation Through RSSB Options
Confidence Intervals on Correlation
This made me look up a time series of the correlation between stocks and bonds using VTI and IEF as respective representatives of the asset classes. The 30-day came back +0.43, the 1-year at +0.28.
The agent volunteered the following statistical insight:
N=22 daily returns is a small sample. The 95% confidence interval on a correlation of +0.43 with N=22 is roughly [+0.02, +0.72] — wide. You cannot confidently distinguish +0.43 from +0.20 or +0.60 at that sample size. The 1Y number (N=251) is statistically much tighter — CI roughly [+0.16, +0.39].
Normally, when you compute a confidence interval, you effectively make a market by scaling the standard deviation to your desired confidence (so 1.96 or “2 sigma” for ~95% confidence)
But take notice of the first interval: +0.02 to +0.72 isn’t centered on +0.43. The upper tail runs 0.29 above, the lower tail 0.41 below. Weird. You wouldn’t see lopsided error bars if the math was something like “estimate ± 1.96 × standard error”.
Agent teach me what you did and why.
The problem is that the error bar’s width depends on the answer
Correlation lives on [−1, +1]. Bounded. If the true ρ is 0.9, your sample estimates can’t overshoot by much (the ceiling is 1.0) but they can undershoot plenty.
That boundedness shows up in the standard error of r itself, which runs about (1 − r²)/√(N − 1). Look at what that does. At r = 0.43 with N = 22 the SE is 0.177. At r = 0.9 with the same 22 observations it’s 0.042, four times tighter. Not because you learned more, but because you got squeezed against the wall.
The agent used something it called Fisher’s fix to move to a coordinate system where the standard error stops depending on r, do the easy symmetric thing there, and come back.
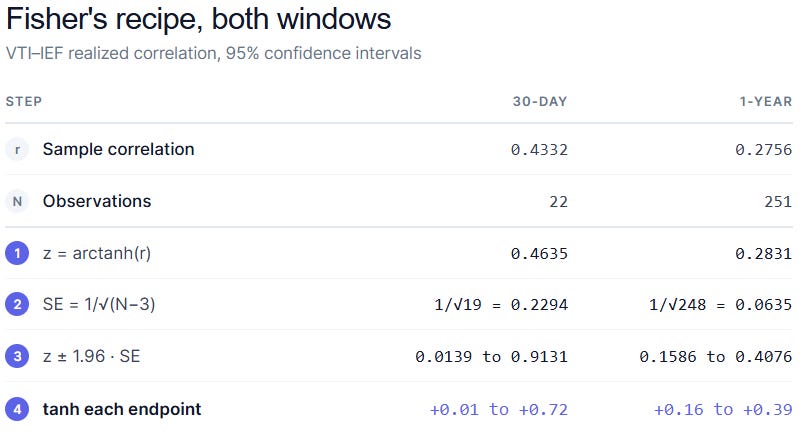
The recipe
1. Transform the point estimate: z = arctanh(r) = ½ · ln[(1 + r) / (1 − r)]
2. Take the standard error in z-space: SE = 1/√(N − 3). Note what’s missing. No r. Sample size is the only input.
3. Build the interval symmetrically, the boring way you already know: z ± 1.96 · SE
4. Recover each endpoint separately: tanh(z_low) and tanh(z_high)
Broadly educational bits to notice
Step 1 does almost nothing to the estimate.
0.4332 becomes 0.4635. The transform is only there to get the r out of the standard error in step 2.
Step 4 is where the lopsidedness comes from.
Both 30-day endpoints sit exactly 0.4497 away from the center in z-space. Perfectly symmetric. But tanh squashes hard once you’re out past 0.5 but does almost nothing near the origin, so the top end at 0.9131 gets crushed down to +0.72 while the bottom end at 0.0139 is nearly untouched at +0.014. What matters is each endpoint’s distance from zero, not its distance from your estimate.
Step 2 accounts for sample size
Ten times the sample and the standard error only comes down by a factor of 3.6. At large N the confidence grows by √N scaling, but at small N, subtracting 3 makes the confidence grow slower than square root scaling.
2 lessons
The object-level lesson: Correlations are volatile and because they are bounded from [-1,1] we need to recenter our point estimates before cuffing their ranges
The meta-lesson: LLMs are great math tutors so when they volunteer info of the “I don’t know what I don’t know” variety they can hold your hand. I’ve shared how I use LLMs as a tutor before in Socrates 2026: how to use highlights
Moontower Weekly Recap
Book a call with me.
It's $500 for 60 minutes. Let's work through your problem together. If you're not satisfied, you get a refund.
Let me know what you want to discuss and I’ll give you a straight answer on whether I can be helpful before we chat.
I started doing these in early 2022 by accident via inbound inquiries from readers. So I hung out a shingle through the Substack Meetings beta. You can see how I’ve helped others:
📡All Moontower Meta Blog Posts
👤About Me
Specific Moontower Projects
🧀MoontowerMoney
👽MoontowerQuant
🌟Affirmations and North Stars
🧠Moontower Brain-Plug In
Curations
✒️Moontower’s Favorite Posts By Others
🔖Guides To Reading I Enjoyed
🤖Resources to Get More Out of AI
🛋️Investment Blogs I Read
📚Book Ideas for Kids
Fun
No posts
Comments
Nothing yet. Say the first thing.
Sign in to join the conversation.