
Chinese goods trade is huge and key to understanding China’s economic interactions with the world. Most analyses focus on the implications for foreign industries of the cheap and competitive products produced in China. In this note, however, we will focus on how China’s goods trade is key to understanding China’s financial interactions with the rest of the world.
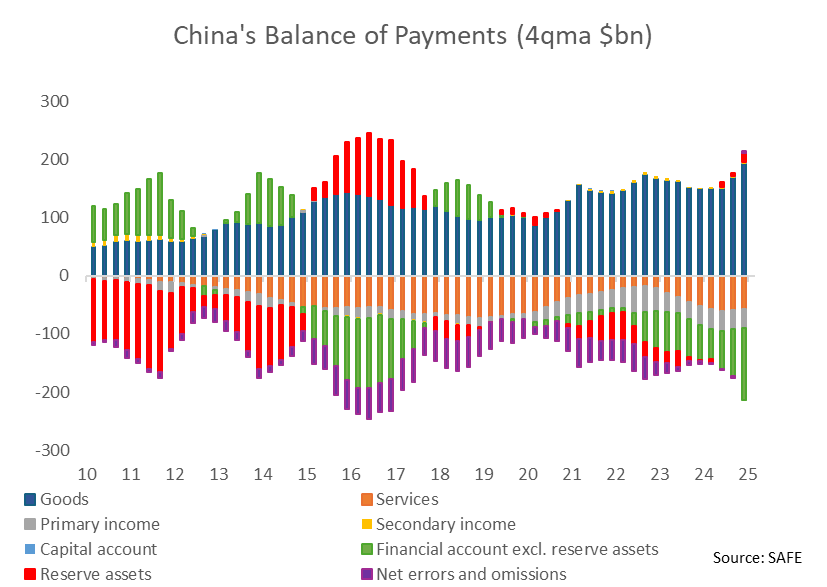
China’s trade balance makes up the vast majority of China’s BoP net credits (net inflows), and most other categories are, in fact, sources of outflows (note that buying a foreign asset is counted as an outflow in the BoP). This is evident in the blue bars below, where we can see that goods trade has more or less become the only source of inflows for China in the 2020s. In 2024, the goods trade balance was $768bn, for example, larger than the net amount Chinese residents spent on services abroad (mostly in the form of tourism, -$229bn) and the net amount of foreign financial assets, such as stocks and bonds, that Chinese residents purchase (-$496bn).
This is a shift from the 2010s, when portfolio flows (“financial account excl. reserve assets” in the chart below) made up a large portion of the inflows, at least up until 2015.
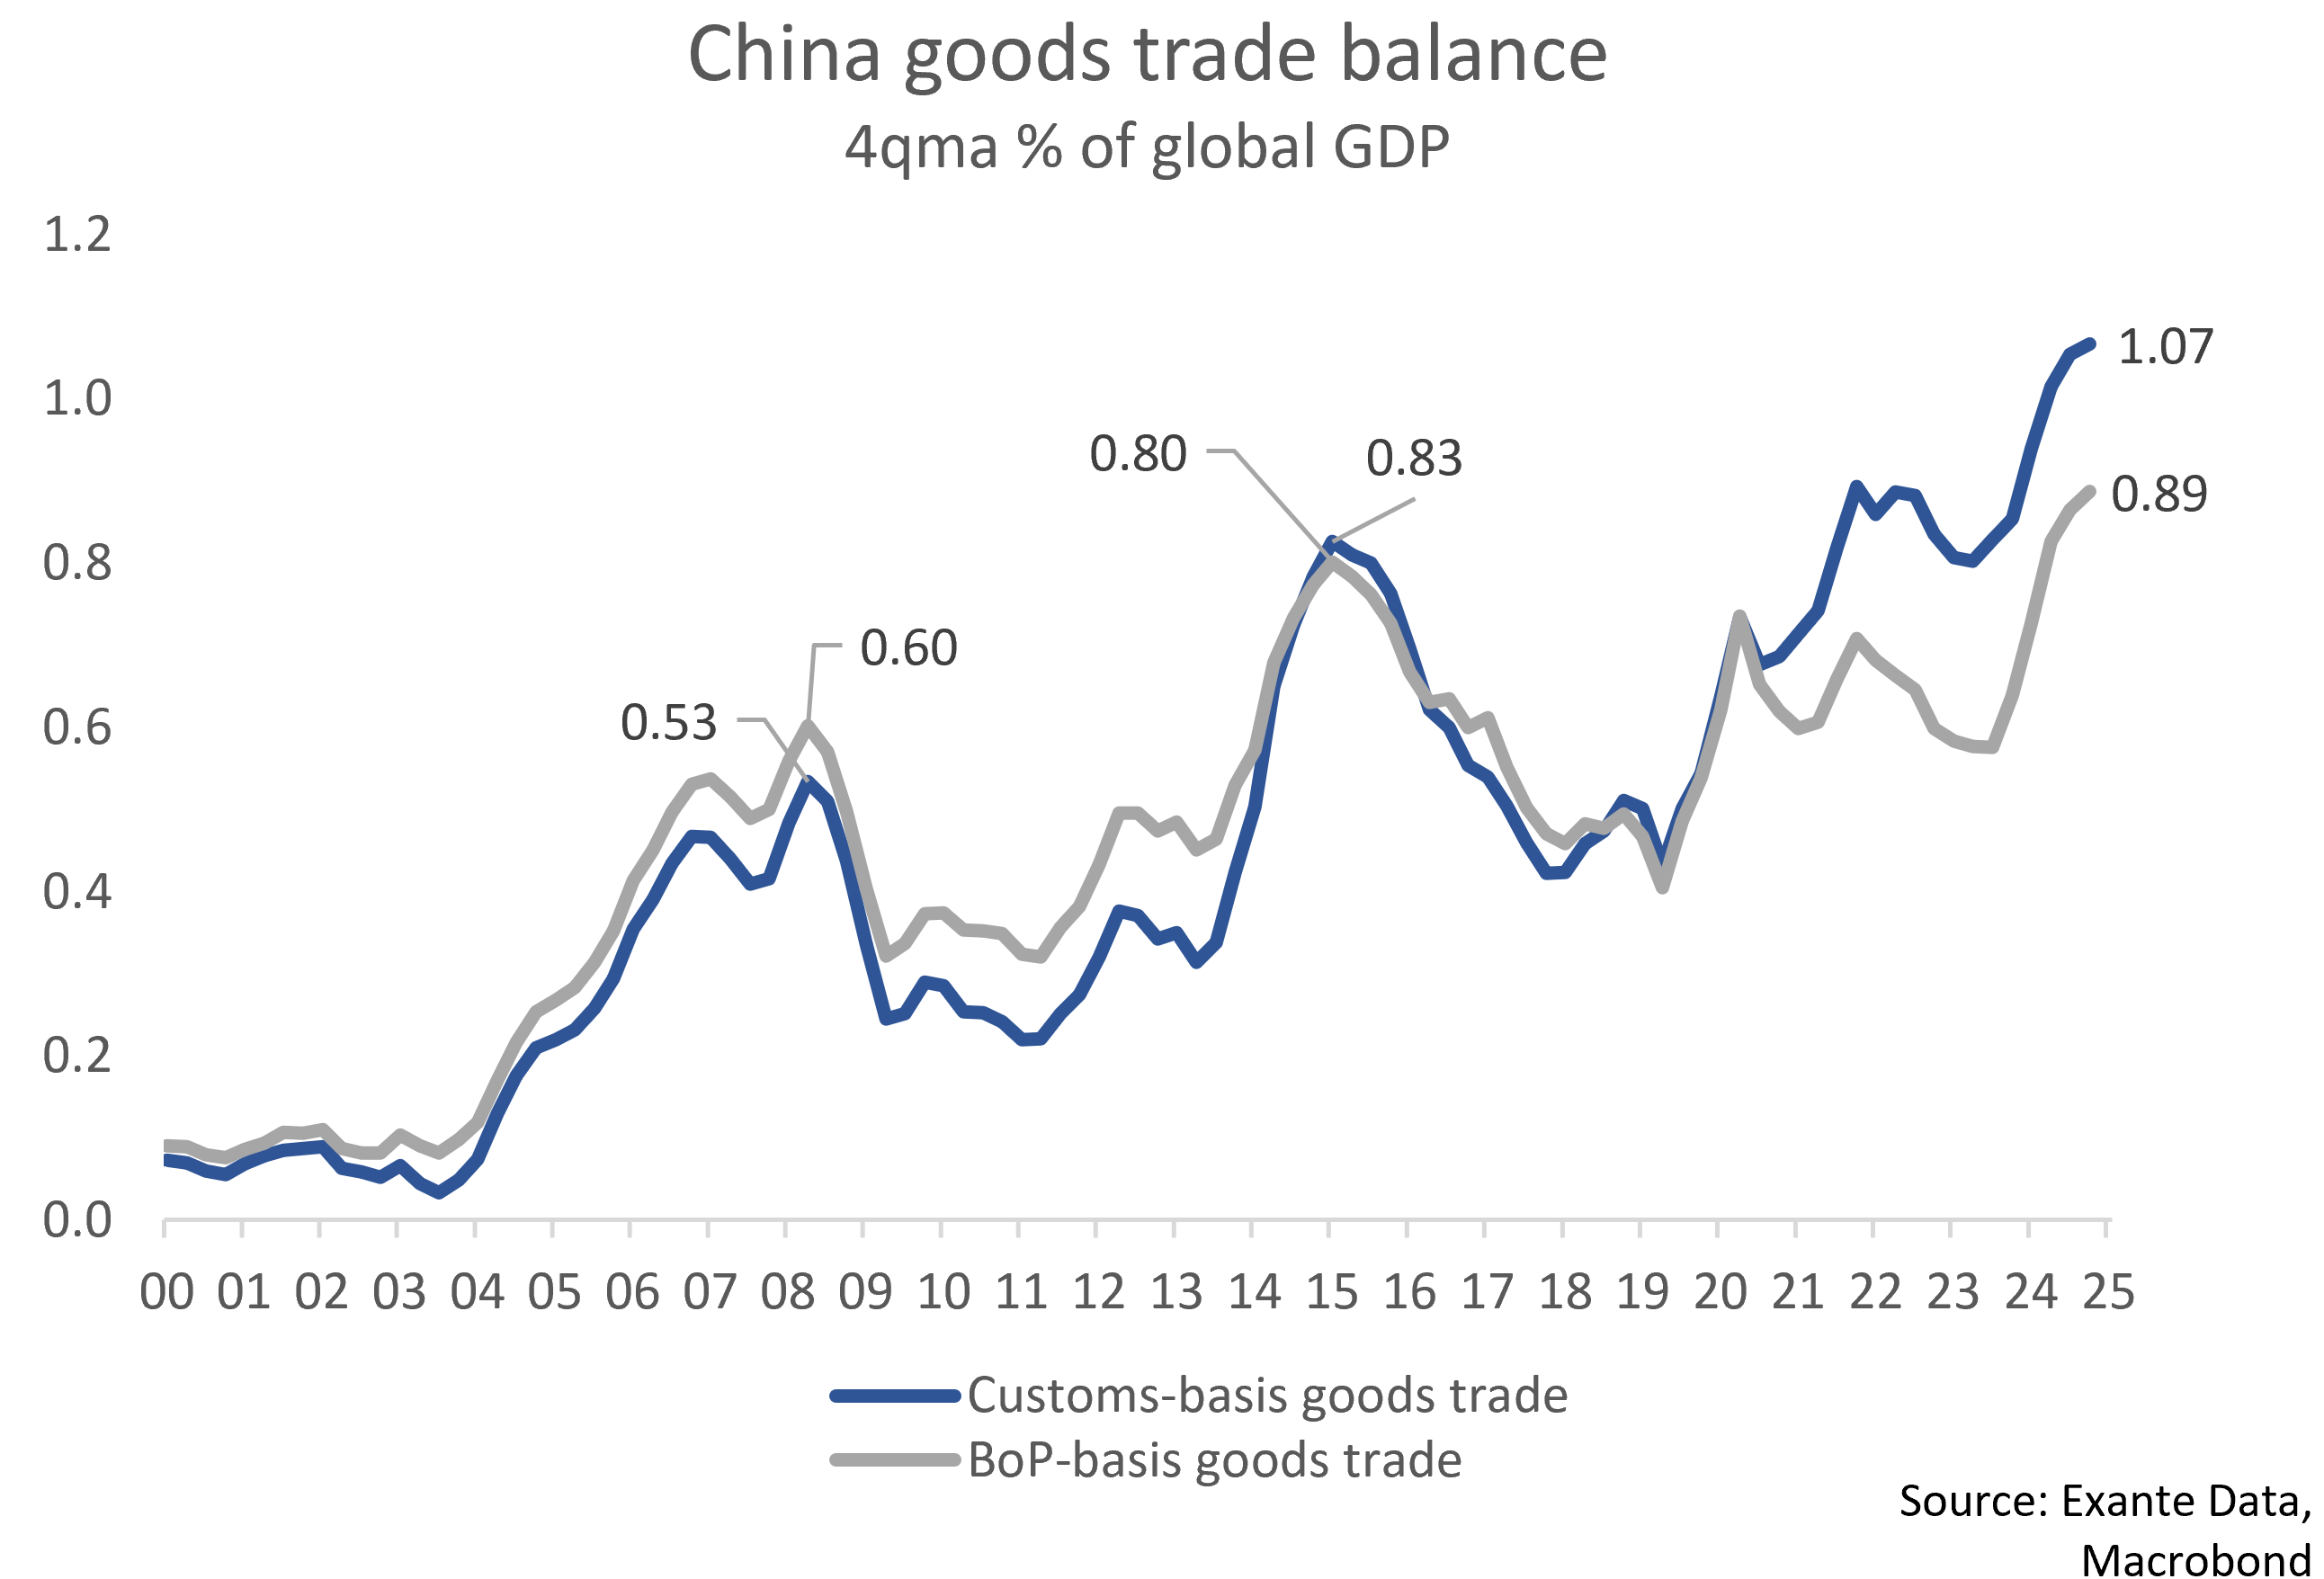
The size of China’s goods trade balance becomes even clearer when we compare it to global GDP. China’s goods trade balance now adds up to 0.9-1.1% of global GDP, depending on how it’s measured, the highest on record.
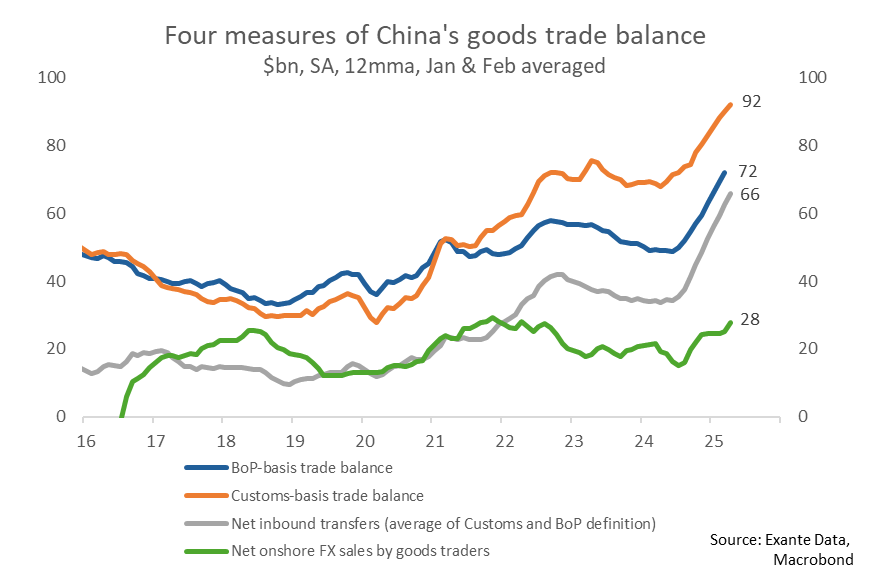
There are four main ways to measure Chinese goods trade, at least as it pertains to the analysis of capital flows.
The two series that get the most attention are the (1) “Customs-basis” and (2) “BoP/SAFE basis” goods trade - we discussed the internal discrepancies between these two series here.
China’s State Administration of Foreign Exchange (SAFE) also reports data on (3) cross-border bank transfers (“remittances”) related to goods trade as well as the amount of (4) FX sales and purchases (“settlement”) by goods traders. These two data sets are, as far as we are aware, unique to China. It is worth noting that, except for the dataset on FX sales and purchases, the three other datasets cover both renminbi and FX.
In the chart below, we illustrate the four measures of China’s goods trade balance up to April 2025 (the latest data when this note was drafted). In April 2025, the Customs-basis goods trade balance was $92bn on a 12mma basis, whereas the BoP-basis trade balance was lower, at $72bn. During this period, goods traders transferred $66bn back to China from offshore ($65bn if the BoP definition is used, or $67bn if the Customs definition is used) and sold $28bn of FX (bought renminbi). The large discrepancy makes it clear that it is important to look beyond the headline (Customs) trade data; despite that China’s goods trade balance has doubled in the past few years, that has not led to a one-for-one increase in the amount of FX that goods traders sell (ie, the amount of renminbi they buy).
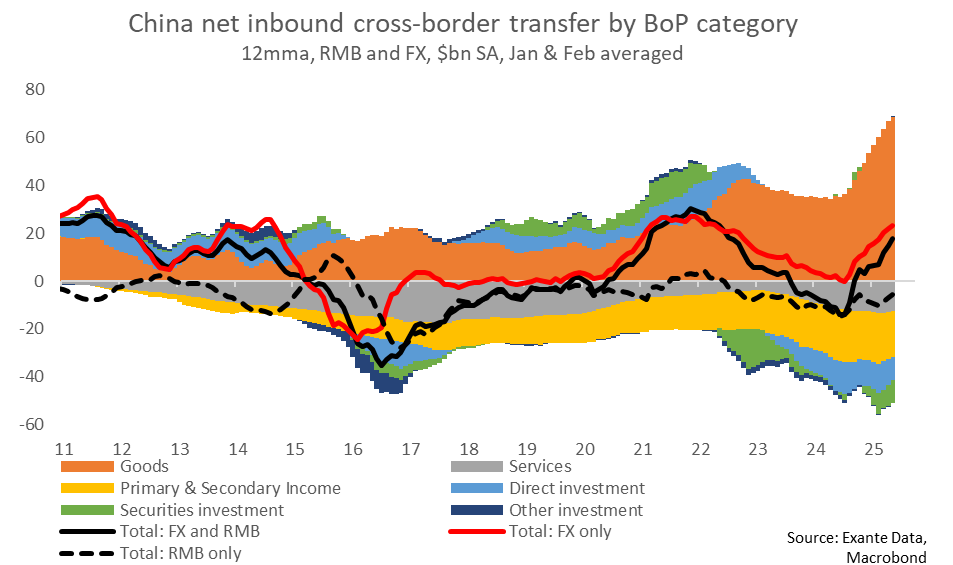
The dominance of Chinese goods trade as a source of inflows is also evident in net inbound transfers (which correlate with, but is definitionally different from, the BoP data). In the year to May 2025, goods traders transferred $819bn into China on a net basis. This is shown in the chart below. Transfers across other categories were negative, adding up to -$611bn.
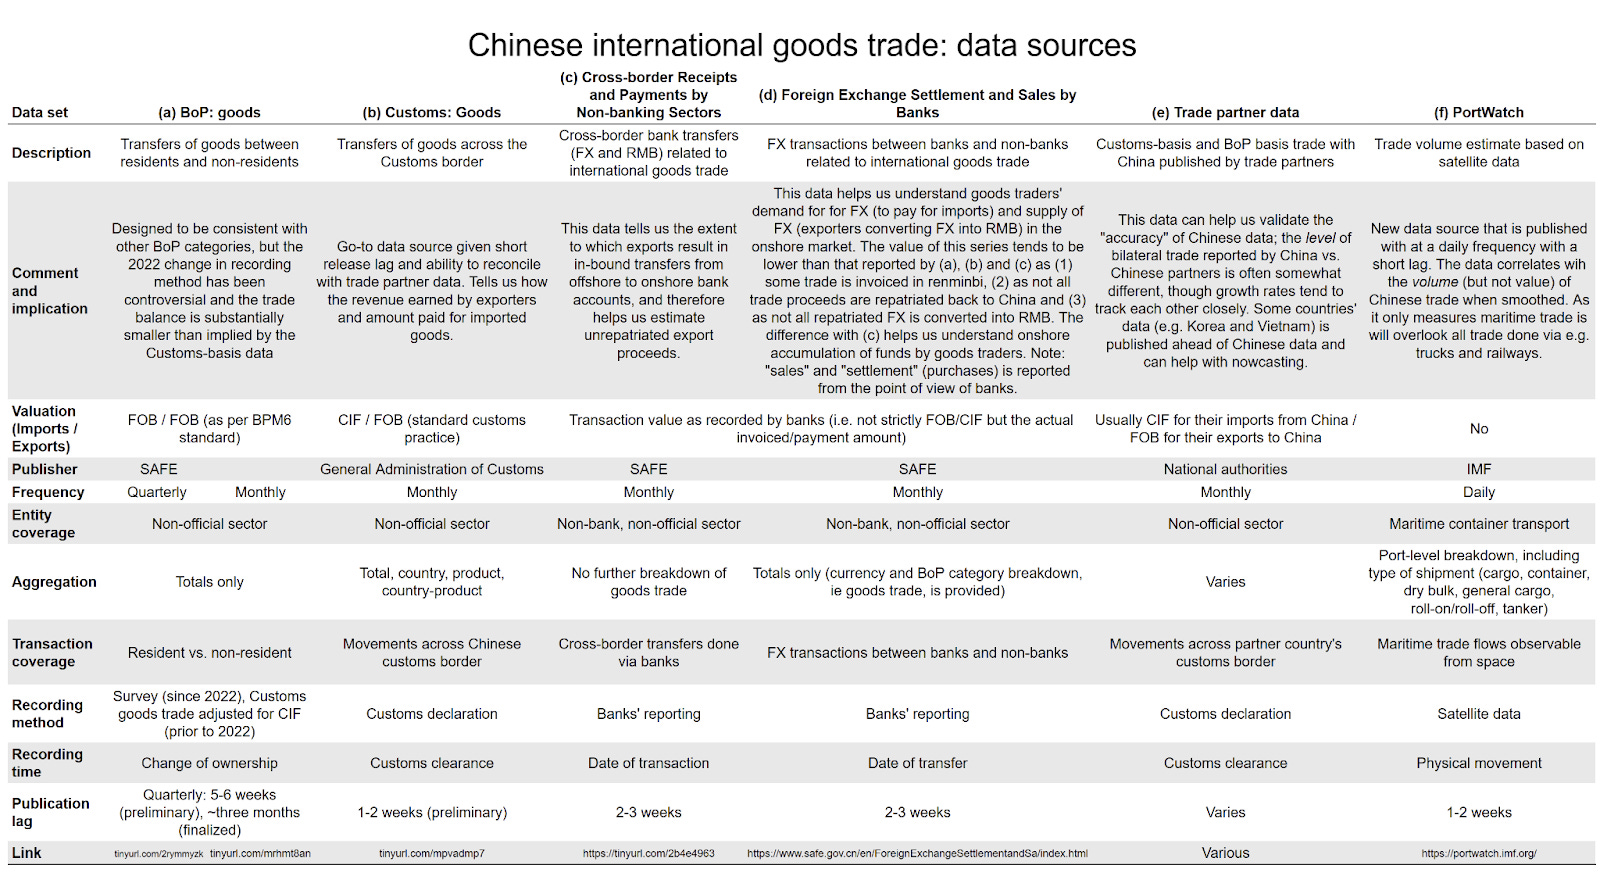
We summarize the four different data sources in the table below, which also summarizes attributes such as publication lag, recording method, and recording time. The trade partner and IMF PortWatch data, which is based on satellite data, are alternative ways to measure goods on a Customs basis.
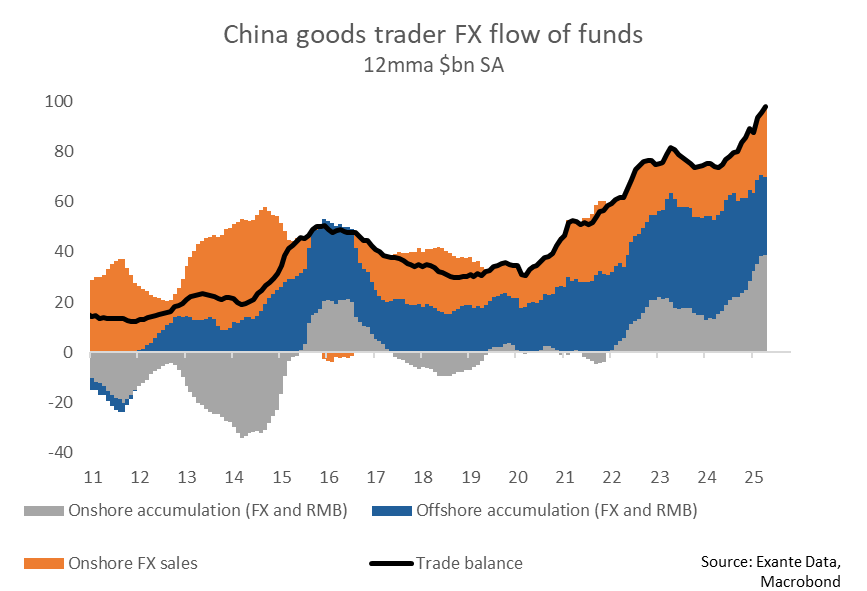
The different measures of goods traders’ activity allow us 1) to decompose the flow of the Chinese trade balance, 2) to calculate goods traders’ view on the renminbi.
We can decompose China’s trade balance into offshore and onshore accumulation (of FX and renminbi) as well as FX sales. We show this in the chart below. Of the $98bn/month trade balance that China had in the 12 months to April 2025, $31bn was accumulated offshore. Of the $67bn that was repatriated back onshore, $28bn of FX was sold (to banks), and the remaining $39bn was accumulated or spent onshore.
We can decompose the trade balance via the following equations:
Offshore FX and RMB accumulation by goods traders = goods trade balance - net inbound cross-border transfers by goods traders
The data on the money that goods traders repatriate/transfer back to China covers both renminbi and FX. If we subtract onshore FX sales by goods traders from the inbound transfers, we can get a sense of the amount of onshore accumulation (across both FX and renminbi). There has been a large increase in onshore accumulation by goods traders from 2022 to spring 2025.
Onshore FX and RMB accumulation by goods traders = net inbound cross-border transfers by goods traders (FX and RMB) - net onshore FX sales by goods traders
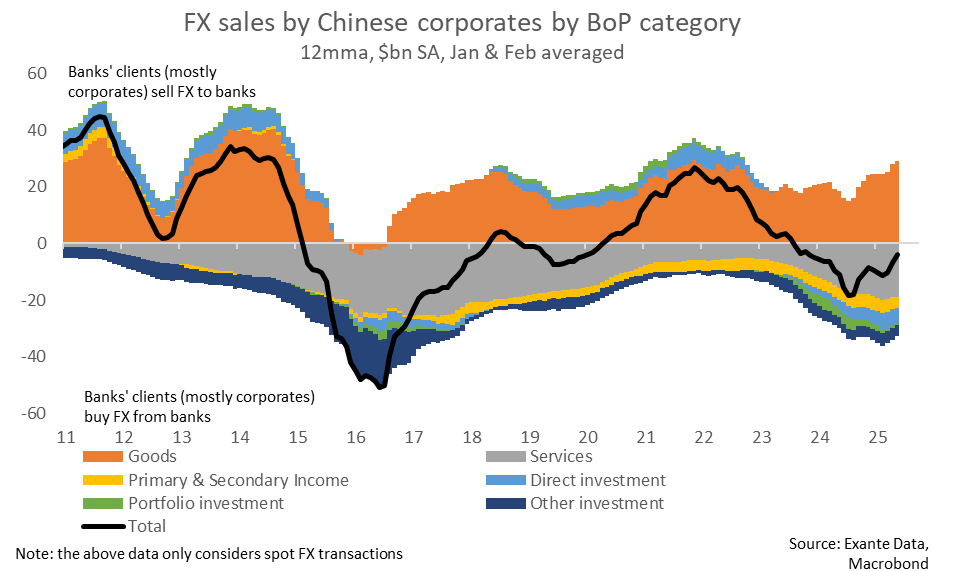
Goods traders’ onshore FX sales. In the 12 months to May 2025, goods traders sold $351bn of FX to banks. Goods traders’ willingness to a) bring their export proceeds back onshore and b) convert their FX earnings into renminbi are both major determinants of demand for the renminbi.
Above, we argued that the absolute values of repatriation and FX sales can help us understand the size of, for example, demand for the renminbi. But these numbers tell us little about the behavior and preferences of goods traders without further context. Concluding whether it is “high” or “low” for goods traders to, for example, sell $40bn of FX (buy renminbi) in a given month will depend on whether the trade balance was $50bn or $100bn. Two simple ratios help here: the repatriation rate simply scales the amount of repatriated funds (both FX and renminbi) by the goods trade balance, and the FX conversion rate similarly scales net FX sales.
Goods traders normally repatriate around half of the goods trade balance, though it has been nearly 70% in the year to May 2025. In general, the repatriation rate is relatively stable and doesn’t show much cyclicality. One exception is that there was a decline in the repatriation rate when Trump increased tariffs on China during his first term, though the opposite was the case in the lead-up to, and early during, Trump’s second term.
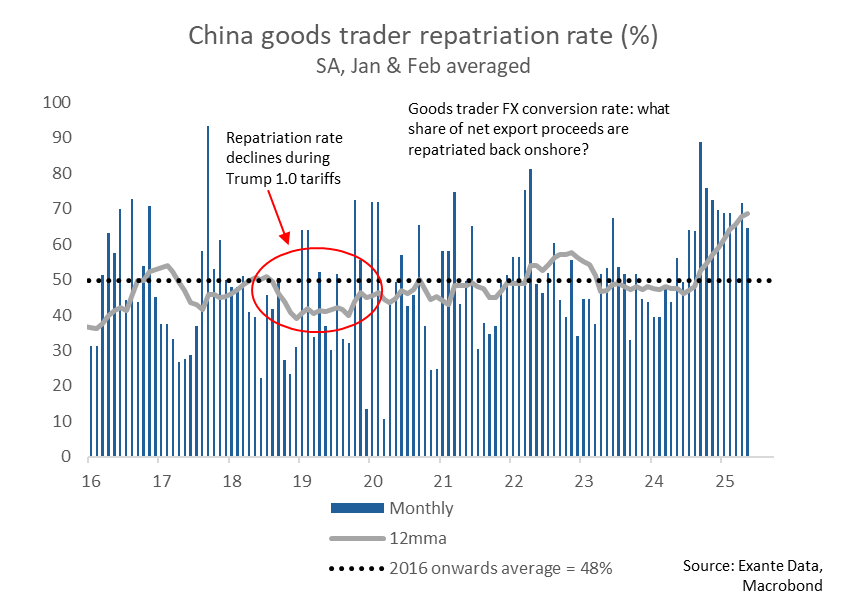
One explanation for the stability in the repatriation rate could be that the regulations around the repatriation of net export proceeds are enforced relatively consistently.
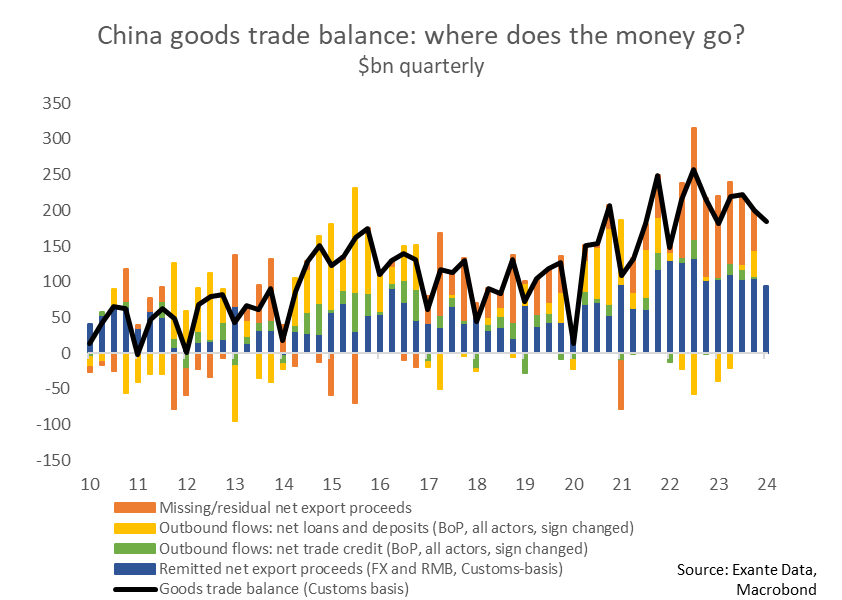
A possible reason why corporates are allowed to accumulate overseas assets (amid the at-times strict capital controls) is that Chinese companies are expanding their operations abroad through FDI into overseas markets. These flows are not large enough to explain away the size of unremitted earnings, however. Companies are also depositing export earnings with the offshore branches of Chinese banks, something that is allowed under the relevant regulations. Transactions related to trade finance can probably also explain another portion. And then some of the export proceeds are likely to embody capital flight (a topic we explored using a unique data set here). The chart below uses generous assumptions (assuming that a large share of outflows is attributable to goods traders) to “decompose” what happens to the unremitted export earnings. Despite our generous assumptions, the missing/residual unremitted earnings remain large (see more in our note here).
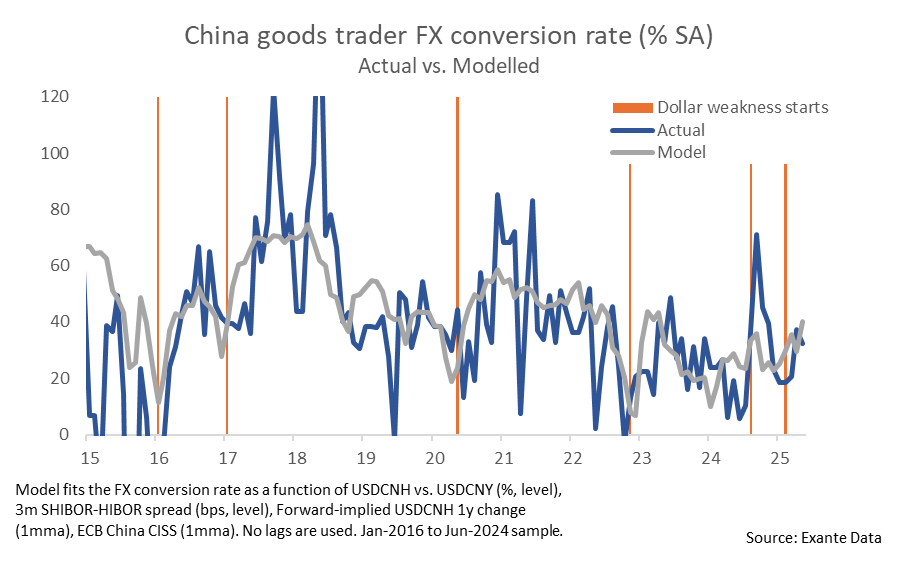
The FX conversion rate is much more volatile than the repatriation rate and, as can be seen in the chart below, tends to follow cycles. The grey line shows the modeled FX conversion rate as a function of market variables related to FX, interest rates, and financial conditions. The FX conversion rate tends to pick up when the dollar weakens, which makes intuitive sense as that should make it more attractive, all else equal, to hold renminbi assets.
The content in this piece is partly based on proprietary analysis that Exante Data does for institutional clients as part of its full macro strategy and flow analytics services. The content offered here differs significantly from Exante Data’s full service and is less technical as it aims to provide a more medium-term policy relevant perspective. The opinions and analytics expressed in this piece are those of the author alone and may not be those of Exante Data Inc. or Exante Advisors LLC. The content of this piece and the opinions expressed herein are independent of any work Exante Data Inc. or Exante Advisors LLC does and communicates to its clients.
Exante Advisors, LLC & Exante Data, Inc. Disclaimer
Exante Data delivers proprietary data and innovative analytics to investors globally. The vision of exante data is to improve markets strategy via new technologies. We provide reasoned answers to the most difficult markets questions, before the consensus.
This communication is provided for your informational purposes only. In making any investment decision, you must rely on your own examination of the securities and the terms of the offering. The contents of this communication does not constitute legal, tax, investment or other advice, or a recommendation to purchase or sell any particular security. Exante Advisors, LLC, Exante Data, Inc. and their affiliates (together, “Exante”) do not warrant that information provided herein is correct, accurate, timely, error-free, or otherwise reliable. EXANTE HEREBY DISCLAIMS ANY WARRANTIES, EXPRESS OR IMPLIED.
No posts
Comments
Nothing yet. Say the first thing.
Sign in to join the conversation.