

What is 280E and why does it matter? Section 280E of the tax code prohibits cannabis companies from deducting ordinary business expenses—rent, payroll, marketing, everything except cost of goods sold. A dispensary pays taxes on revenue minus only what it costs to buy inventory, while a coffee shop next door deducts rent, salaries, utilities, and advertising. This means cannabis operators often face effective tax rates of 50-70% instead of the normal ~26% corporate rate. [Link to 280E explainer]
Why now? Based on recent signals, there’s a real possibility we’re heading toward a an announcement in the near term. I’ve written about the potential timing, sequencing, and political strategy here:
If that happens, 280E repeal likely comes with it.
Why this exercise? With reform potentially on the horizon, there’s a lot of noise about where MSOS “should” trade on an announcement. Some are calling for $20+ targets without showing the work. This framework illustrates how 280E repeal might mechanically flow through to cannabis equity values—not a prediction of what will happen, but a transparent starting point for the conversation.
For MSOS holders who can’t easily trade the underlying names (many aren’t available on retail platforms like Robinhood), understanding the tax math matters because it’s the single biggest near-term catalyst that’s actually quantifiable. The market will do what it does, digest the news over months, and re-price as implementation details emerge. Some constituents will trade at multiples well above this range; others will dilute shareholders or face operational headwinds that override tax math. This analysis simply isolates one mechanical lever—the tax savings—while holding everything else constant. It’s a work-in-motion tool, not a recommendation.
The methodology is straightforward: freeze everything at today’s snapshot, calculate the annual tax savings from 280E repeal, convert that savings to a per-share number, then apply a range of multiples to see what the market might pay for that cash flow stream. I’ll walk through the math for the three largest MSOS holdings—Green Thumb, Trulieve, and Curaleaf—which have consistently made up two-thirds to three-quarters of the index and will drive the bulk of any move. The remaining 25% of MSOS is a mix of smaller names that tend to trade more erratically and often behave like special situations, so I model them separately using a beta parameter that captures their relative sensitivity to the top three. I’ll show how it all rolls up to the ETF and publish outputs across six different valuation scenarios. The goal is transparency—you can see every assumption, agree or disagree with the multiples, and stress-test your own view (these are ballpark numbers for educational purposes).
This analysis answers one narrow question: If 280E disappears tomorrow and nothing else changes, what’s that tax savings worth to the stock?
I’ve frozen everything at today’s snapshot—prices at Green Thumb $8.50, Trulieve $8.50, Curaleaf $3.00, and MSOS $5.00—and locked down all the operational numbers: revenue, EBITDA, depreciation, interest, capex, working capital, debt, and share counts. Between “before” and “after,” only the tax line moves.
Here’s the logic: Right now these companies pay punitive taxes under 280E. In a normalized world, they’d pay roughly 26% (21% federal plus 5-6% state). The difference between what they pay now and what they’d pay at 26% is the annual tax savings—I call this ΔTax (delta tax).
I convert that annual savings into a per-share number, then ask: What’s a perpetual stream of extra cash flow worth? The answer depends on the multiple you apply—6×, 8×, 10×, etc. Think of it like a P/E ratio but applied purely to the tax benefit. Multiply the per-share savings by your chosen multiple, and you get a per-share uplift. Divide that by today’s stock price, and you get a percentage move.
For MSOS, I weight the top three holdings (Green Thumb, Trulieve, Curaleaf) at 75% of the fund and use a simple assumption—called β (beta)—to estimate how the remaining 25% behaves relative to the big three.
I’m using these estimates for annual 280E tax savings (ΔTax):
Green Thumb: $100 million
Trulieve: $90 million
Curaleaf: $110 million
With share counts of roughly 253 million (Green Thumb), 205 million (Trulieve), and 827 million (Curaleaf), the per-share annual savings are:
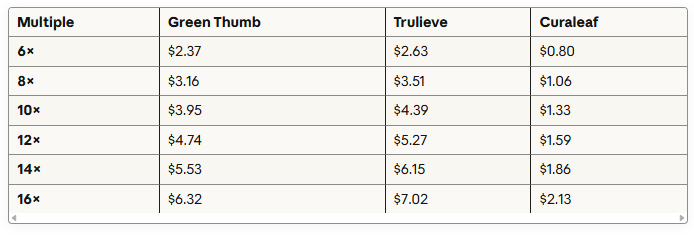
Green Thumb: $0.395 per share
Trulieve: $0.439 per share
Curaleaf: $0.133 per share
When you capitalize that annual per-share savings at different multiples (think of it as “how many years of savings is the market willing to pay for upfront?”), you get a range of potential stock uplifts. I’ve shown a 6× to 16× range to bracket realistic outcomes: 6× represents a conservative, distressed-asset multiple; 16× approaches what high-quality consumer staples or specialty retailers might command. Where you land in that range depends on your view of execution risk, competitive positioning, and whether you think these normalize into mature, profitable businesses or remain structurally challenged. Pick your multiple based on your conviction.
Per-Share Uplifts by Multiple:
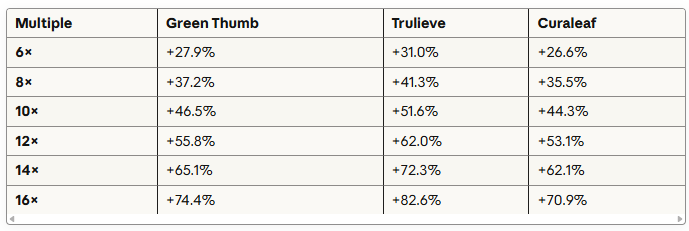
Translated into percentage moves from today’s prices ($8.50 for Green Thumb and Trulieve, $3.00 for Curaleaf):
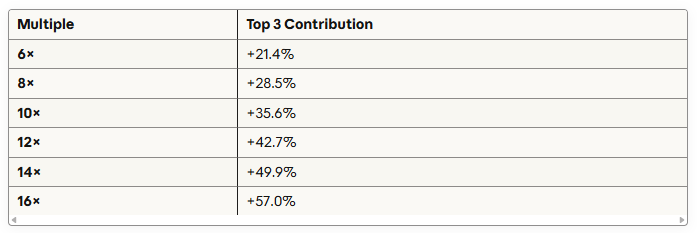
The top three holdings make up 75% of MSOS by weight:
Green Thumb: 23.9%
Curaleaf: 26.1%
Trulieve: 25.0%
When I weight their percentage moves together, the contribution from just these three names is:
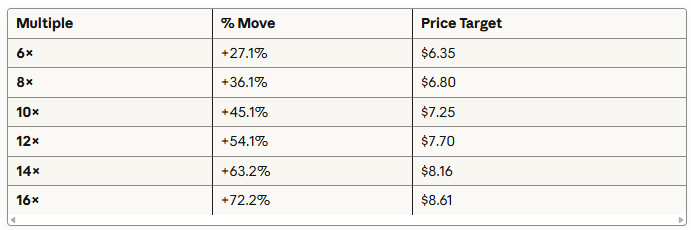
The remaining 25% of MSOS is a mix of smaller names. I model three scenarios based on how sensitive they are compared to the top three:
Scenario 1 – In-Line (β = 1.0): The smaller names move exactly like the top three average
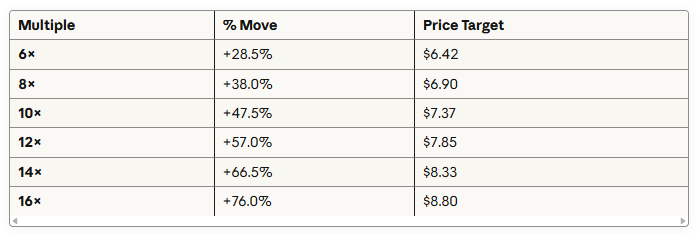
Scenario 2 – Higher Sensitivity (β = 1.2): The smaller names move 20% more than the top three (more volatile)
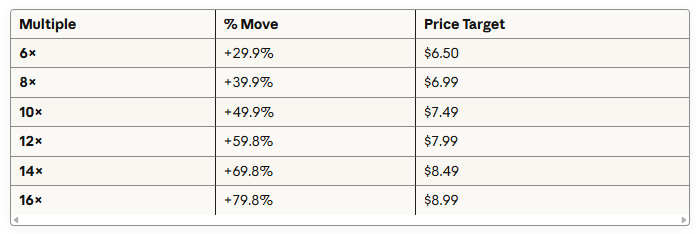
Scenario 3 – Conservative (β = 0.8): The smaller names move 20% less than the top three (more subdued)
This analysis deliberately leaves out several important factors:
Business Quality Isn’t Priced In: I’m only valuing the tax savings, not whether the underlying business deserves a higher or lower multiple. If you think a normalized cannabis company should trade like a high-quality retailer or CPG name, that’s a separate layer on top of this.
Tax Loss Carryforwards (NOLs): Some of these companies have big NOL balances that would shield cash taxes even after 280E goes away. That would make free cash flow even higher than shown here—I’m not modeling it.
No Market-by-Market Analysis: I’m not re-underwriting pricing, competitive dynamics, or margin trends in individual states. This is purely an announcement-day math exercise.
Share Counts Are Frozen: Many of these companies will issue more stock between now and implementation. This snapshot uses today’s fully diluted shares—not a forecast of future dilution.
One-Size-Fits-All Multiples: I’ve shown a 6× to 16× range, but in reality some names within MSOS will command multiples well above this range; others will dilute shareholders or face execution issues that undermine the math entirely.
Timing: You could anchor the tax savings to last year’s numbers or next year’s estimates—either works as long as you keep everything else frozen. This isn’t trying to predict future earnings.
Uplisting and Institutional Capital: This framework ascribes zero value to what may be the biggest driver of all—access to major exchanges and institutional capital. Right now these companies trade OTC because marijuana is federally illegal, which locks out most institutional investors due to compliance restrictions, mandates, or simple liquidity concerns. Schedule III reclassification would likely open the door to Nasdaq/NYSE uplisting, and the buyer universe would expand exponentially overnight. Pension funds, index funds, traditional asset managers—entire pools of capital that currently can’t or won’t touch the sector—could suddenly allocate. That demand dynamic isn’t in this math at all. I’m only valuing the tax savings, not the re-rating that comes from 10× or 50× more buying power entering the market.
No Retroactive Refunds: Many of these companies have been paying punitive 280E taxes for years—in some cases, hundreds of millions of dollars in cumulative excess tax payments. This framework assumes zero recovery of past taxes paid. If there’s any mechanism for refunds, credits, or carryback provisions in the final legislation, that would represent additional upside not captured here. We’re only valuing the go-forward annual savings, not any one-time recapture of historical overpayments.
Market Dynamics and Competitive Risks: This analysis also ignores how reform itself might change the underlying economics. Easier access to capital could accelerate supply growth and put downward pressure on pricing in oversupplied markets. Lower barriers to entry might increase competition. Conversely, compliance costs could rise, or operators might face new federal regulations that offset some of the tax benefit. Consolidation could reshape the competitive landscape—some of these names might get acquired, others might be the acquirers, and integration risk cuts both ways. Interstate commerce, if it opens up, could fundamentally alter regional moats and margin structures. None of that is modeled here—this is purely a snapshot of the tax math, not a forecast of how the business environment evolves post-reform.
For one way of thinking about a process for constructing a trade please see here (click on picture below that takes to the full note):
You can take these numbers, overlay your own view on which multiple makes sense, adjust the beta assumption for the MSOS tail, and stress-test against your conviction on execution and competitive positioning.
The market will ultimately do what it does—digest the announcement, re-price volatility over days and weeks, then spend months incorporating implementation details, management execution, competitive dynamics, and capital allocation decisions. Some names will vastly outperform this math; others will underperform it badly.
Use this to think through the pure tax mechanics, then layer in everything else that actually drives long-term value: quality of management, market positioning, balance sheet strength, ability to access capital post-reform, and whether the business model works when the playing field normalizes. The tax benefit is real and quantifiable—but it’s just one piece of a much more complex puzzle.
This framework offers one way to think about the mechanical tax benefit from 280E repeal. It’s a starting point, not the full story—the market will layer in execution risk, capital allocation, competitive positioning, and everything else that drives long-term value.
If this piece meant something to you, share it with someone who could benefit. Share it with someone who tells you that you don’t need a process and to focus on outcomes.
I’ll be writing more on governance, activism, dark arts trades, and investment process. I’ve lived and breathed these for years. I’ve also written about tokenization, Formula One, the NBA, and sometimes just tell a story worth remembering. Stay tuned.
You can also find me on Twitter at @MrMojoRisinX and @BeWaterltd.
No posts
Comments
Nothing yet. Say the first thing.
Sign in to join the conversation.