
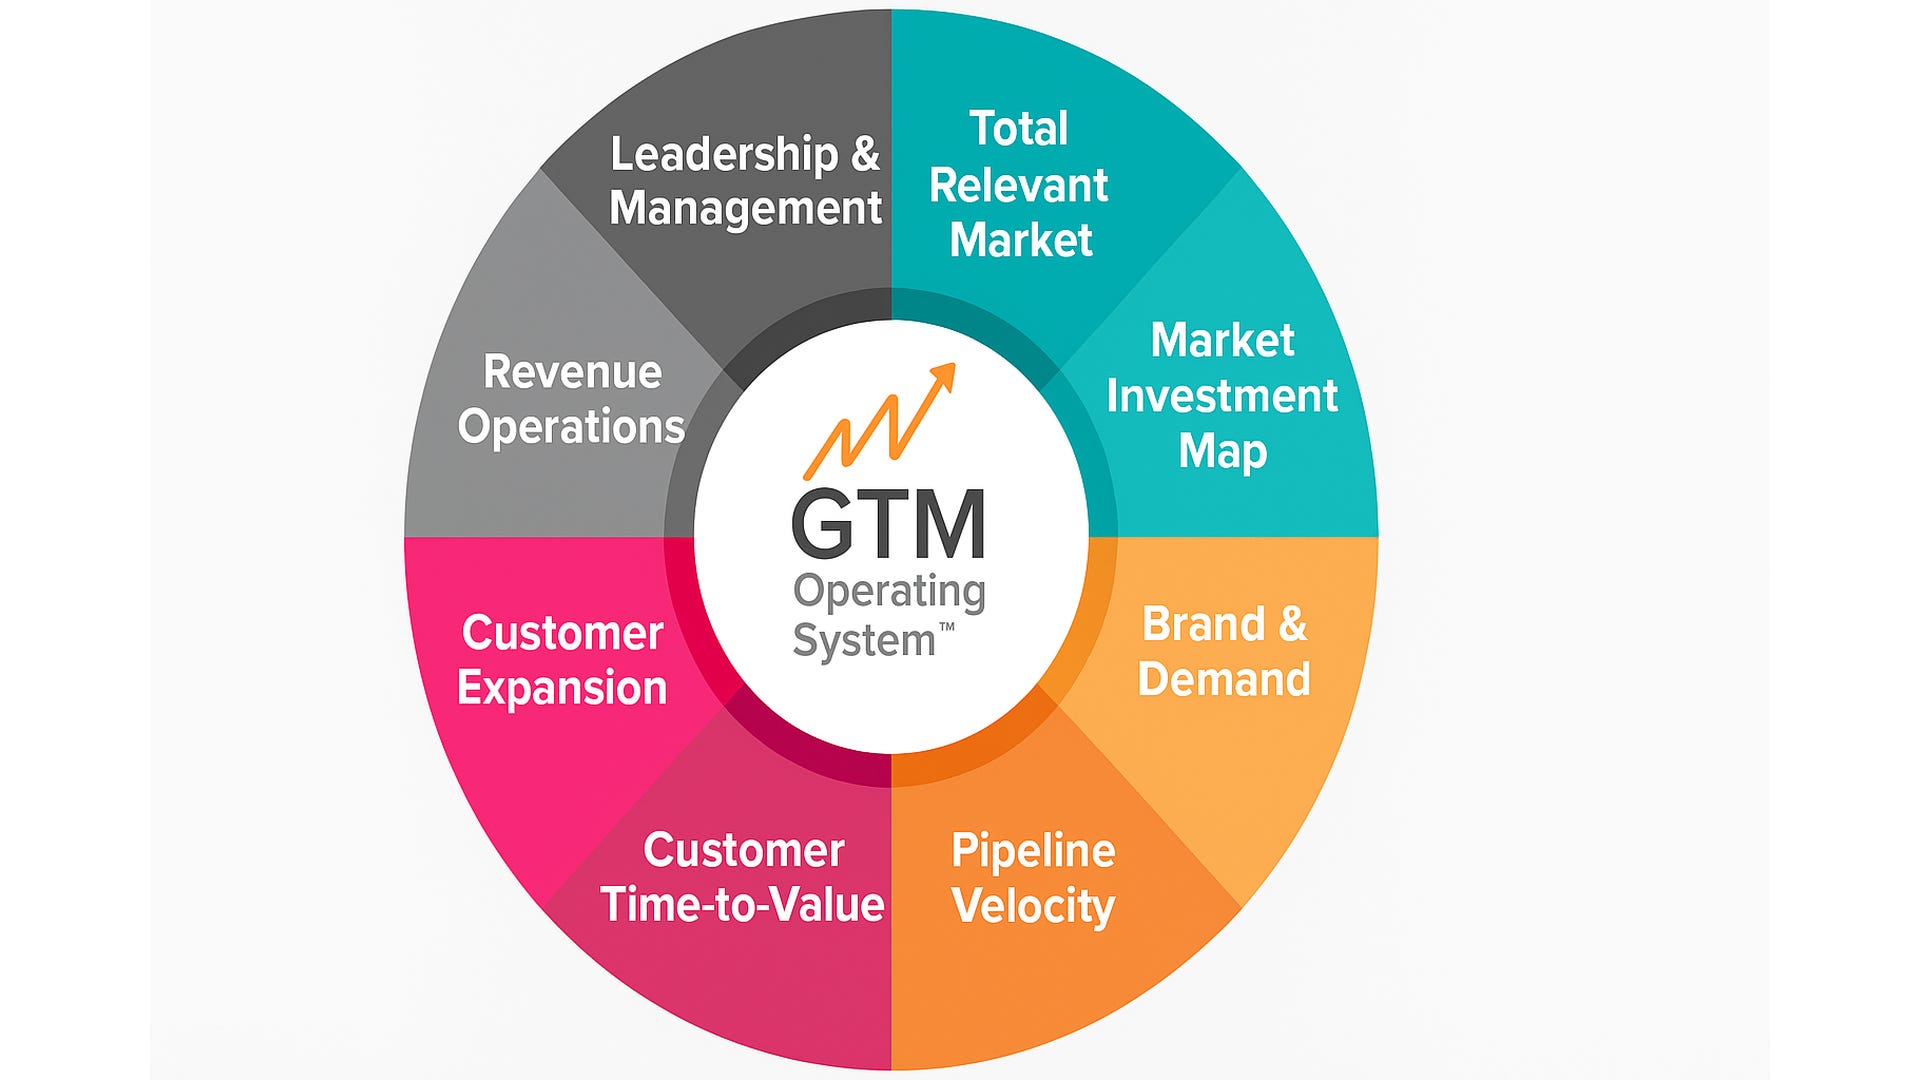
For the last two weeks, the audit has been about the foundation. Week 1 reframed the premise: most GTM problems are misdiagnosed, and the fix is a system-level diagnostic, not another execution patch. Week 2 audited the market layer — whether you’re aiming at the right accounts and investing where you can actually win.
This week we move from strategy to motion. Once you’ve established who you should be targeting and where you should be investing, two questions determine whether that strategy produces revenue:
Are you generating enough of the right demand?
And once that demand becomes a deal, does it move?
These are Pillars 3 and 4 of the GTM Operating System — Brand & Demand and Pipeline Velocity. They are where most early-stage companies feel their pain most acutely, because they’re the pillars that show up on the board deck. Pipeline is light. Deals are slipping. The forecast is soft. Win rates are inconsistent. Everyone feels it, but very few teams can tell you precisely where in the engine the friction lives.
That’s what the demand and velocity audit is for. It separates the feeling that something is wrong from the data that tells you what is wrong — and, more importantly, which of the four velocity levers is actually constraining your growth.
There’s a specific trap that catches growth-stage revenue teams, and it’s worth naming directly: activity feels like progress, and busyness feels like momentum. Marketing is shipping campaigns. SDRs are booking meetings. AEs are running demos. The CRM is full of opportunities. By every visible measure, the team is working hard.
And yet the revenue isn’t moving the way the activity suggests it should. The disconnect is almost always hiding in one of two places: the demand being generated isn’t the right demand, or the pipeline that demand creates isn’t actually converting at the speed the model assumes.
The first failure — generating the wrong demand — is the Pillar 3 problem. For years, B2B marketing measured itself by lead volume. Big MQL numbers meant high-fives in the marketing meeting. But ask the sales team about those leads and you’d get eye-rolls. The GTM Partners framework is blunt about this: reducing a complex, non-linear buying journey to a couple of form fills is like trying to understand an ocean by measuring puddles.
The second failure — pipeline that doesn’t convert — is the Pillar 4 problem. A pipeline that looks healthy on a dashboard can be quietly broken: deals stuck in a stage for months, win rates that have drifted down, sales cycles that have crept up by weeks without anyone noticing. The pipeline number looks fine. The velocity is collapsing.
Pipeline velocity (a.k.a. Sales Velocity) is to your revenue engine what blood pressure is to your body — a vital sign that tells you whether the system is healthy long before the symptoms become a crisis.
The demand and velocity audit forces both failures into the open. It asks you to stop measuring effort and start measuring throughput — and to be specific about where the throughput is breaking down.
The guiding question of Pillar 3, in the GTM Partners framing, is this:
How will we engage our customer with a differentiated point of view — and how will we run programs to both create and capture demand using that narrative?
The audit examines three diagnostic zones: whether you have a differentiated POV, whether you’re balancing demand creation against demand capture, and whether you’re measuring demand by revenue contribution or by vanity.
Start with the brand foundation, because everything downstream inherits its weakness. The question isn’t whether you have a logo and a color palette. It’s whether your market knows who you are, what you stand for, and why you’re different from the alternatives — including the alternative of doing nothing.
The framework’s test here is sharp: have you named your enemy? The strongest early-stage brands position against something — the status quo, a painful manual process, an incumbent’s broken model. A workflow automation company positions against manual drudgery. An analytics company positions against the idea that only enterprises deserve good data. The enemy gives your POV a shape that prospects can recognize and repeat.
If your messaging could be lifted and dropped onto a competitor’s website without anyone noticing, you don’t have a differentiated POV — you have category-standard description. And category-standard description forces your entire demand engine to work harder, because nothing about your story does any of the selling for you.
Healthy signal: Prospects arrive at sales conversations already primed — they reference your content, your point of view, your framing of the problem. Reps report that buyers are partway sold before the first call.
Unhealthy signal: Every deal starts cold. Reps are explaining who you are and why the problem matters from scratch on every first call. Your messaging is interchangeable with three competitors.
This is the zone where most early-stage demand engines are quietly out of balance. There are two distinct jobs your demand programs must do, and most companies are only doing one of them well.
Demand capture reaches buyers who are already in-market, actively searching for a solution like yours — paid search, review sites, high-intent retargeting.
Demand creation generates interest among buyers who don’t yet know they have the problem you solve, or don’t yet know a solution exists — thought leadership, point-of-view content, the dark-funnel work that builds familiarity before a buyer ever fills out a form.
The trap is that demand capture is measurable and demand creation is not — at least not easily. So teams over-invest in capture because they can see the attribution, and under-invest in creation because they can’t. The result is a company fighting over the small slice of the market that’s actively buying right now, with rising costs and falling returns, while doing nothing to expand the pool of future buyers who already trust them.
The audit question is whether your demand mix reflects a deliberate choice or just the gravitational pull of what’s easy to measure. A company relying entirely on capture is renting pipeline at auction prices. A company relying entirely on creation is building awareness it never converts. The healthy state is a deliberate balance — and an honest acknowledgment that the dark funnel is real even when your attribution model can’t see it.
Healthy signal: You invest in both capturing in-market demand and creating future demand. You accept that some of your best pipeline is self-sourced and attribution-dark, and you don’t kill brand programs just because last-touch attribution can’t credit them.
Unhealthy signal: Your entire budget chases in-market buyers through paid channels. Costs are rising, returns are falling, and you have no engine creating the demand you’ll need to capture next year.
The final Pillar 3 zone is about the scoreboard. What does marketing report — leads, or pipeline? The distinction sounds semantic. It is not. It changes behavior across the entire revenue org.
When marketing is measured on lead volume, it optimizes for the cheapest leads it can generate, regardless of whether those leads ever become pipeline. When marketing is measured on pipeline contribution — sourced and influenced revenue — it optimizes for the campaigns and channels that produce opportunities that actually convert. The GTM Partners framework treats this shift as foundational: when marketing reports “we drove this much new pipeline” instead of “we generated this many leads,” it speaks the CRO’s and CFO’s language, and the marketing-sales alignment fights largely disappear.
Healthy signal: Marketing and sales share a single scoreboard: pipeline generated and revenue influenced. Marketing can tell you which channels produce opportunities that win, not just which produce cheap leads.
Unhealthy signal: Marketing celebrates MQL volume. Sales complains about lead quality. The two teams are looking at different scoreboards and quietly blaming each other for the pipeline gap.
If Pillar 3 is about filling the top of the funnel with the right demand, Pillar 4 is about how fast and how reliably that demand turns into revenue. And here the framework gives us something rare in GTM — a single equation that ties the whole system together.
Pipeline velocity is quantified by four levers:
Sales Velocity = (Number of Qualified Open Opportunities × TTM Win Rate × Average Deal Size) ÷ Average Months to Close
Multiply the first three, divide by the cycle length, and you get a velocity figure — revenue per month. As a worked example: 10 qualified opportunities, a 20% win rate, a $50,000 average deal, and a 6-month average cycle produces roughly $16,700 per month of sales velocity. The number itself matters less than what it reveals — that growth is a game of four levers, and every one of them is a place the engine can break.
This is the single most useful diagnostic in the entire audit, because it converts a vague feeling (”our pipeline feels slow”) into a precise question (”which of these four levers is underperforming, and what would moving it do to our revenue?”).
You can’t fix “we need more revenue.” You can fix “our win rate dropped from 25% to 18% over two quarters.” The velocity formula is what turns the first sentence into the second.
The audit walks each lever in turn, and the discipline is to look at trend, not just snapshot. A single quarter’s numbers tell you where you are. The trend across three or four quarters tells you what’s actually happening to the engine.
Lever 1 — Number of qualified opportunities. Is your pipeline volume sufficient for your target, at the coverage ratio your win rate implies? Most CROs want 3–4x pipeline coverage against quota. The audit question isn’t just “do we have enough pipeline” — it’s “is the pipeline we have actually qualified, or is it inflated with deals that will never close?”
Lever 2 — Win rate. What percentage of qualified opportunities do you win, and which way is the trend moving? A declining win rate is one of the earliest signals of an upstream problem — usually poor qualification (the wrong deals are entering pipeline) or a positioning gap (you’re losing to a competitor or to “no decision”). A small win-rate improvement compounds enormously: 20% to 25% is a 25% revenue lift with no additional pipeline.
Lever 3 — Average deal size. Is your average contract value growing, flat, or shrinking? Shrinking ACV can indicate you’re drifting down-market, discounting to close, or failing to package and price for the value you deliver. Growing ACV — through better targeting, premium packaging, or multi-year terms — increases velocity without requiring a single additional opportunity.
Lever 4 — Sales cycle length. How long does a deal take to close, and is that number creeping up? Time kills deals. A lengthening cycle is often the clearest evidence of friction — stalled stages, procurement bottlenecks, too many stakeholders, or reps who aren’t reaching the actual decision-maker. Shortening the cycle from 90 days to 60 is a direct, immediate boost to velocity.
The velocity formula tells you the system’s overall health. To find the specific bottleneck, you have to map conversion stage by stage. Pull the average number of days a deal spends in each stage, and the conversion rate from each stage to the next.
This is where the real diagnosis happens. A pipeline that looks healthy in aggregate often has one stage where deals go to die — a proposal stage where opportunities sit for 45 days, a demo-to-proposal conversion that quietly drops to 30%. The aggregate velocity number tells you the engine is underperforming. The stage map tells you which cylinder is misfiring.
Healthy signal: You can state your velocity figure and all four levers from memory, with trends. You know your stage-by-stage conversion rates and average days-in-stage. When a deal stalls, you know within the week, because you’re watching the stages, not just the total.
Unhealthy signal: You manage pipeline by gut and by the total number on the dashboard. You can’t say which stage leaks the most, your sales cycle is a guess, and you discover slipped deals at the end of the quarter when it’s too late to act.
Consider a Series A company doing $3M in ARR. The team feels good. Inbound is steady, the SDRs are hitting their meeting targets, the pipeline number on the board deck looks healthy at roughly 3.5x coverage. And yet they’ve missed the number two quarters running, and no one can quite explain why.
Run the velocity audit, and the story changes. The pipeline coverage is real, but the win rate has slid from 24% to 16% over three quarters — a collapse hiding in plain sight because the total pipeline number kept growing. Map the stages, and the leak appears: demo-to-proposal conversion has fallen off a cliff. Prospects are taking the demo, then going quiet.
Now the demand side comes into focus. The SDRs are booking meetings, but they’re booking the wrong meetings — capturing anyone who responds rather than the in-market, ICP-fit buyers the model assumes. The leads look fine at the top of the funnel and fall apart after the demo, because they were never qualified to begin with. The marketing team, measured on lead volume, has been optimizing for exactly this: cheap leads that book meetings and never convert.
The company didn’t have a sales problem. It had a Pillar 3 problem (demand quality, measured by the wrong scoreboard) that manifested as a Pillar 4 symptom (collapsing win rate at a specific stage). No amount of sales coaching would have fixed it, because the deals entering the pipeline were structurally unlikely to close. The audit found in an afternoon what two quarters of effort had missed — because it looked at the system, not the activity.
For founders raising at Series A and beyond, Pillars 3 and 4 are where investors separate a repeatable revenue machine from a series of heroic one-off deals. They will not just ask how much pipeline you have. They will ask where it comes from, how reliably it converts, and whether you can forecast it.
The questions map almost exactly onto the audit.
How is your pipeline generated, and is that source repeatable?
What’s your win rate, and how has it trended?
How long does a deal take to close, and has that stayed consistent as deal sizes grew?
How accurate are your forecasts?
A founder who has run the velocity audit can answer all of these with numbers and trends. A founder who hasn’t will answer with anecdotes — and investors can tell the difference instantly.
The companies that command premium valuations at this stage are the ones that can show a brand creating durable demand (not just renting it through paid channels) feeding a pipeline that converts at predictable, improving velocity. That combination — pull from the brand, throughput from the pipeline — is what produces hockey-stick growth without hockey-stick burn. It’s also exactly what the demand and velocity audit is built to surface.
Work through these as you audit Pillars 3 and 4 this week. As always, the value is in the honest answer, not the comfortable one.
1. Have you named your enemy? Could a prospect repeat your differentiated POV back to you — or is your messaging interchangeable with competitors?
2. Do prospects arrive at sales conversations already primed by your content, or does every deal start cold?
3. What’s your actual split between demand creation and demand capture — and is it a deliberate choice or just what’s easy to measure?
4. Does marketing report on pipeline and revenue influenced, or on lead volume?
5. When sales and marketing disagree about lead quality, do they have a shared scoreboard to resolve it — or two separate ones?
6. Can you state your sales velocity figure and all four levers right now, with their trends over the last 3–4 quarters?
7. Which of the four levers is your biggest constraint today — opportunities, win rate, deal size, or cycle length?
8. What’s your stage-by-stage conversion, and which stage leaks the most deals?
9. How has your win rate and average sales cycle trended — improving, flat, or quietly degrading?
10. Do you discover stalled and slipping deals early enough to act, or only at the end of the quarter?
Most teams that run this audit honestly will find that the problem they’ve been treating as a sales execution issue is actually a demand quality issue, a measurement issue, or a single broken stage in the pipeline. That’s the recurring lesson of the GTM audit:
The symptom and the cause are rarely in the same place, and effort spent on the symptom is effort wasted.
Next week: the Customer Audit. We move past the close to ask whether your customers are reaching value fast enough to stay, and whether you’re growing the revenue you already have — Pillars 5 and 6, Customer Time-to-Value and Customer Expansion.
Want to benchmark your demand and velocity findings against the full framework? The GTM Maturity Assessment scores you across all eight pillars and pinpoints which lever is actually constraining your growth. I’ll share how to access it in this week’s companion posts. And if the audit surfaces a velocity problem worth solving, fractional GTM engagements are built for exactly this diagnostic-to-execution work.

No posts
Comments
Nothing yet. Say the first thing.
Sign in to join the conversation.