
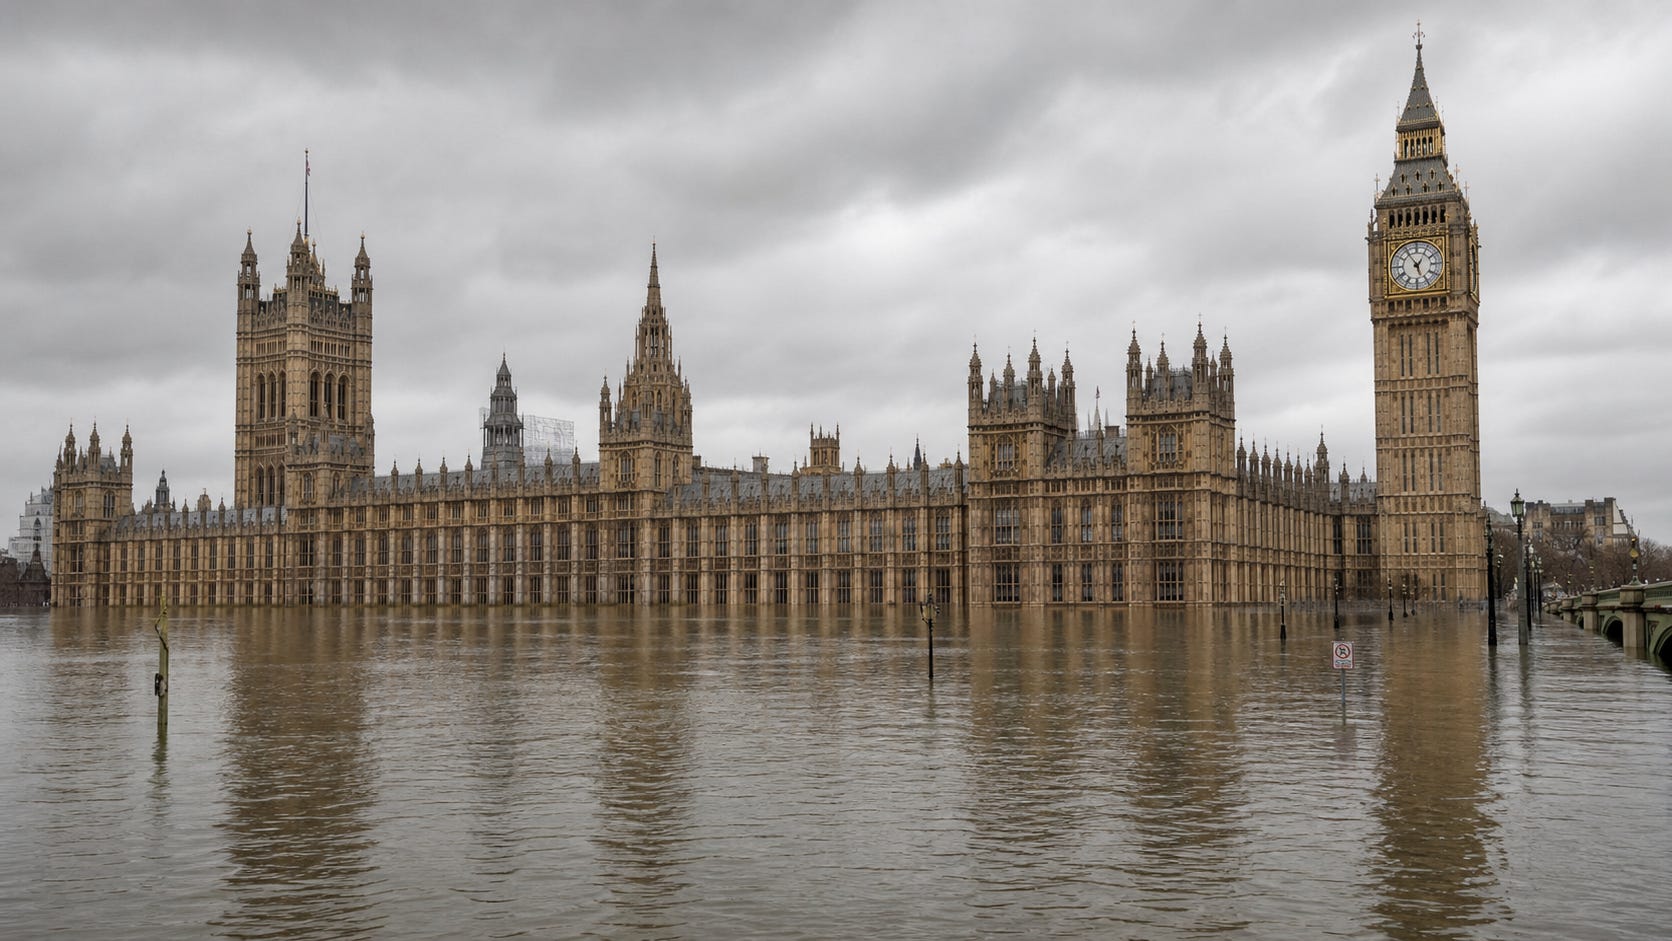
I’m not going to do a full literature review on climate-related sea level rise. I’m going to give you my view on how it might play out and why it matters - as well as using sea level rise as an good example of how the implausible RCP 8.5/SSP5-8.5 scenario has polluted the science and our understanding of risk.
Before I start, if you like my work, please make sure you subscribe to Thoughts of Chairman Michael, Cleaning Up on podcast or YouTube, and the Cleaning Up newsletter. And please tell friends, family and colleagues to do the same. Your support and encouragement means a lot to me.
First of all, the sea level is rising*. The EU’s Copernicus Climate Change Service reports that satellite altimetry indicates an average global mean sea level rise of 3.64 mm per year since 1999, that’s a total of 9.4cm this century.
Not exactly Waterworld.
Also important is the fact that the rate of sea level rise has been accelerating. The best estimate of the rate between 1901 and 1971 (confidence interval of 0.6 to 2.1mm) was just 1.3mm per year, according to the IPCC’s sixth Assessment Report (AR6), published in 2023. Between 1971 and 2006 that increased to 1.9 mm per year, and between 2006 and 2018 it had further increased to 3.7 mm per year.
Data from the EU Copernicus Climate Change Service on sea levels shows a similar trend: the rate of sea level rise in the first decade of this century was 2.92 mm per year, but for the most recent decade between 2015 and 2025 it was 3.84mm per year.
Why is the rate accelerating? IPCC AR6 is pretty clear: “the Human influence was very likely the main driver of these increases since at least 1971”. In IPCC-speak very likely means more than 90% probability.
So the sea level is rising, the rate of increase is accelerating, which is almost certainly our fault - which means the rise will almost certainly continue to accelerate.
Yikes!
Regular readers will know that I like doing very simple spreadsheets to explore linkages and check orders of magnitude. So before we look at the projections in the climate and geoscience literature, let’s do that.
If there’s no acceleration in the rate of sea level rise this century, we are looking at 37cm of sea level rise by 2100. So that is the lowest bound for what we should expect.
The acceleration we have already seen between the first decade of the century and the most recent decade (based on Copernicus data) shows an increase in the rate of sea level rise of 30.8% - which translates into around 20% per decade. If we see the rise continue to accelerate at that rate through to the end of the century, the rate of sea level rise would increase to 16mm per year by the end of the century.
That’s a 4.2x increase in the rate of sea level rise, but it doesn’t result in 4.2x as much actual sea level rise. Because of the wonders of geometric growth, most of the next 74 years even in that acceleration scenario the rate of rise is closer to todays - so we are still only looking at an increase of 75cm by 2100.
To me, acceleration of 20% each and every decade for 7 decades feels pretty feisty. I’m not saying it would be impossible - I’m not a geophysicist but I am an engineer, and I have a sense of what would be involved in terms of heat flows. We’ll get back to the long tail later.
For the moment, based on the rates of rise we see today, and pretty aggressive assumptions for potential acceleration, I would expect total sea level rise to be somewhere in the 37cm to 75cm range by 2100 - including the 9cm we have seen so far since the start of the century.
With that background, let’s take a look at the projections in the scientific literature, as summarised by IPCC AR6.
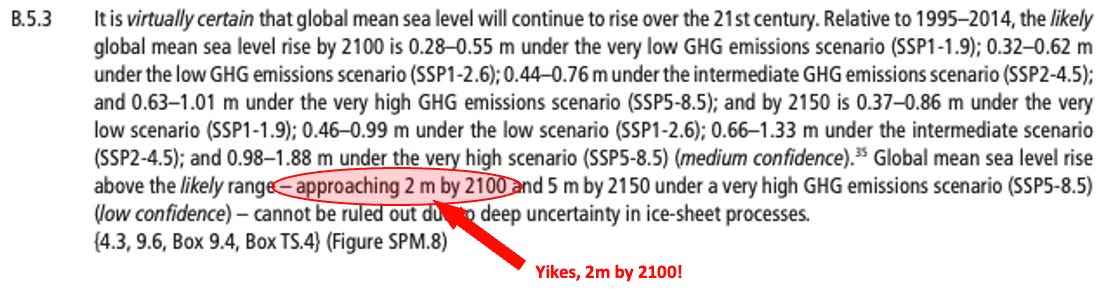
Yikes, 2 metres of sea level rise by 2100, that’s a lot! Be scared! Be very scared! Produce maps of cities under water!
Let’s dig in though, not just because we are trying to get a handle on expected sea level rise, but also because it will illustrate the problem with using RCP 8.5 / SSP5-8.5, the scenarios scientists have just deemed implausible, as I explained in my last post.
First of all, the paragraph says “it is virtually certain that global mean sea level will continue to rise over the 21st century.” In IPCC-speak virtually certain means more than 99% probability. But that doesn’t say anything about whether the rate of increase will accelerate, so it really doesn’t tell us much at all.
Here are the key modelled projections for total expected sea level rise over the course of the century - 2100 relative to 1995–2014 - under different scenarios:
28 to 55 cm under the very low GHG emissions scenario (SSP1-1.9);
32 to 62 cm under the low GHG emissions scenario (SSP1-2.6);
44 to 76 cm under the intermediate GHG emissions scenario (SSP2-4.5);
63 to 101 cm under the very high GHG emissions scenario (SSP5-8.5);
Finally there’s this: we can’t rule out sea level rise of as much as 2 metres by 2100 under the very high GHG emissions scenario (SSP5-8.5). That’s the long tail, but it’s stated with “low confidence”, which means some combination of limited evidence or disagreement between IPCC authors.
The IPCC doesn’t assign probabilities to scenarios, so other than knowing that we can ignore anything based on RCP 8.5 / SSP58.5 we’re on our own.
If you map plausible energy scenarios from those working at the heart of the energy system - EIA, BloombergNEF, Rystad, WoodMac, the oil majors, etc - what you find is that the nearest scenario to reality is the middle-of-the road SSP2-4.5 (I personally think we will do better than that, as momentum behind clean energy continues to accelerate). That translates into sea level rise of 44 to 76cm of increase by 2100.
Things are looking a lot less scary. Though hold your horses, 75 cm of sea level rise is still a big deal, and definitely enough to require a society-level response.
Why is the inclusion of RCP 8.5/SSP5-8.5 so problematic? First of all it’s that figure of 1 metre of sea level rise. As we shall see, we can’t rule it out even under plausible scenarios, but there it is in black and white, polluting the information space.
Worse than that, the paragraph from IPCC AR6 goes on to include the upper end of poorly-understood uncertainty about ice-sheet processes under RCP8.5/SSP5-8.5 - citing a sea level rise of 2 metres by 2100 and 5 metres by 2150, that can only charitably be described as science fiction.
The system, however, is rigged to emphasise that most extreme figure. If you are a journalist, you get more clicks writing about 2 to 5 metres of climate change than 76 cm, so you anchor your output to RCP 8.5 / SSP5-8.5 - and I can’t blame you. If you are an activist, trying to spur emissions reductions or get your municipality to invest in sea walls, you highlight the most dramatic risk - and I can’t blame you. If you are a student, worrying about the world you will inherit, you have nightmares about the most apocalyptic outcome - and I can’t blame you.
If you are a geoscience researcher, it’s better for your career if your papers get noticed, so you anchor them to RCP 8.5 / SSP5-8.5. But I do blame you - and even more so your peer reviewers. From the moment of publication in Nature of Emissions – the ‘business as usual’ story is misleading in January 2020, you had no excuse not to know RCP 8.5 / SSP5-8.5 was implausible: this is your job. Now there are 105,000 papers that use RCP8.5/SSP5-8.5, and more are still being written every week, a large proportion of which treat RCP 8.5/SSP5-8.5 explicitly or implicitly as Business as Usual. If they do, they must not be allowed to pollute the next IPCC Assessment Report, due in 2028 or 2029.
At this point, I know there are people thinking “OK Michael, but if you agree that we need a society-scale response anyway, what’s the problem? Surely the worse the picture we paint, the greater sense of urgency, and the more likely we are to take action on climate change.”
There are four reasons why I strongly disagree with this position:
The first is that, using an implausible scenario to justify decisions that are costly, disruptive or threaten incumbent interests is enormously unwise. You create a huge attack surface for opponents. All they need to do is say “look, this is all based on a scenario in which the world is burning 7x more coal by 2100, which is simply not happening. It’s being promoted by eco-extremists and we should ignore them.” So we are looking at levels of sea level rise with real consequences, but you have weakened the case for doing something about it, not strengthened it.
The second reason is that it risks wasting resources. I was on the board of Transport for London between 2012 and 2018, ending up chairing the Sustainability Panel. I pushed the organisation hard to build emissions and climate risk into its decisions, for instance by considering the carbon implications when buying new rolling stock for the Tube. If you believe there might be 2 metres of sea level rise by 2100, you have to start allocating money to upgrading the Thames Barrier immediately. If you believe the figure will be 44 - 76cm, you can wait at least until more data comes in. We are talking about huge amounts of real money that could be spent either on providing transport services or on climate protection.
The third reason is, if you know the main scenario used to justify action is implausible, continuing to promote it is unethical, even immoral. Think of all the crocodile tears shed over young people suffering from climate anxiety by people who have made a living promoting climate anxiety. If you think I am exaggerating, watch Rupert Read at the Schools Climate Conference, UCL 3 July 2019, jumping on the desk in front of a room of 12-year-olds and telling them “People probably sometimes ask you what are you going to be when you grow up. But we have reached a point in human history where the question also has to be asked what are you going to do if you grow up.” There is no cause so noble it justifies terrorising kids like that.
The fourth reason is that we are now left knowing nothing about the real tail risk presented by tipping points or non-linear ice sheet processes. We know that under RCP 8.5/SSP5-8.5, these could have resulted in 2 metres of sea level rise by 2100, but that’s not relevant because we are not following that scenario. We are following something like RCP 4.5/SSP2-4.5, but there is no way of translating from 2 metres of sea level rise under RCP 8.5 to a potential extreme outcome under RCP 4.5/SSP2-4.5. To use an analogy: if we want to know how long it takes for a pan of milk to boil over on hob setting 5, it’s absolutely no use knowing that it boils over in 2 minutes on hob setting 10. It might boil over in 4 minutes, but it might never boil over at all. The process of milk boiling over is non-linear - just like the process of ice sheets collapsing.
</wonk zone>
There is a another problem with the way the sea level scenarios are presented in the AR6 summary for policy-makers. It’s a bit wonky, so skip this section if your eyes glaze over.
The way IPCC scenarios work is that the experts first create a number of plausible (yes, they were always meant to be plausible) storylines for the how the world might develop - population, economic growth, openness to trade, etc - called Shared Socioeconomic Pathways (SSPs). Within each of these, they create baseline scenarios, i.e. what happens if there is no climate action, and scenarios with more or less aggressive mitigation of emissions.
Go back to the scenarios in the AR6 summary for policy-makers on sea level rise. Only one of them is a baseline and, you guessed it, it’s the dreaded SSP5-8.5. If your question is know how bad sea level could get in the absence of climate action, that is the only scenario you can turn to. All the other scenarios cited involve additional actions on climate change.
Suppose you want to know how much pain, suffering and financial loss could be averted if sea level rise is reduced by mitigating emissions. Under the only baseline scenario on offer, SSP5-8.5, you end up with sea level rise of 63 to 101cm by 2100. But if you can jump to even the mildest mitigation scenario, SSP2-4.5, sea level rise will only be 44 to 76cm. You would have have saved 19-25cm of sea level rise, with all the harms that would have brought. You’re a hero, right?
Wrong. The problem is that two scenarios cannot be compared in this way. In the SSP5 storyline, the global population is 9 billion by 2100, whereas in SSP2 it is just 7 billion. They are simply two very different future worlds, and intellectual rigour demands that you calculate costs and benefits of mitigation by comparing scenarios only within an SSP, not across them. (Note, that doesn’t mean population doesn’t impact emissions - but for the record I do not find it acceptable to use climate to justify population control).
If you’re thinking that the scientists must all know this and only journalists could make the mistake of comparing scenarios inappropriately, think again. In 2018, the 4th U.S.Climate Assessment generated lurid headlines like this one on the front page of the New York Times, about how climate change could cost the US up to 10% of GDP by 2100.
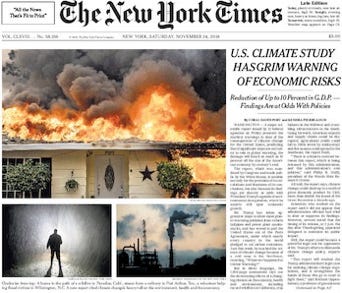
The BBC, Smithsonian and others carried similar stories. CNN even published a fact-check of President Trump’s push-back against the 10% of GDP claim.
So where did all the journalists get the 10% of GDP figure from? Digging into the NYT and other stories, details show that it originated from numbers deep within the bowels of the Climate Assessment, in Figure 29.2 on page 1349 of Volume II to be precise.
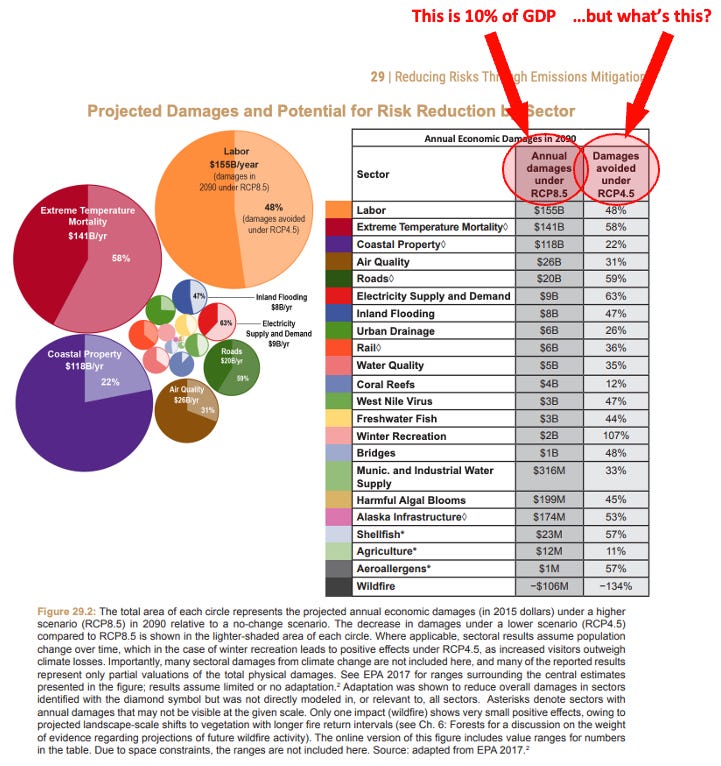
The figure calculates different sorts of damage to the US economy by 2090 under the implausible RCP 8.5 (so President Trump, though it pains me to say it, was right).
Equally interesting, though, is the column called % avoided under RCP 4.5. The implication is that the huge losses under RCP 8.5 can be dramatically reduced by switching to RCP 4.5 - which would be a great justification for spending money on climate action, if true. The problem is, the biggest difference between RCP 4.5 and RCP 8.5 is not climate mitigation but population: up to 12.3 billion worldwide by 2100 in RCP 8.5 versus 8.7 billion in RCP 4.5.
If you can find plenty more examples of how climate scenarios have been misused here and here.
</wonk zone>
At this point, I know some people will be screaming “tipping points” at their screens. So lets get back to sea level rise and the issue of tail risk.
How confident can we be that we are not going to see 2 metres of sea level rise, just because we are tracking RCP 4.5/SSP2-4.5 and not RCP 8.5/SSP5-8.5?
The big unknown is the speed of melting or collapse of the Greenland and Antarctic ice sheets - after all, if those were to melt entirely, we’re looking at 65 metres of sea level rise. By the way, if the full depth of the world’s oceans were to get 2C warmer, thermal expansion alone would lead to around 3 metres of sea level rise.
While tipping point risks are certainly real, and we may even have already locked them in, the reality is that melting ice sheets or warming the deep ocean takes a very long time: centuries or thousands of years, not just decades. The world’s oldest recorded iceberg, A23a, which broke off from Antarctica’s Filchner–Ronne ice shelf in 1986, has just about melted after 40 years. That’s just a 1000 GT iceberg, floating in 3°C water, not a multi-million GT land-based ice-shelf at an average temperature of -22°C (Greenland) or -35°C (Antarctica).
Let’s start with Greenland. In 2006, the UK Government’s science advisor Professor David (now Sir) King hit the headlines when he warned Tony Blair that “climate change poses a bigger threat to humanity than terrorism,” pointing out that “without reductions of 60 percent by mid-century, the melting of the Greenland ice sheet would be irreversible, and sea levels would rise by seven meters from that alone.” What the professor omitted to mention was that the 7 metres of sea level rise would take up to 12,000 years. Meanwhile, terrorists remain the bigger threat.
Between 2003 and 2025 Greenland has been losing 260GT of ice every year, fuelling regular stream of press stories like Vanishing Ice and Greenland’s Ice Faces Melting ‘Death Sentence’, along with beautiful and unsettling images like this one:
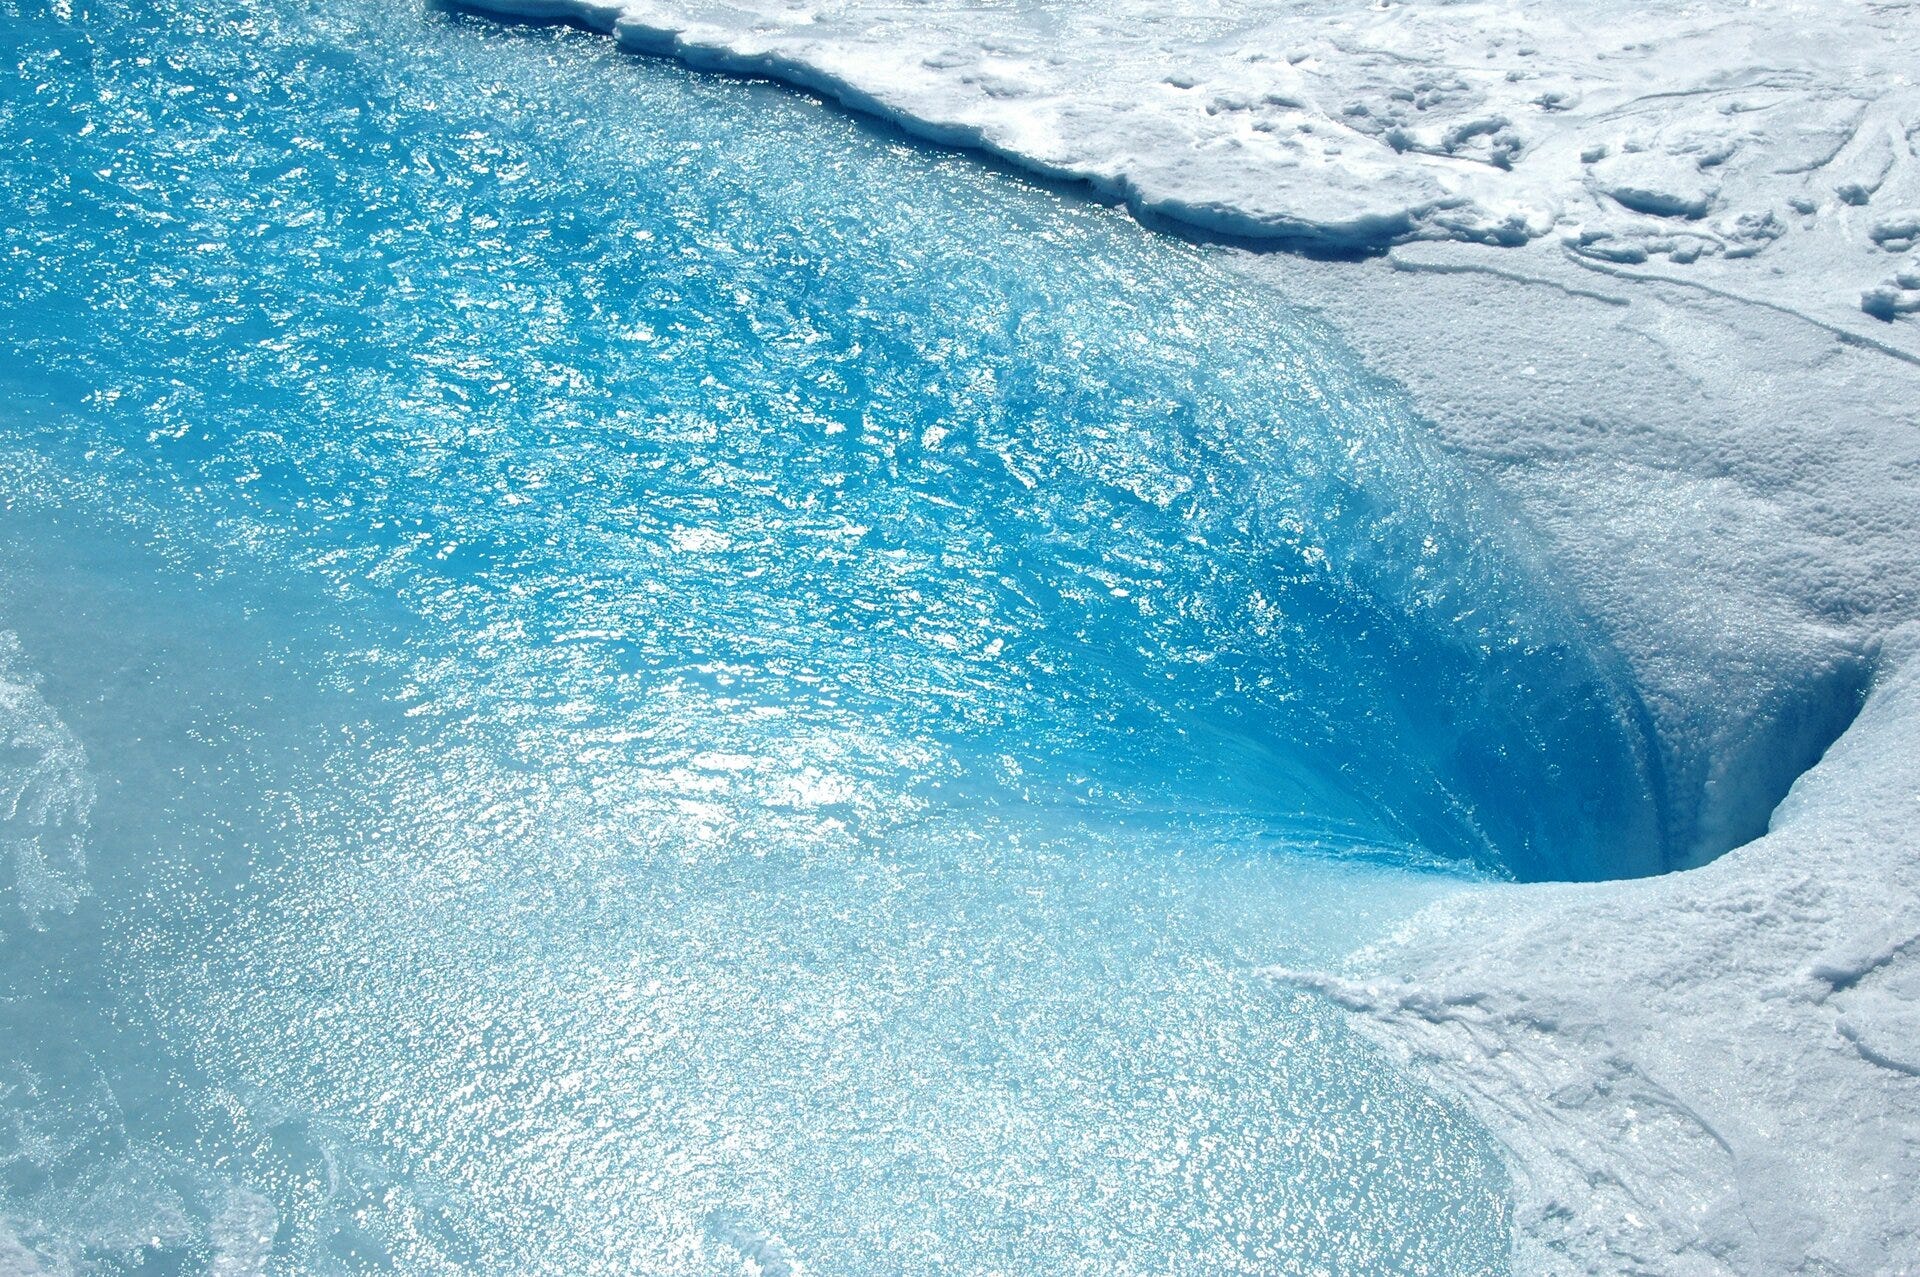
To be fair, Greenland’s rate of mass loss has been accelerating perhaps by as much as 6x since the 1990s (though recent years have seen lower mass loss than the average for the past two decades), and the idea that we have started something irreversible is absolutely concerning.
However, to put it in perspective, 260GT of ice is less than 0.01% of Greenland’s total 2.9 million GT. At the melt rate of the past few decades, it would take 12,600 years for Greenland to be ice-free. Even if the current rate of melting were to speed up by 10x, it would still take well over a millennium.
Another regular in the press is the Thwaites Glacier, dubbed the Doomsday Glacier by Rolling Stone magazine in 2017. Thwaites is all that is holding back the West Antarctica Ice Sheet, most of which rests below sea level and holds enough ice to raise the world’s oceans by 3.3 metres. All the main media stories on Thwaites, including this one by Scientific American, repeated the Doomsday Glacier moniker, presumably because if Thwaites breaks up or melts we are all doomed.
Except we aren’t. Nowhere in the hyperbolic Scientific American article does it say how long it would take for those 3.3 metres of sea level rise to occur. It’s only in the last paragraph of the report by an intrepid BBC journalist who visited the Doomsday Glacier that we discover “Thwaites is not going to vanish overnight - the scientists say it will take decades, possibly more than a century.” In fact, in 2023, new research was published that showed the Thwaites glacier might not even have become unstable yet. And once Thwaites does disappear, the gigantic West Antarctic Ice Shelf still has to flow out to sea before you get sea level rise of 3.3m - many centuries or millennia into the future (a timescale confirmed by researchers at the Cooperative Institute for Research in Environmental Sciences at the University of Colorado Boulder).
What is the worst case for the amount of land-based ice we can plausibly expect melt over the next 74 years? I feel fairly (but not entirely) confident it won’t be enough to get us metre to sea levels by 2100.
If you disagree, maybe we should have bet: a case of fine Nuuk 2100 Cabernet Sauvignon. (Oh crap, rabbit-hole alert: Greenland already exports wine to Switzerland).
Before you decide accuse me of complacency, or even worse, decide that sea level rise this century is a big fat nothing-burger, let me stop you right there.
Climate-driven sea level rise is a huge problem requiring a societal-scale response, for three reasons:
Even 75cm of sea level rise would have catastrophic local consequences. Think coral‑atoll nations such as the Maldives, Tuvalu, Kiribati and the Marshall Islands. Think too of some really big countries like Bangladesh, the Netherlands, Vietnam, Egypt and China, where large fractions of national territory sit on river deltas. Sea level rise is not so much about losing land area, engineers can mainly protect against that. The problem is that coastal areas become enormously more vulnerable to storm surges, and even more importantly, populations suffer as water supply and agricultural land are hit by salinisation - salt water driven into deltas, up rivers and into subsurface water. I’m trying and failing to find an academic reference to quantify the problem that doesn’t rely on RCP 8.5/SSP5-8.5 - shoot)
As described above, we simply can’t rule out long tail risks that exist even under plausible emissions scenarios. All the work I could find on the question is polluted with RCP 8.5/SSP5-8.5. So while 2 metres of sea level rise is off the table, could we see 1 metre by 2100? 1.25 metres? 1.5 metres? I would rather like to know.
Then there is what happens after 2100. The AR6 summary paragraph states that we could be looking at 66cm to 1.33 metres of sea level rise by 2150 - that’s within the lifespan of our grandkids (or for some reading this, our kids). And it doesn’t stop there: the CO2 we are pumping out over the next few decades will stay in the atmosphere for hundreds of years, trapping heat that ends up in the oceans; the glaciers and ice sheets will keep melting for millennia (unless you want to go down the route of geo-engineering - another rabbit hole). It’s all very well to say we can deal with 75cm of sea level rise through to 2100, but what is our responsibility not to leave a ticking sea-level-bomb for the 22nd, 23rd, 24th century and beyond? If you say we have no responsibility, I disagree. What is it, and how much of our wealth should we invest as a result, those are questions that we need to discuss.
This has been a much longer post than I thought when I started. I’ve learned a lot while writing it. If you have reached this point, I hope you have too, and I thank you for your time.
Coda: In the comments, Andrew Kerber noted that “The claims of accelerating sea level rise arise from three different data sets being spliced together. The measurements by tide gauges do not show acceleration”. When challenged for evidence, he posted a link to a 2025 paper I had not seen at the time of writing: A Global Perspective on Local Sea Level Change by Hessel G. Voortman and Rob De Vos.
If that were true, we could be much more optimistic about coming in at the lower end of my 37 to 75cm range for sea level rise by 2100, or the lower end of the range in the two central IPCC scenarios SSP1-2.6 and SSP2-4.5, which is an almost identical 32 to 76cm.
Sadly, the Voortman and de Vos paper has been debunked, and not a little bit, it has been eviscerated. If you want to read a textbook example of a bunch of smart scientists taking down a crappy paper, read this: Faulty science and faulty statistics can’t stop sea level acceleration: An expression of concern regarding Voortman, H. G., & De Vos, R. (2025).
So my post delivered a final lesson for me, and maybe for you. Kerber, who it turns out spends a lot of time posting anti-climate and pro-Trump comments on Substack (and presumably elsewhere) has made an assertion. Only when asked to back it up has he provided a source. Only when I got curious and searched for it on Google Scholar did I find it had just 3 citations, suggesting either inexplicable inattention by sea level scholars, or a problem with the paper. And only when I dug in did I find that it was quite clearly the latter.
This is a lovely example of Brandolini’s Law - debunking Kerber’s misinformation clearly took me far longer that it took him to post it. Nevertheless, I am grateful for his comment: I am now smarter for having had to dug in to the literature on sea level rise acceleration, and we all have a good illustration of how the climate culture wars work.
Coda to the coda: On his LinkedIn page, in response to someone asking about the criticisms of his paper, Hessel Voortman says : “There has been one peer-reviewed critique of my method. I responded to each and every comment made.” But I can’t find his response in the peer-reviewed literature. Draw your own conclusions.
Before you go, if you like my work, please make sure you subscribe to Thoughts of Chairman Michael, Cleaning Up on podcast or YouTube, and the Cleaning Up newsletter. And please tell friends, family and colleagues to do the same. Your support and encouragement means a lot to me.
* All figures here for sea level rise are global averages. If you look around the world, you’ll find places where land is sinking much faster than the seas are rising (for instance where ground water extraction is causing massive subsidence, like Jakarta), and places where the land is rising because of post-glacial bounce-back.
Comments
Nothing yet. Say the first thing.
Sign in to join the conversation.