
The NHS 10 Year Health Plan is clear that the service is expected to use data better to improve productivity and patient outcomes. What it is much less clear about is how that is meant to happen in practice.
The problem is not a lack of data. The NHS produces it in industrial quantities. The problem is turning that data into comparisons that organisations regard as fair enough to act on.
Because without that, benchmarking does not drive improvement—it gets dismissed.
One of the NHS’s default approaches is to produce league tables. There is an obvious appeal. They are simple, visible, and they tap into the competitive instincts of boards, executives and clinicians alike. In the right circumstances, they can concentrate minds quickly.
But they rely on a basic assumption: that the playing field is level.
Too often, it is not. Outcomes and activity are driven not just by what organisations do, but by the populations they serve. Older patients become unwell more often than younger ones, and deprivation is associated with worse outcomes and more complex need. An organisation serving an older, poorer population will therefore tend to look weaker than one serving a richer, younger population—even before anyone has done anything especially well or badly.
The result is predictable. Those at the bottom of league tables often reject the comparison entirely, arguing—often correctly—that it has failed to account for their population. At that point, the benchmarking has already failed.
There is a technical answer to this: adjust for need. That approach underpins major parts of the NHS funding model and, done well, it can produce fairer comparisons.
But it comes with trade-offs. It is time-consuming, technically demanding, and often difficult to explain. The more complex the adjustment, the more it invites debate about what has and has not been included. In practice, that complexity can limit its usefulness as a tool for day-to-day improvement.
This leaves a gap: something simpler than full statistical adjustment, but fairer than a crude national league table. This matters not just for benchmarking, but for Population Health Management, where identifying meaningful peer groups is essential to understanding variation and targeting interventions effectively.
This analysis introduces a practical way to fill that gap: cluster organisations into peer groups that look alike before comparing their performance.
General practices were grouped using a machine learning model given only two inputs: the age structure of the registered population and the male–female mix. From that alone, four intuitive groups emerged. Addition of deprivation data and geographic data further refined that to six similarly sized clusters.
What makes this approach useful is not just the grouping itself, but its simplicity. It does not attempt to model every possible driver of need. Instead, it captures a large part of the underlying variation using characteristics that are easy to understand and hard to dispute.
The most striking feature of the clustering is what the model was not told. It was not initially given deprivation, nor was it told whether a practice was in London, a major city, a suburb or a village. Yet once the groups were formed, those characteristics aligned strongly anyway.
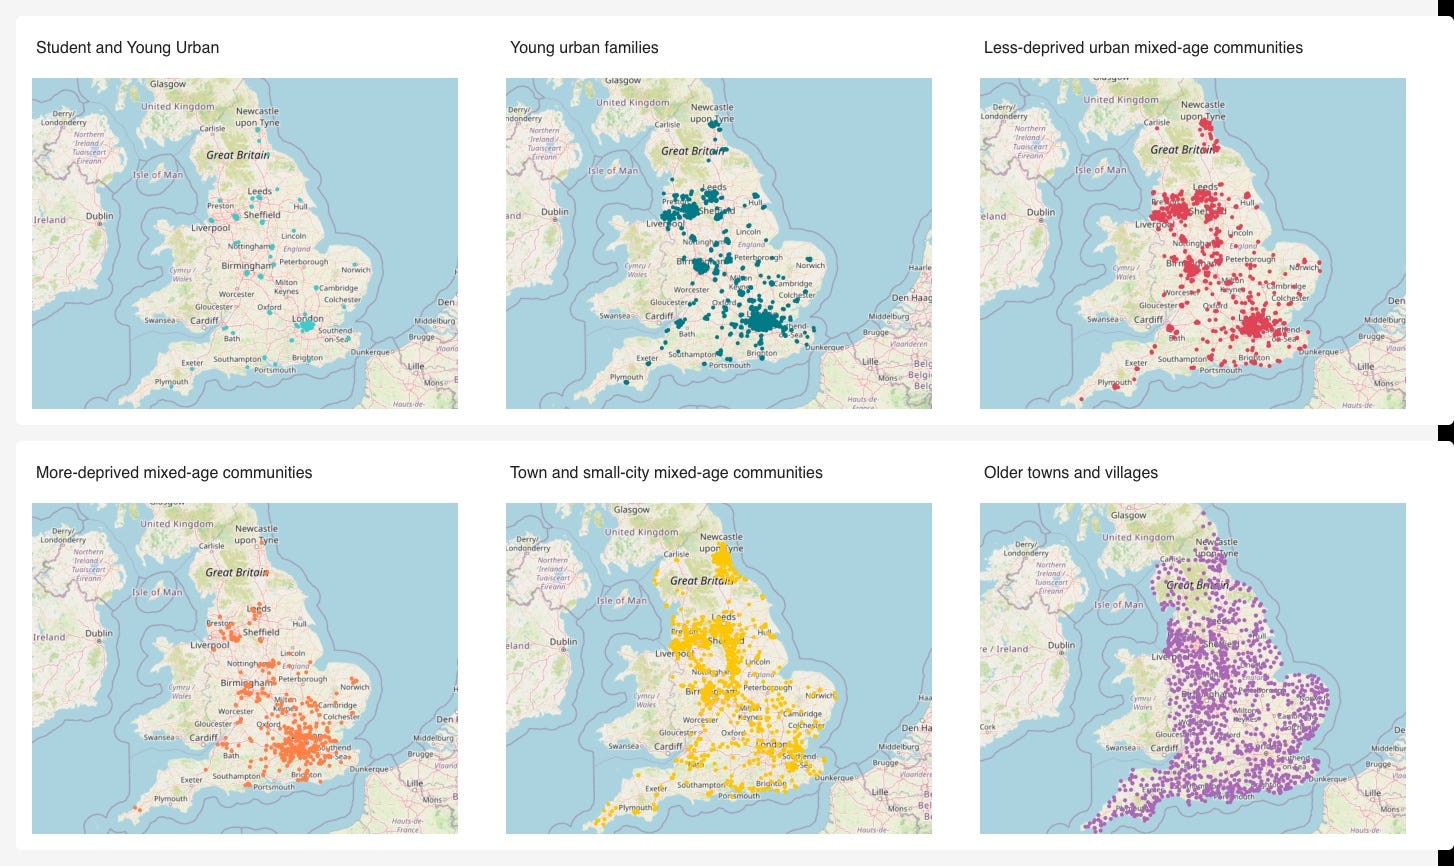
The younger groups tended to be more urban and to differ in deprivation from the older small-town and rural groups. In other words, the clustering recovers much of the real-world structure of the NHS without being explicitly instructed to do so.
That matters because it makes the output intelligible. Organisations can recognise the group they are in and, crucially, recognise the organisations they are being compared with. That is a prerequisite for benchmarking to influence behaviour.
The impact becomes clearer when applied to real data. Antimicrobial prescribing provides a useful test case. There is no single “correct” level of antibiotic prescribing for a practice: too much, and the system stores up antimicrobial resistance; too little, and there is a risk that opportunities to treat infection are missed.
On a crude national comparison, prescribing rates vary widely. In this analysis, the national average is 98 items per 1,000 registered patients. But the cluster averages range from 48 in the student and young urban group to 119 in the older towns and villages group.
That spread is not noise. It reflects underlying differences in population and need. Clustering makes those differences explicit, allowing comparisons to focus on what is genuinely unusual rather than what is structurally expected.
The effect is measurable. Cluster membership explains 28 per cent of the national variation in antibiotic prescribing. This is not as precise as a full adjustment such as STAR-PU, but it is substantially fairer than a raw league table and far easier to implement and explain.
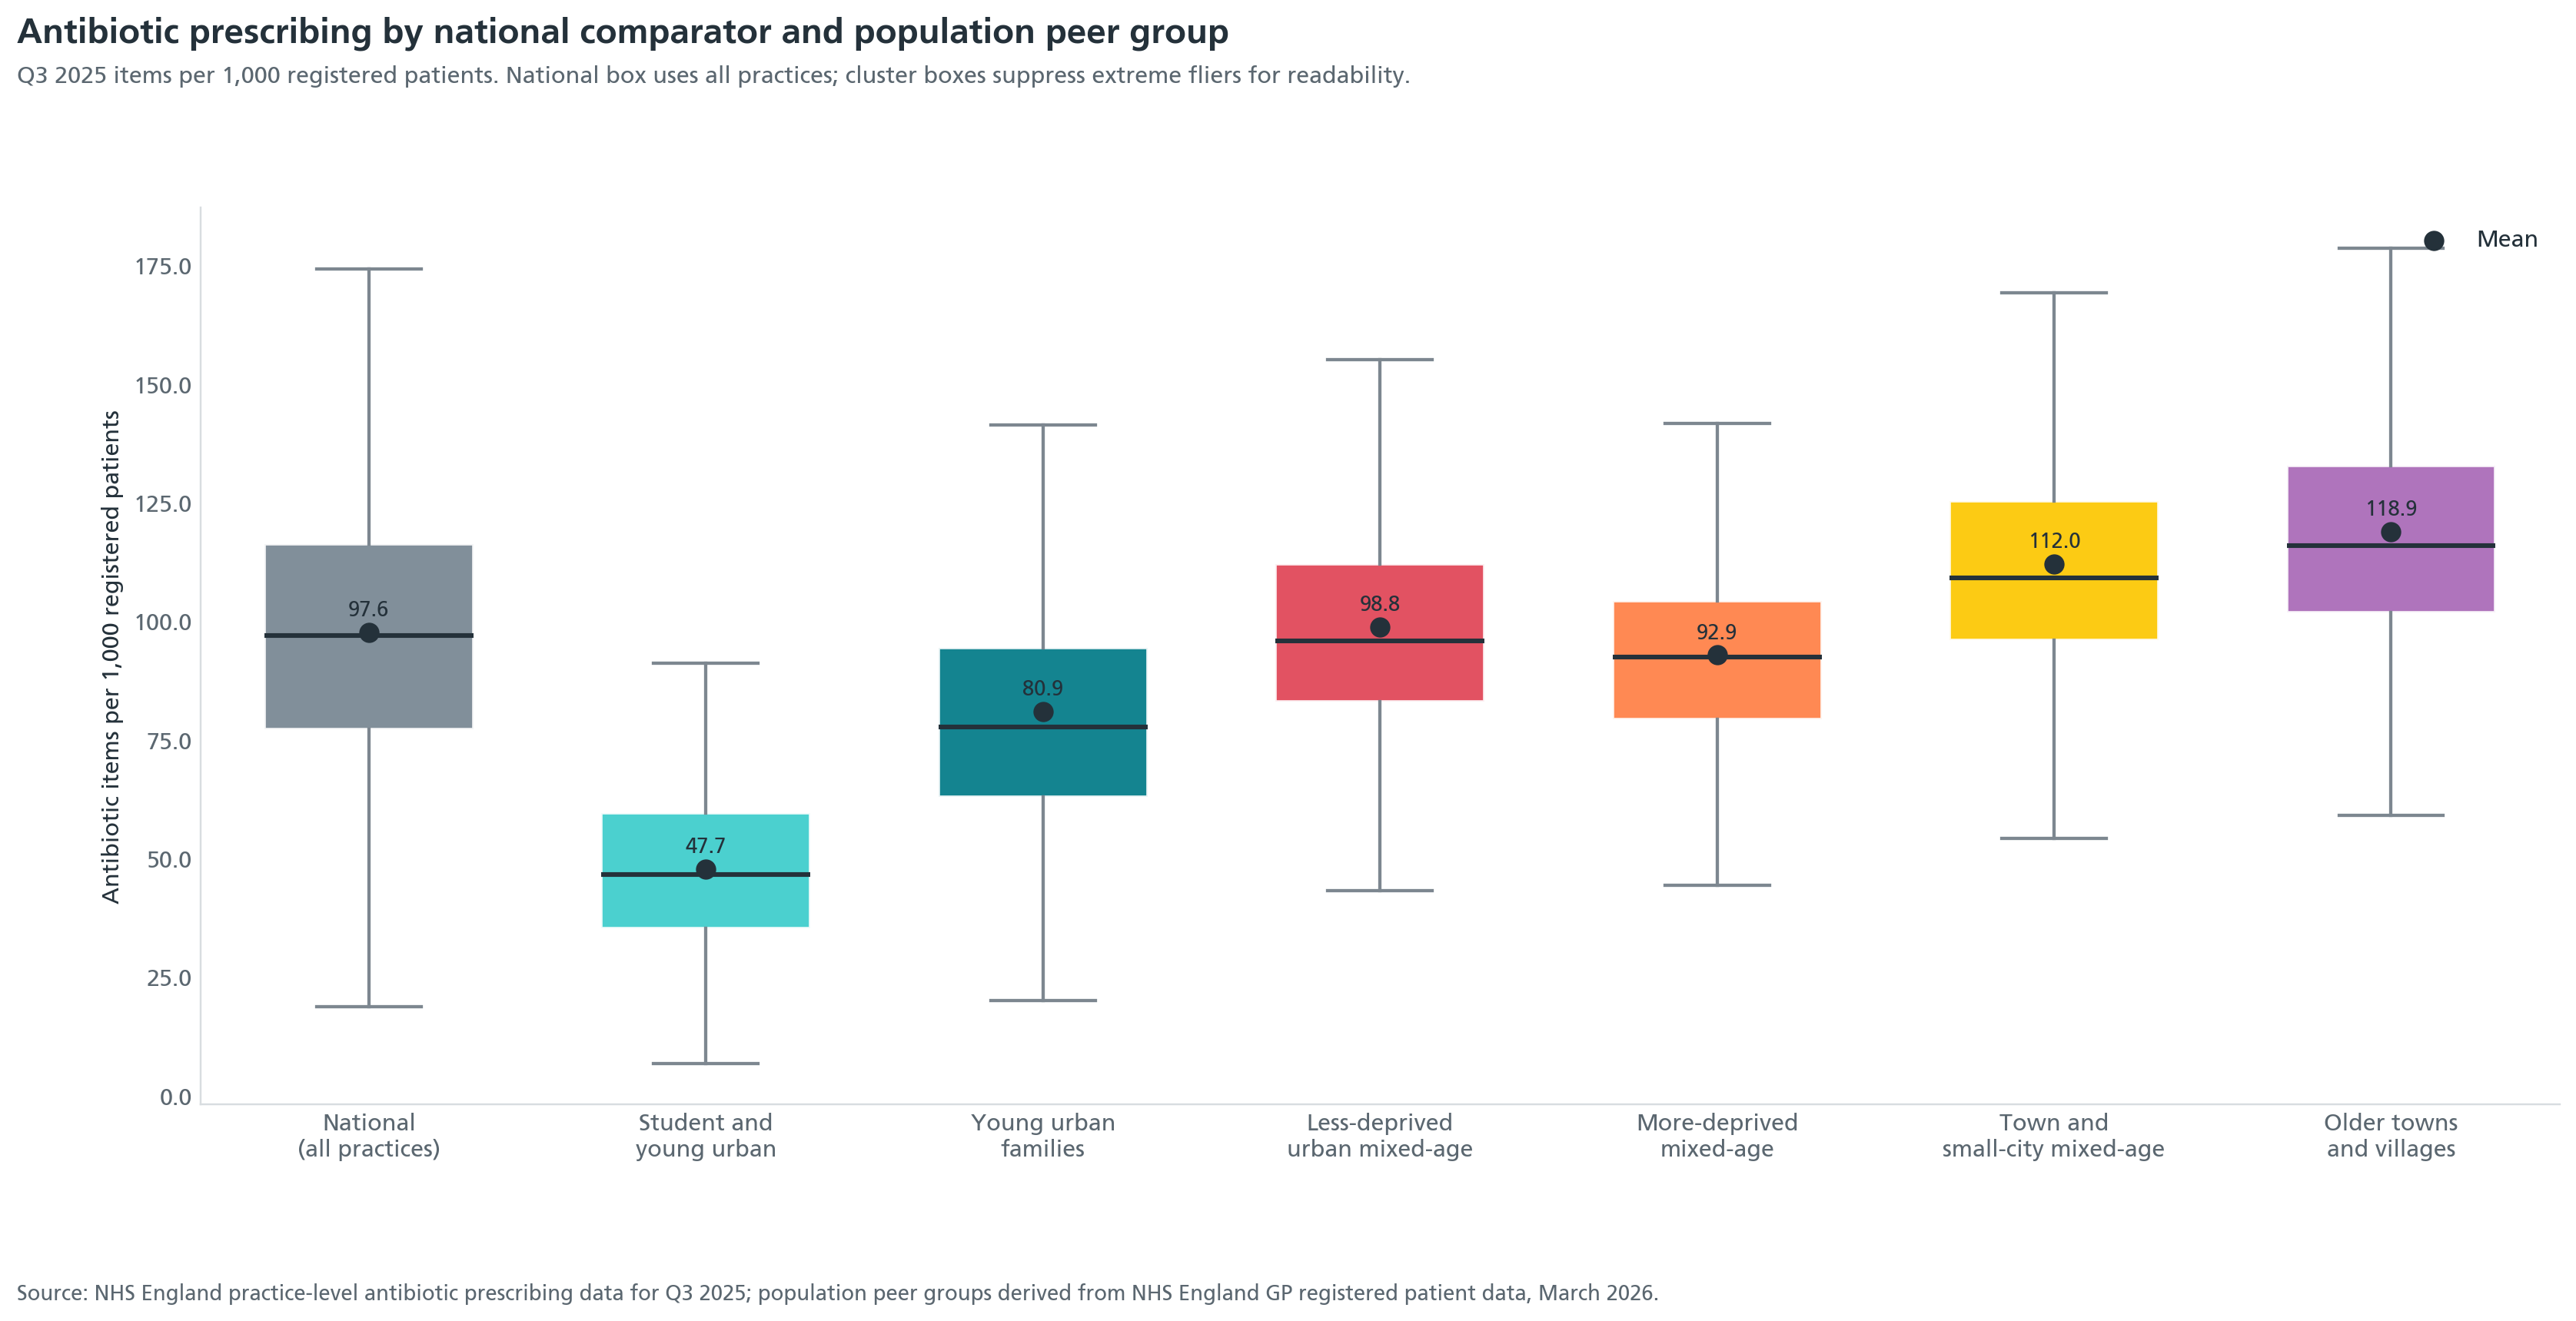
The real value of clustering comes when identifying outliers. Many practices that appear exceptional on a national league table cease to look exceptional once compared with their peers. In this dataset, the vast majority of practices in both the top and bottom 5 per cent nationally are no longer outliers once cluster context is applied.
They were not necessarily unusual organisations. They were organisations serving unusual populations.
This matters because improvement effort is limited. Clustering allows systems to focus attention on the organisations that remain outliers even after fair comparison—those where there is the greatest opportunity to improve.
The same method can be applied beyond individual practices. When used at primary care network level, similar groupings emerge: young urban neighbourhoods, urban family areas, mainstream mixed communities and older smaller-town geographies. That aligns with the increasing policy focus on neighbourhood-level commissioning and delivery.
Any metric that can be expressed at neighbourhood level can, in principle, be benchmarked within these clusters. This creates a consistent and scalable way of comparing like with like across the system.
The NHS does not need less benchmarking. It needs benchmarking that organisations recognise as fair.
Clustering offers a practical way to achieve that. It is simple enough to reproduce, intuitive enough to explain, and robust enough to improve on crude national comparisons. It does not replace more sophisticated adjustment methods, but it provides something the system has often lacked: a usable middle ground.
If the NHS is serious about using data to drive improvement, that usability may matter as much as statistical precision.
Clustered practices and PCNs and technical approach can be found on GitHub
No posts
Comments
Nothing yet. Say the first thing.
Sign in to join the conversation.