
Welcome to The Merciless Trade, where I break down significant updates in the financial markets and find connections between them. Preparing you for the week ahead as I flip through charts, analyze the data, and cut through the noise to get an edge.
Now let’s do this…
Markets pushed higher again last week, but beneath the surface the picture became considerably more complicated. The S&P 500 notched another record above 7,800 as softer inflation data helped knock down expectations for a September rate hike, while the Russell 2000 also broke to fresh highs and the QQQ recovered key resistance. July CPI came in exactly in line, core CPI eased to 2.5%, and PPI was flat on the month, reinforcing the idea that inflation is no longer the market’s primary problem. By the end of the week, the conversation had shifted toward growth, the consumer and the shape of the yield curve. Friday’s weak retail sales and sharp drop in Michigan sentiment added to evidence that demand is cooling, but the market still managed a third consecutive weekly gain.
The bond market, however, refused to give investors an entirely clean dovish signal. Front-end yields eased as Fed-hike odds fell, but the long end sold off, producing another pronounced steepening of the curve driven by long-end selling as investors continued to demand more compensation for fiscal deficits, heavy Treasury issuance and elevated term premium. July’s federal budget deficit widened to roughly $432 billion, while a weak 30-year auction reinforced concerns about the government’s borrowing needs. That divergence is becoming increasingly important: the Fed may be moving closer to the sidelines, but the long end of the curve is still being driven by forces outside the Fed’s control. The split inside the central bank was also on full display, with Beth Hammack continuing to argue for hikes while other officials, including Barkin and Goolsbee, urged patience.
Geopolitics added another layer of volatility. The U.S.-Iran standoff over the Strait of Hormuz intensified, with ceasefire talks stalled, U.S. forces firing on a blockade-running vessel and additional attacks reported around key Middle East energy infrastructure. WTI gained more than 5% on the week despite an enormous 17.4 million-barrel U.S. crude inventory build, a clear sign that geopolitical supply risk is overpowering otherwise bearish inventory data. The IEA also raised its estimate of the Q3 oil-market deficit to roughly 1.8 million barrels per day, keeping energy firmly in focus as one of the market’s biggest macro wildcards.
At the same time, the AI trade remained one of the strongest forces underneath equities. CoreWeave, Super Micro, Nebius and other infrastructure names surged on strong results, while Nvidia-backed financing initiatives continued to push the scale of AI capital formation into unprecedented territory. But expectations are now extremely demanding. Applied Materials delivered strong guidance and still sold off, highlighting how little room for disappointment remains in the semiconductor complex. Nvidia’s reported pullback in the size of its OpenAI infrastructure commitment also raised fresh questions about just how much leverage and circular financing will be required to sustain the current buildout.
The result is a market still trending higher but increasingly pulled in opposing directions. Softer inflation, lower front-end yields, strong earnings and broadening participation continue to support risk assets, while oil, long-duration yields, fiscal pressure and signs of consumer fatigue are building underneath the surface. With major strategists raising year-end targets even as high-profile bears warn that complacency is returning, the next phase of the rally is likely to depend less on whether inflation keeps cooling and more on whether growth can slow without breaking, whether the long end can stabilize, and whether AI spending can continue to justify the expectations already embedded in valuations.
The latest data paints a softening-growth, cooling-inflation picture without signaling recession. CPI came in exactly as expected, core CPI eased to 2.5%, and PPI was softer than forecast, giving the Fed more room to remain on hold. Consumer data was mixed: headline and core retail sales were weak, while the more important retail control group remained solid at +0.4%. Consumer sentiment and expectations deteriorated sharply, and jobless claims ticked higher, suggesting the labor market and consumer are gradually losing momentum. Energy data was also bearish, with crude inventories posting a massive 17.4 million-barrel build, although gasoline stocks fell by about 1 million barrels, suggesting the crude build was not purely a collapse in end-demand. Overall, the backdrop is bond- and rate-sensitive-tech friendly, with inflation becoming less of a concern and growth/employment increasingly becoming the key macro risk.

U.S. Baker Hughes Oil Rig Count +1 To 455; U.S. Baker Hughes NatGas Rig Count +4 To 128; U.S. Baker Hughes Total Rig Count 593 Vs 588 Prior
Retail Inventories Ex Auto For June -0.4% Vs -0.2% Prior
Michigan Consumer Sentiment For August 51.0 Vs 54.4 Est.
USA Business Inventories (MoM) For June 0.0% Vs 0.2% Est.
Michigan Consumer Expectations For August 50.6 Vs 55.2 Est.
Retail Sales (YoY) For July 5.00% Vs 6.72% Prior
USA Retail Control (MoM) For July 0.4% Vs 0.3% Est.; 0.4% Prior
Retail Control (MoM) For July Prior Revised From 0.5% To 0.4%
Core Retail Sales (MoM) For July -0.3% Vs 0.2% Est.
Retail Sales (MoM) For July -0.6% Vs 0.1% Est.
PPI (MoM) For July Revises Prior From -0.3% To -0.1%
PPI (MoM) For July 0.0% Vs 0.2% Est.
Initial Jobless Claims Prior Revised From 199K To 200K
Initial Jobless Claims 209K Vs 202K Est.; 200K Prior
Continuing Jobless Claims 1,777K Vs 1,800K Est.
CPI (MoM) For July 0.1% Vs 0.1% Est.
CPI (YoY) For July 3.4% Vs 3.4% Est.
Core CPI (YoY) For July 2.5% Vs 2.5% Est.; 2.6% Prior
Core CPI (MoM) For July 0.2% Vs 0.2% Est.
Federal Budget Balance For July -432B Vs -348.3 Est.
API Crude Oil Stock 9.072M Barrel Build Vs 0.500M Barrel Draw Est.
EIA Weekly Crude Oil Inventories +17.4M Barrel Build Vs 0.6M Barrel Draw Est.
EIA Weekly Gasoline Stocks 1.0M Barrel Draw
EIA Weekly Distillates Stocks 0.010M Barrel Draw Vs 1.600M Barrel Draw Est.
Existing Home Sales (MoM) For July -1.7% Vs -1.4% Prior
Existing Home Sales For July 4.06M Vs 4.05M Est.
ADP Employment Change Weekly 8.30K Vs 15.00K Prior
CB Employment Trends Index For July 107.71 Vs 106.74 Prior
The 2-year yield fell 3 basis points on the week, while the 5-year edged up 1 basis point, but the real pressure was concentrated further out the curve. The benchmark 10-year climbed 5 basis points to close at 4.70%, while the 20-year rose 5 basis points to 5.26% and the 30-year gained 6 basis points to finish at 5.26%. Compared with the prior week, when the Treasury market was driven more by expectations for Fed policy and the fallout from weaker labor data, this week produced a pronounced curve steepening driven by long-end selling, with the front end remaining relatively anchored while yields further out the curve moved higher. The move suggests investors are becoming more comfortable with a softer near-term Fed path, but are still demanding a larger premium to hold longer-duration Treasuries amid persistent concerns over federal deficits, heavy government borrowing, Treasury supply and longer-term inflation risk. In other words, the market is increasingly separating the Fed outlook from the fiscal outlook: easier policy expectations are helping the front end, while term-premium and supply concerns continue to pressure the long end.
The 2-Year closed at 4.18%
The 5-Year closed at 4.37%
The 10-Year closed at 4.70%
The 20-Year closed at 5.26%
The 30-Year closed at 5.26%
For the September 16 Fed meeting, markets are currently pricing a 66.9% chance that rates remain unchanged, and a 33.1% probability of a 25-basis-point hike.
For the October 28 meeting, markets price a 53.6% probability that rates remain unchanged, a 39.8% probability of one 25-basis-point hike and a 6.6% probability of 50 basis points of cumulative hikes.
For the December 9 Fed meeting, markets are pricing in a 32.4% probability that rates remain unchanged, while a 25-basis-point hike remains the most likely outcome at 45.3%. The probability of a 50-basis-point increase stands at 19.8%, with a much smaller 2.6% chance of 75 basis points of additional tightening.
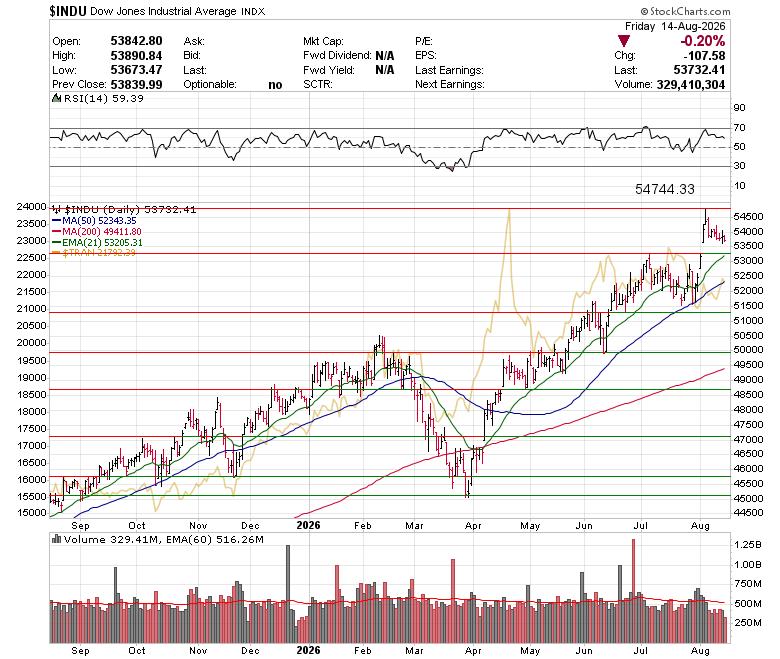
The Dow Jones Industrial Average fell 0.56% this past week, pulling back from recent highs but remaining above its rising 21-day EMA, 50-day SMA and 200-day SMA, keeping the broader uptrend intact. The more encouraging signal came from the Dow Transports, which rose 1.33%, providing some confirmation that economically sensitive parts of the market are still participating. Momentum in the Industrials has cooled slightly, with RSI near 60, but the technical structure remains constructive as long as the index continues to hold above the 53,000–53,200 area, while the recent record zone near 54,700 remains the key upside level to reclaim.
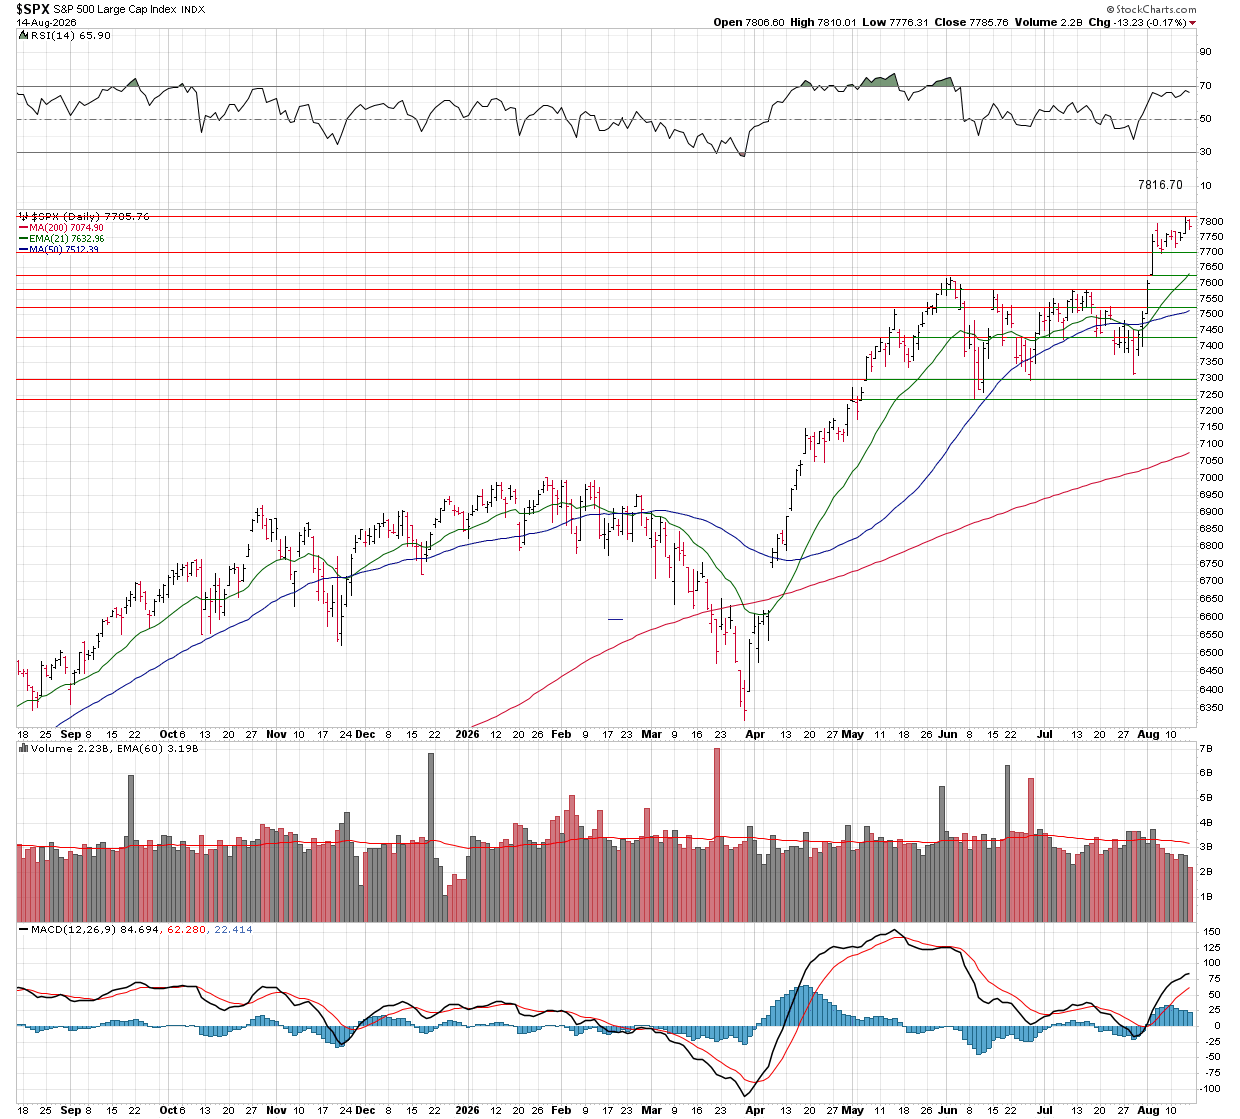
The S&P 500 rose 0.36% this past week to close at 7,785.76, after notching a fresh record close near 7,800 on Thursday. The index remains firmly above its rising 21-day EMA, 50-day SMA and 200-day SMA, with price continuing to press against record territory. Momentum remains constructive, with RSI in the mid-60s and MACD still positive, although the index is becoming increasingly extended after the recent breakout. As the new week begins, the 7,800–7,817 area is the immediate resistance zone, while 7,630–7,650 is the first meaningful support area on any pullback.
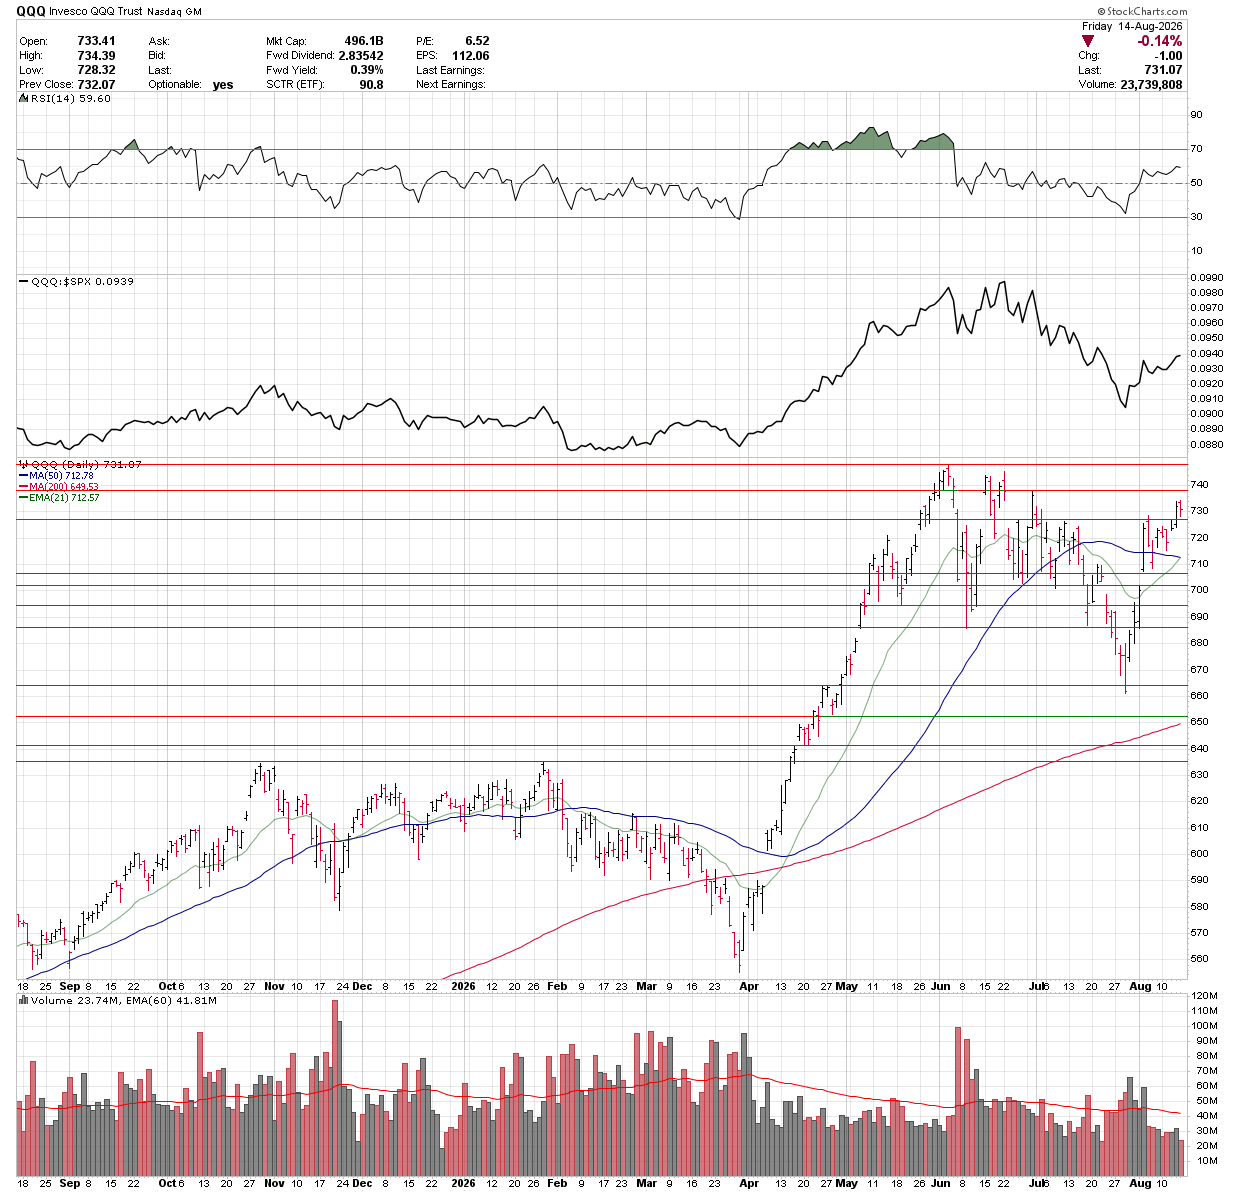
The QQQ Trust rose 1.11% this past week, pushing back to one-month highs and reclaiming the key $728 support/resistance area on Thursday and Friday. The ETF is now trading back above its 21-day EMA and 50-day SMA, with the rebound restoring some of the momentum lost during the late-July pullback. RSI has recovered to around 60 and relative strength versus the S&P 500 is beginning to turn higher again, both constructive signals for large-cap growth. Holding above $728 keeps the near-term setup bullish and puts the $740–$745 record-high zone back in play, while a move back below $728 would weaken the breakout and bring the low-$710s into focus.
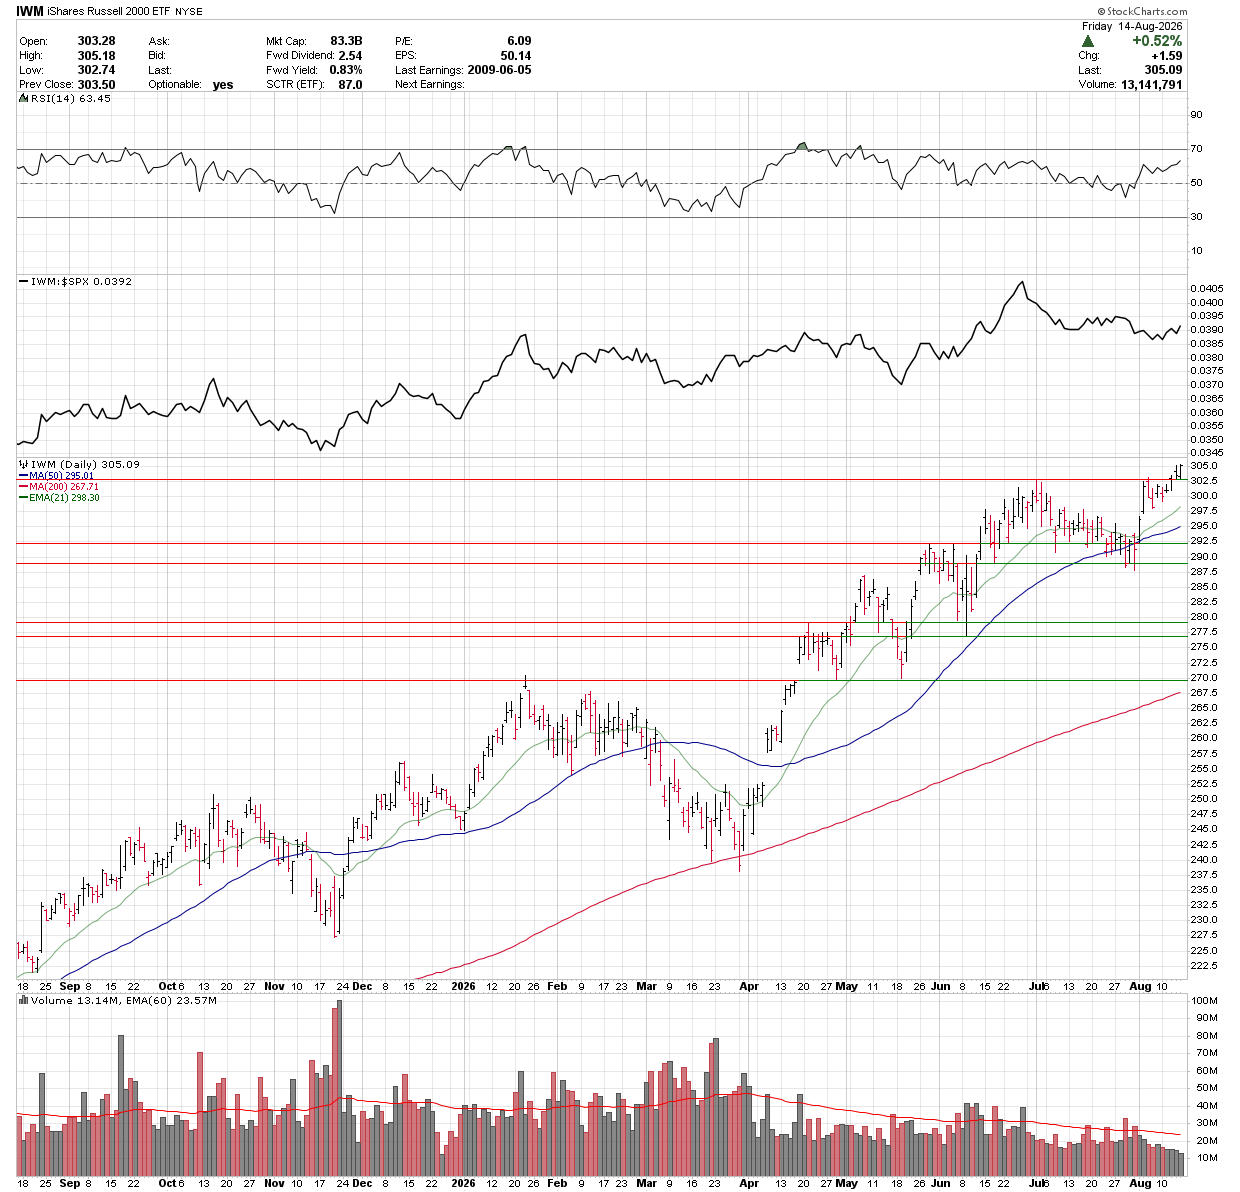
The iShares Russell 2000 ETF rose 1.17% this past week, closing Friday at a fresh record of $305.09 as small caps continued to outperform. The underlying Russell 2000 also posted its third consecutive record close on Friday, following new closing highs on Wednesday and Thursday. The technical setup remains firmly bullish, with IWM trading above its rising 21-day EMA and 50-day SMA, while RSI near 63 reflects strong momentum without yet reaching overbought territory. Relative strength versus the S&P 500 has also begun turning higher again, reinforcing the recent rotation into small caps. As long as IWM holds the $300–$302 breakout zone, the trend remains constructive, with the next move likely dependent on whether lower front-end yields and reduced expectations for additional Fed tightening continue to support smaller, more rate-sensitive companies.
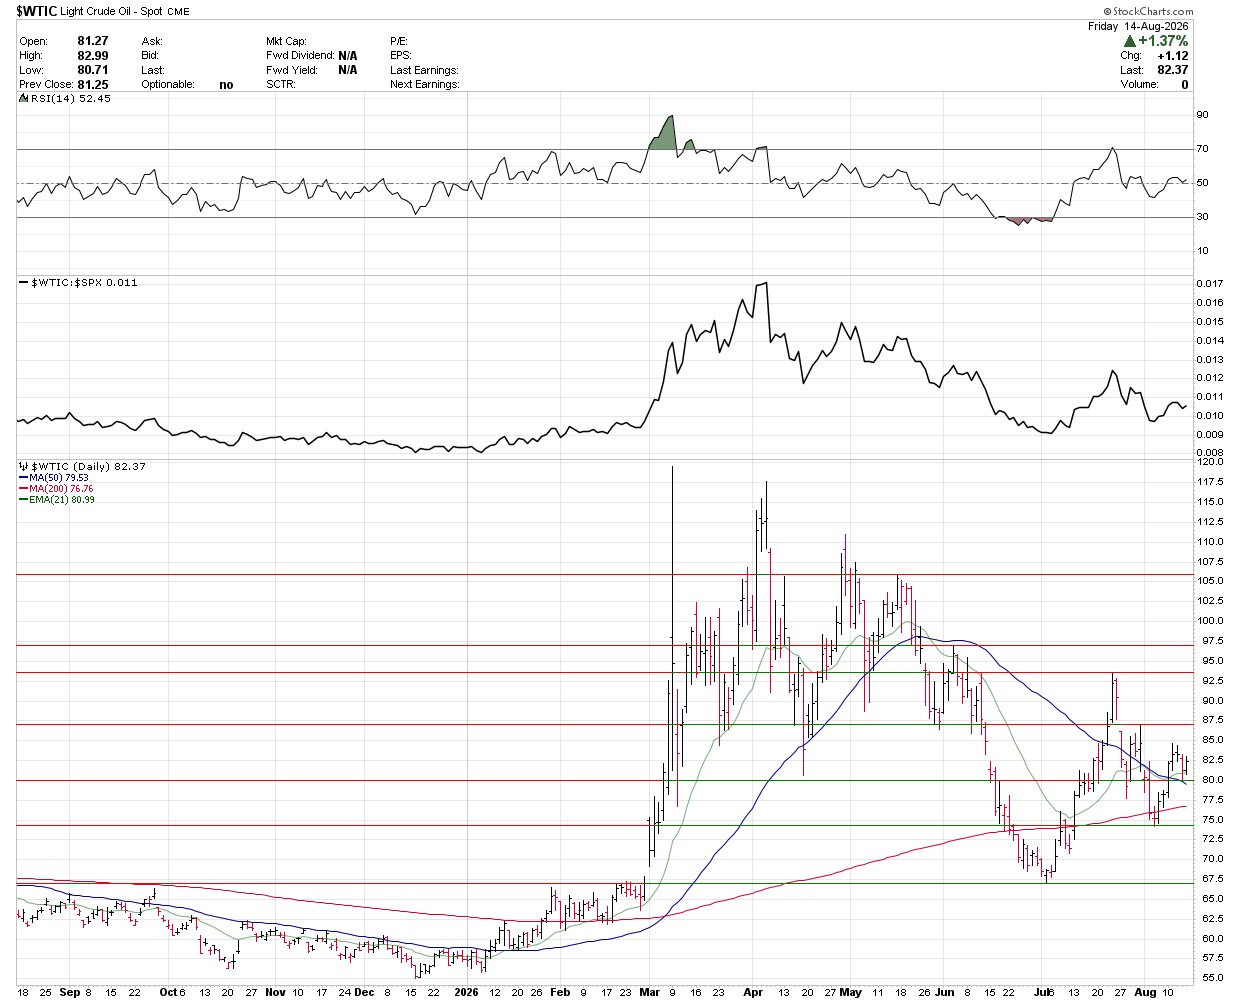
WTI crude pushed higher by 5.35% this past week, with price action continuing to triangulate as the trading range compresses just above the key moving averages. Crude is holding above both the 50-day and 200-day moving averages, as well as the 21-Day EMA, keeping the near-term technical bias constructive, but momentum has cooled as the MACD flattens and RSI sits near neutral territory. The narrowing range suggests a larger directional move may be developing, with a sustained break above the recent low-$80s consolidation opening the door toward the mid-to-upper $80s, while a loss of the moving-average cluster would put the mid-$70s back into focus.
The U.S. Dollar Index was little changed this past week, finishing near 99.64 and remaining in essentially the same range as the prior week. The dollar is still holding just above its 200-day SMA near 99.17, but remains below the 50-day SMA near 100.61, leaving the near-term setup neutral to slightly weak. RSI sits below 40, reflecting soft momentum, while the 99.1–99.2 area remains the key support zone to watch. A break below the 200-day would weaken the technical picture further, while a move back above 100.5–100.6 would be needed to restore a more constructive trend.
Gold gained 0.73% this past week, extending its rebound and pushing back above the 21-day EMA and 50-day SMA, while testing the 200-day SMA near $4,409. Momentum continues to improve, with RSI climbing into the low 60s and MACD turning firmly higher, keeping the near-term technical picture constructive. The next major resistance sits around $4,500–$4,550, and a clean break above that zone would strengthen the case for a broader recovery, while a rejection there would keep gold trapped inside the larger consolidation that has developed since the spring.
Silver gained 1.79% this past week, reclaiming both the 50-day moving average and 21-day EMA, which improves the near-term technical setup. Price is still trading below the more important 200-day SMA at $70.76, making that the next major resistance level heading into the week. Momentum is also turning more constructive, with the MACD pushing higher and RSI near 60, suggesting buyers are regaining control. A clean break above the 200-day would strengthen the recovery case considerably, while a failure there would keep silver trapped in the broader consolidation that has been in place since June.
Copper rose 0.37% this past week, consolidating just below fresh record highs and closing at $6.595 as the broader technical trend remains firmly bullish. Price continues to hold well above the 21-day EMA, 50-day SMA and 200-day SMA, while RSI near 60 shows momentum remains positive without becoming excessively overbought. The recent pause looks more like healthy consolidation after the breakout than a loss of trend, with a sustained move above the recent $6.70 area opening the door to another leg higher, while the rising 21-day EMA near $6.50 is the first key support to watch.
Bitcoin slipped roughly 2–3% this past week and is trading near $63,000, with price falling back below both the 21-day EMA and 50-day SMA, which now sit just overhead as near-term resistance. The setup remains technically weak, with BTC continuing to trade well below its declining 200-day SMA near $69,000 and relative strength versus the S&P 500 still deteriorating. RSI has faded into the low-40s, reflecting soft momentum rather than an oversold condition. For the week ahead, bulls need to reclaim the $63,700–$64,000 moving-average cluster to improve the short-term picture, while failure to do so keeps the $60,000–$62,000 area vulnerable to another test.
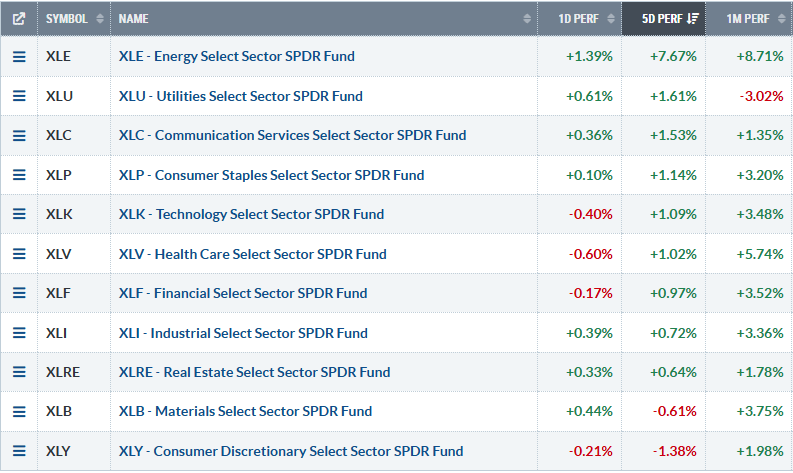
Sector performance is broadly positive over the past week, with energy clearly leading at +7.67%, followed by utilities at +1.61%, communication services at +1.53%, consumer staples at +1.14%, technology at +1.09%, and health care at +1.02%. Financials, industrials and real estate posted more modest gains, while materials (-0.61%) and consumer discretionary (-1.38%) were the only sectors lower over five days. Over the past month, leadership remains concentrated in energy (+8.71%), health care (+5.74%), materials (+3.75%), financials (+3.52%), technology (+3.48%) and industrials (+3.36%), while utilities are the only sector negative over one month at -3.02%. The overall picture is one of broad participation with a pronounced rotation toward energy and defensives, while discretionary remains the weakest pocket of the market.
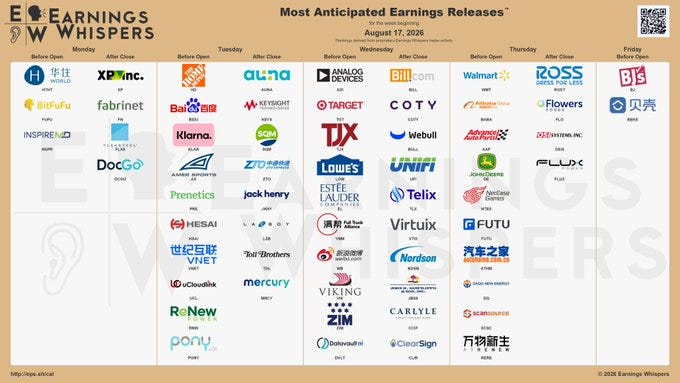
The week of August 17 is more of a retail, consumer, industrial and semiconductor read-through week than a mega-cap tech week, with the biggest reports coming from Home Depot, Target, TJX, Lowe’s, Walmart, Alibaba, Deere, Analog Devices, Baidu, Estée Lauder, BJ’s, Ross Stores, Keysight, BILL, ZIM, CleanSpark, FUTU and Fabrinet. Tuesday brings Home Depot and Baidu before the open with Keysight after hours, Wednesday is the busiest session with Analog Devices, Target, TJX, Lowe’s, Estée Lauder, BILL, COTY and ZIM, while Thursday is the main consumer day with Walmart, Alibaba, Deere, Advance Auto, FUTU and Ross Stores. The key market read-throughs will be Walmart, Target, Home Depot and Lowe’s for consumer spending, ADI, Keysight and Fabrinet for semis and AI infrastructure, Alibaba, Baidu and FUTU for China sentiment, and Deere for industrial and agricultural demand.
☀️ 8:30 AM — NY Empire State Manufacturing Index (Aug) — Est. 10.60 | Prior 15.60
☀️ 10:00 AM — NAHB Housing Market Index (Aug) — Est. 33 | Prior 34
☀️ 11:30 AM — 3-Month Bill Auction — Prior 3.735%
☀️ 11:30 AM — 6-Month Bill Auction — Prior 3.830%
🌙 4:00 PM — TIC Net Long-Term Transactions (Jun) — Prior $232.7B
🌙 4:00 PM — TIC Net Long-Term Transactions Including Swaps (Jun) — Est. $151.40B | Prior $232.70B
🌙 4:00 PM — Overall Net Capital Flow (Jun) — Prior $132.20B
🌙 4:00 PM — U.S. Foreign Buying of Treasury Bonds (Jun) — Prior $56.60B
☀️ 8:30 AM — Export Price Index MoM (Jul) — Prior -0.6%
☀️ 8:30 AM — Housing Starts MoM (Jul) — Prior +19.0%
☀️ 8:30 AM — Housing Starts (Jul) — Est. 1.350M | Prior 1.427M
☀️ 8:30 AM — Import Price Index MoM (Jul) — Est. +0.1% | Prior +0.3%
☀️ 8:30 AM — Building Permits (Jul) — Est. 1.370M | Prior 1.374M
☀️ 8:30 AM — Building Permits MoM (Jul) — Prior -2.6%
☀️ 8:30 AM — Import Price Index YoY (Jul) — Prior +7.1%
☀️ 8:30 AM — Export Price Index YoY (Jul) — Prior +10.2%
☀️ 8:55 AM — Redbook YoY — Prior +8.3%
☀️ 9:15 AM — Industrial Production YoY (Jul) — Prior +1.14%
☀️ 9:15 AM — Industrial Production MoM (Jul) — Est. +0.3% | Prior +0.1%
☀️ 9:15 AM — Manufacturing Production MoM (Jul) — Prior 0.0%
☀️ 9:15 AM — Capacity Utilization Rate (Jul) — Est. 76.3% | Prior 76.1%
☀️ 10:00 AM — Pending Home Sales MoM (Jul) — Est. +0.1% | Prior -5.4%
☀️ 10:00 AM — Pending Home Sales Index (Jul) — Prior 72.5
☀️ 10:45 AM — Atlanta Fed GDPNow (Q3) — Est. 4.3% | Prior 4.3%
🌙 4:30 PM — API Weekly Crude Oil Stock — Prior +9.072M
☀️ 7:00 AM — MBA 30-Year Mortgage Rate — Prior 6.77%
☀️ 7:00 AM — MBA Mortgage Applications WoW — Prior +3.6%
☀️ 7:00 AM — MBA Purchase Index — Prior 157.9
☀️ 7:00 AM — Mortgage Market Index — Prior 248.6
☀️ 7:00 AM — Mortgage Refinance Index — Prior 744.4
☀️ 10:30 AM — EIA Crude Oil Inventories — Prior +17.423M
☀️ 10:30 AM — Cushing Crude Oil Inventories — Prior +1.611M
☀️ 10:30 AM — Gasoline Production — Prior -0.001M
☀️ 10:30 AM — EIA Refinery Crude Runs WoW — Prior +0.026M
☀️ 10:30 AM — Distillate Fuel Production — Prior +0.050M
☀️ 10:30 AM — Crude Oil Imports — Prior +1.768M
☀️ 10:30 AM — Heating Oil Stockpiles — Prior +0.192M
☀️ 10:30 AM — EIA Weekly Refinery Utilization Rates WoW — Prior -0.3%
☀️ 10:30 AM — EIA Weekly Distillates Stocks — Prior -0.010M
☀️ 10:30 AM — Gasoline Inventories — Prior -0.968M
🕓 1:00 PM — 20-Year Bond Auction — Prior 5.163%
🕓 2:00 PM — FOMC Meeting Minutes
☀️ 8:30 AM — Philadelphia Fed Manufacturing Index (Aug) — Est. 24.3 | Prior 41.4
☀️ 8:30 AM — Initial Jobless Claims — Est. 210K | Prior 209K
☀️ 8:30 AM — Philly Fed Employment (Aug) — Prior 10.0
☀️ 8:30 AM — Continuing Jobless Claims — Prior 1.777M
☀️ 8:30 AM — Philly Fed Business Conditions (Aug) — Prior 34.4
☀️ 8:30 AM — Philly Fed New Orders (Aug) — Prior 37.0
☀️ 8:30 AM — Philly Fed CAPEX Index (Aug) — Prior 30.10
☀️ 8:30 AM — Philly Fed Prices Paid (Aug) — Prior 53.90
☀️ 8:30 AM — Jobless Claims 4-Week Average — Prior 199.0K
☀️ 10:00 AM — U.S. Leading Index MoM (Jul) — Est. +0.1% | Prior -0.2%
☀️ 10:30 AM — Natural Gas Storage — Prior +36 Bcf
☀️ 11:30 AM — 4-Week Bill Auction — Prior 3.625%
☀️ 11:30 AM — 8-Week Bill Auction — Prior 3.665%
🕓 1:00 PM — 30-Year TIPS Auction — Prior 2.473%
🌙 4:30 PM — Federal Reserve Balance Sheet — Prior $6.760T
🌙 4:30 PM — Reserve Balances With Federal Reserve Banks — Prior $2.947T
☀️ 9:45 AM — S&P Global Manufacturing PMI (Aug) — Est. 54.0 | Prior 53.9
☀️ 9:45 AM — S&P Global Services PMI (Aug) — Est. 53.9 | Prior 54.6
☀️ 9:45 AM — S&P Global Composite PMI (Aug) — Prior 54.5
🕓 1:00 PM — U.S. Baker Hughes Oil Rig Count — Prior 455
🕓 1:00 PM — U.S. Baker Hughes Total Rig Count — Prior 593
Markets enter the new week with the broader trend still constructive, but several crosscurrents are becoming harder to ignore. The S&P 500 remains near record highs, the Russell 2000 is breaking out and technology has regained momentum, while copper continues to trade constructively and energy reflects elevated geopolitical supply risk. Softer inflation and weaker consumer data have reduced pressure for additional Fed tightening, but the long end of the Treasury curve remains under pressure from deficits, heavy issuance and elevated term premium. At the same time, escalating U.S.-Iran tensions continue to keep a geopolitical premium embedded in crude despite last week’s massive inventory build. For now, earnings strength, broader market participation and cooling inflation continue to support the bull case, but elevated long-term yields, a slowing consumer and increasingly demanding AI expectations and capital-spending assumptions leave the market with considerably less room for disappointment.
The week ahead is relatively light on top-tier data, but there are several important checkpoints for the growth and rates outlook. Housing and industrial production dominate Tuesday, followed by Wednesday’s FOMC minutes and another closely watched EIA inventory report. Thursday brings jobless claims and the Philadelphia Fed survey, offering another read on whether labor and manufacturing conditions are continuing to soften, while Friday’s S&P Global PMIs will provide the clearest broad snapshot of August business activity. Investors will be looking for confirmation that growth is slowing gradually rather than deteriorating sharply, while also watching for any Fed language that could shift expectations for the path of policy.
That’s all for this week.
Eric
No posts
Comments
Nothing yet. Say the first thing.
Sign in to join the conversation.