
Welcome to The Merciless Trade, where I break down significant updates in the financial markets and find connections between them. Preparing you for the week ahead as I flip through charts, analyze the data, and cut through the noise to get an edge.
Now let’s do this…
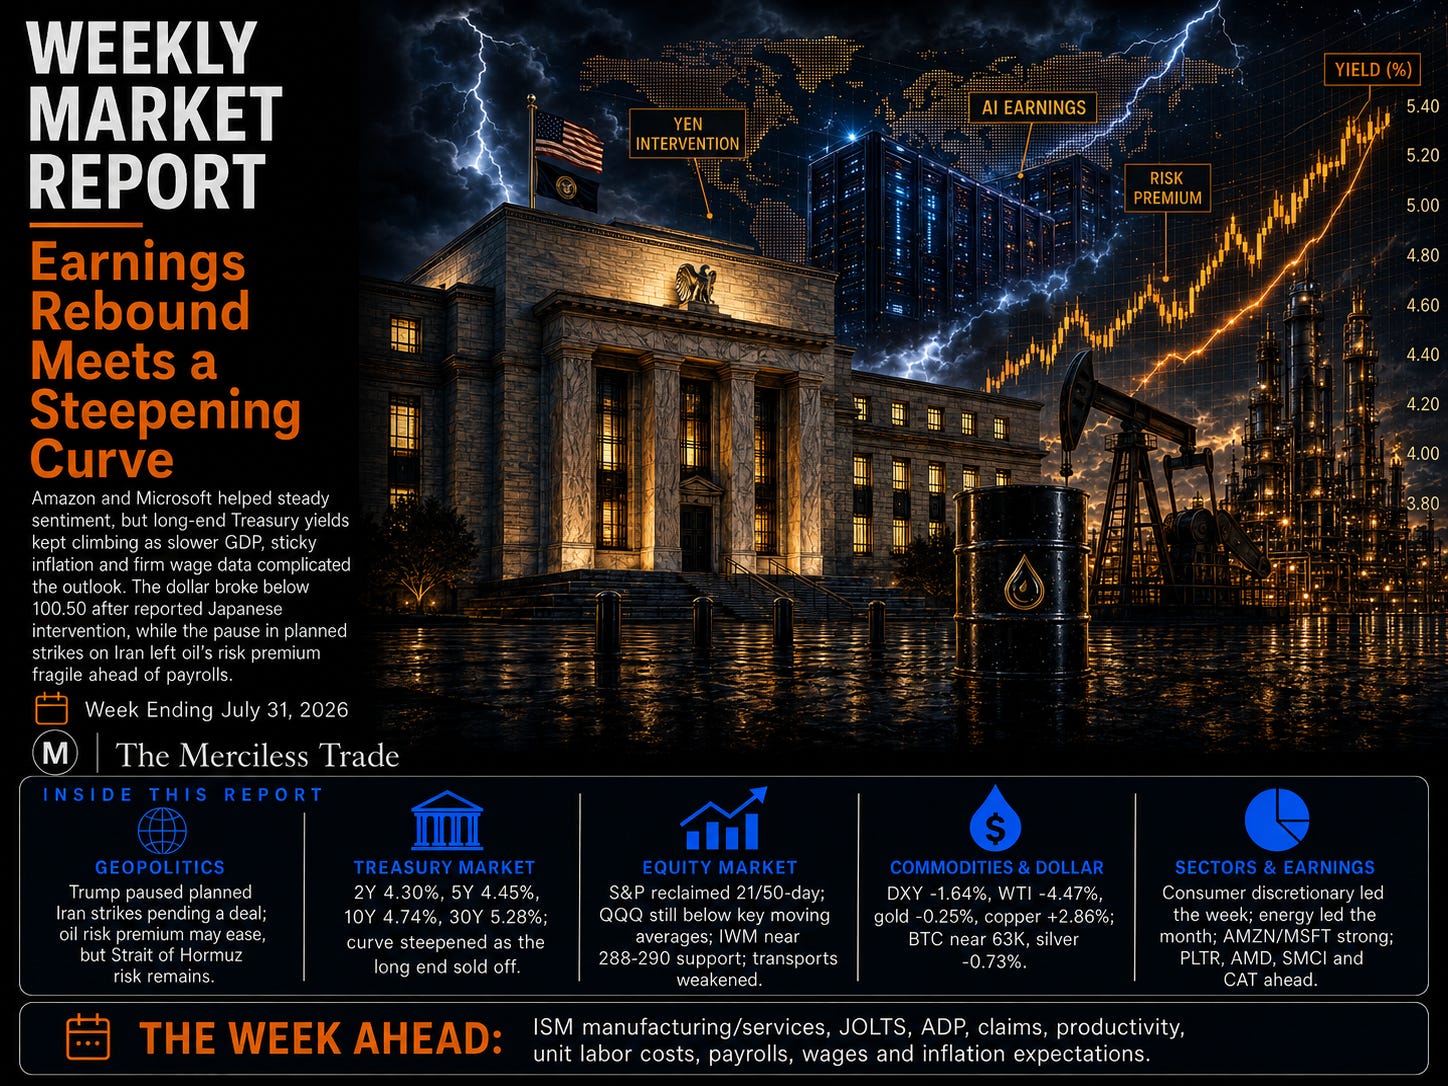
The market spent the week caught between powerful earnings support and an increasingly uncomfortable macro backdrop. Amazon’s stronger-than-expected second-quarter results and accelerating AWS growth helped drive a broad rebound into Friday’s close, lifting the S&P 500 by 0.70% and the Nasdaq by 1%, while Apple moved sharply lower after its outlook was clouded by significant component shortages and weaker-than-expected guidance. The result was another reminder that investors remain willing to reward companies demonstrating tangible returns from artificial-intelligence spending, but are becoming far less tolerant of execution problems, constrained supply and uncertain monetization.
The Federal Reserve added another layer of tension by holding its policy rate unchanged at 3.50%–3.75% despite three officials favoring a quarter-point increase. The Fed maintained that economic activity is expanding at a solid pace and that job growth has kept pace with the workforce, but it also acknowledged that inflation remains elevated relative to its 2% objective. That split is becoming increasingly important: slower second-quarter GDP growth of just 1.5% would ordinarily argue for patience, yet core PCE inflation remained at 3.3%, the GDP price index accelerated sharply, and the Employment Cost Index rose a hotter-than-expected 0.9%. The week therefore delivered something closer to stagflationary pressure than a clean slowdown—softer headline growth without enough cooling in inflation, wages or labor conditions to give the Fed room to ease.
Bond markets reflected that concern more clearly than equities. Short-term yields eased slightly, but aggressive selling in longer maturities pushed the 10-year yield to 4.74% and both the 20-year and 30-year yields to 5.28%, producing a steeper curve and signaling growing unease over inflation, federal borrowing requirements and the term premium. Futures markets now assign only a small probability to rates remaining unchanged through December, with the bulk of expectations centered on between 25 and 50 basis points of additional tightening. The next major test comes with the August 7 employment report, where economists expect only about 88,000 new jobs; a stronger result would reinforce the Fed’s inflation concerns, while a material downside miss could deepen fears that policy is tightening into an increasingly fragile labor market.
Geopolitical risk remains the market’s most immediate wildcard heading into the new week. President Trump canceled a planned new round of strikes against Iran after regional governments presented the outlines of a possible agreement aimed at reopening the Strait of Hormuz and limiting Iran’s nuclear program. That decision represents a temporary pullback from escalation rather than a durable resolution: Iran has not publicly accepted a final agreement, the Strait remains a central point of contention and the United States has made clear that military action could resume if negotiations fail. The initial market reaction may therefore include lower oil prices and some relief for risk assets, but any renewed attacks on shipping, regional energy infrastructure or U.S. forces would quickly restore the geopolitical premium.
Taken together, the market enters August supported by resilient corporate earnings but facing a narrowing path between inflation, slowing growth, rising long-term borrowing costs and geopolitical instability. Friday’s rebound improved the near-term tape, but the underlying message remains less comfortable: earnings are carrying the equity market while the bond market is warning that the cost of capital may remain higher for longer. With another dense earnings calendar and the employment report approaching, the next move will depend on whether corporate strength can continue to outrun the tightening financial and macroeconomic backdrop.
The economic calendar delivered a mixed but increasingly complicated macro picture. Durable-goods orders and core capital-goods demand opened the week on solid footing, while consumer confidence softened and housing data remained firm. The Federal Reserve held its target range at 3.50%–3.75%, but Thursday’s data created the bigger market tension: second-quarter GDP slowed to 1.5%, below expectations, while the GDP price index surged 6.3%, core PCE remained elevated at 3.3% year over year and jobless claims stayed historically low. Friday’s Employment Cost Index also came in slightly hotter than expected, reinforcing persistent wage pressure, although Michigan inflation expectations eased and consumer sentiment improved.
U.S. Baker Hughes Oil Rig Count +1 To 451; U.S. Baker Hughes NatGas Rig Count Unchanged At 127; U.S. Baker Hughes Total Rig Count 588 Vs 587 Prior
Michigan Consumer Expectations For July 55.4 Vs 54.0 Est.
Michigan Consumer Sentiment For July 55.2 Vs 54.4 Est.
Chicago PMI For July 57.6 Vs 56.0 Est
Employment Cost Index (QoQ) (Q2) 0.9% Vs 0.8% Est.
Natural Gas Storage 28B Vs 37B Est.
Personal Spending (MoM) For June 0.3% Vs 0.4% Est.
PCE Price Index (MoM) For June Revises Prior From 0.4% To 0.5%
PCE Price Index (YoY) For June 3.7% Vs 3.7% Est.
GDP Price Index (QoQ) For Q2 6.3% Vs 4.1% Est.; 3.6% Prior
PCE Price Index (MoM) For June -0.1% Vs -0.1% Est.
Core PCE Price Index (YoY) For June 3.3% Vs 3.3% Est.
Continuing Jobless Claims 1,782K Vs 1,800K Est.
GDP (QoQ) For Q2 1.5% Vs 2.1% Est.; 2.1% Prior
Core PCE Price Index (MoM) For June 0.1% Vs 0.2% Est.
Core PCE Prices For Q2 3.40% Vs 3.50% Est.; 4.40% Prior
Initial Jobless Claims 197K Vs 201K Est.
Fed Interest Rate Decision 3.50%-3.75% Vs 3.50%-3.75% Est. (Unchanged)
Gasoline Inventories 0.007M Barrel Build Vs 1.710M Barrel Draw Est.
Weekly Distillates Stocks 1.062M Barrel Build Vs 0.500M Barrel Build Est.
Crude Oil Inventories 7.167M Barrel Draw Vs 700K Barrel Build Est.
Texas Services Sector Outlook For July 6.6 Vs 2.9 Prior
Dallas Fed Services Revenues For July 9.5 Vs 9.8 Prior
Richmond Services Index For July -3 Vs 0 Prior
Richmond Manufacturing Shipments For July 8 Vs 4 Prior
Richmond Manufacturing Index For July 5 Vs 7 Est.
CB Consumer Confidence For July 90.8 Vs 92.4 Est.
House Price Index (MoM) For May 0.3% Vs 0.1% Est
S&P/CS HPI Composite - 20 n.s.a. (YoY) For May 1.6% Vs 1.3% Est.
Redbook Retail Sales Index For July 2026 Vs July 2025: 8.1% YoY
Redbook Retail Sales Index Up 8.3% YoY For Week Ended 7/25/26
Retail Inventories Ex Auto For June -0.2% Vs 0.2% Prior
Goods Trade Balance For June -101.50B Vs -100.30B Est.; -105.89B Prior
ADP Employment Change Weekly 15.00K Vs 16.50K Prior
Durable Goods Excluding Defense (MoM) For June 0.3% Vs -4.3% Prior
Core Durables Goods Orders (MoM) For June 0.6% Vs 0.9% Est.
Treasury yields continued to move higher at the long end over the past week even as the short end pulled back, producing a noticeably steeper yield curve. The 2-year yield fell 5 basis points to 4.30%, while the 5-year edged up 1 basis point to 4.45%. Selling was more pronounced in longer-dated Treasuries, pushing the 10-year yield 5 basis points higher to 4.74%, while the 20-year and 30-year yields rose 10 and 12 basis points, respectively, with the 20-year closing at 5.28%. Unlike the prior week’s broad-based surge in yields, this week’s move was concentrated at the long end, signaling that investors remain increasingly concerned about fiscal deficits, inflation risk and rising term premiums even as expectations for the near-term policy rate softened slightly.
The 2-Year closed at 4.30%
The 5-Year closed at 4.45%
The 10-Year closed at 4.74%
The 20-Year closed at 5.28%
The 30-Year closed at 5.28%
For the September 16 Fed meeting, markets are currently pricing a 33% chance that rates remain unchanged, and a 67% probability of a 25-basis-point hike.
For the October 28 meeting, markets price a 22.8% probability that rates remain unchanged, a 56.5% probability of one 25-basis-point hike and a 20.8% probability of 50 basis points of cumulative hikes.
For the December 9 Fed meeting, markets are pricing in just a 12.1% probability that rates remain unchanged, compared with a 40.7% chance of a 25-basis-point hike and a 37.5% probability of a 50-basis-point increase. There is also a smaller 9.7% chance of a 75-basis-point hike, leaving the market overwhelmingly positioned for additional tightening by year-end.
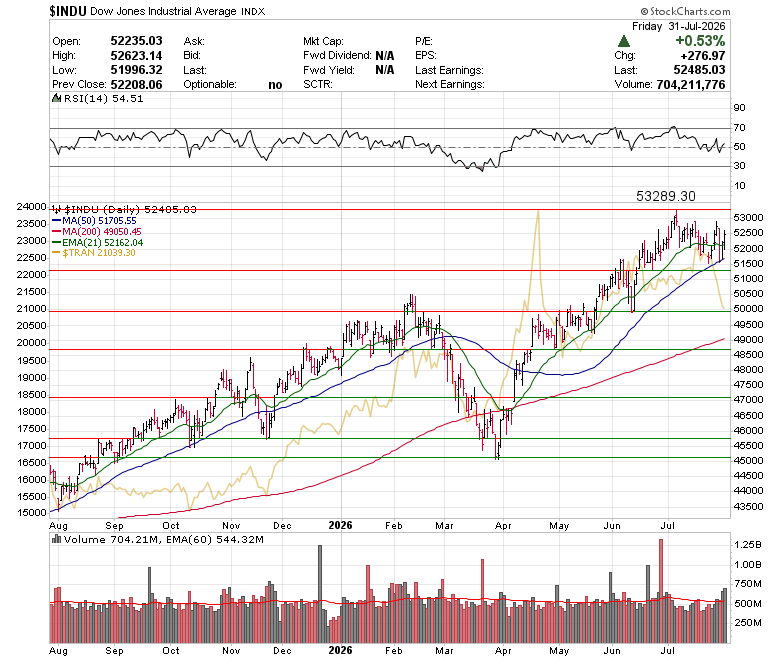
The Dow Jones Industrial Average gained 0.53% on Friday to close at 52,485.03, bouncing from its 50-day moving average and settling slightly above the midpoint of its July range. The index is now 804 points, or roughly 1.53%, below its all-time high of 53,289.30. Compared with the steady advance seen through May and June, July looks more like a sideways consolidation and modest mean-reversion move than a meaningful trend break. A move back through 53,000–53,300 would confirm that the broader uptrend has resumed, while another failure near that area would keep the index trapped in its July range. In sharp contrast, the Dow Transports fell 6.39% for the week to close at 21,039.30, breaking below both the 21-day EMA and 50-day moving average as relative performance versus the S&P 500 deteriorated. With RSI falling toward oversold territory, the transports are now testing the 21,000 area, while the longer-term rising trendline and support near 20,300–20,500 become the next important downside levels. The divergence between the Industrials holding near record highs and the Transports breaking lower is a clear warning that the broader cyclical trend has weakened.
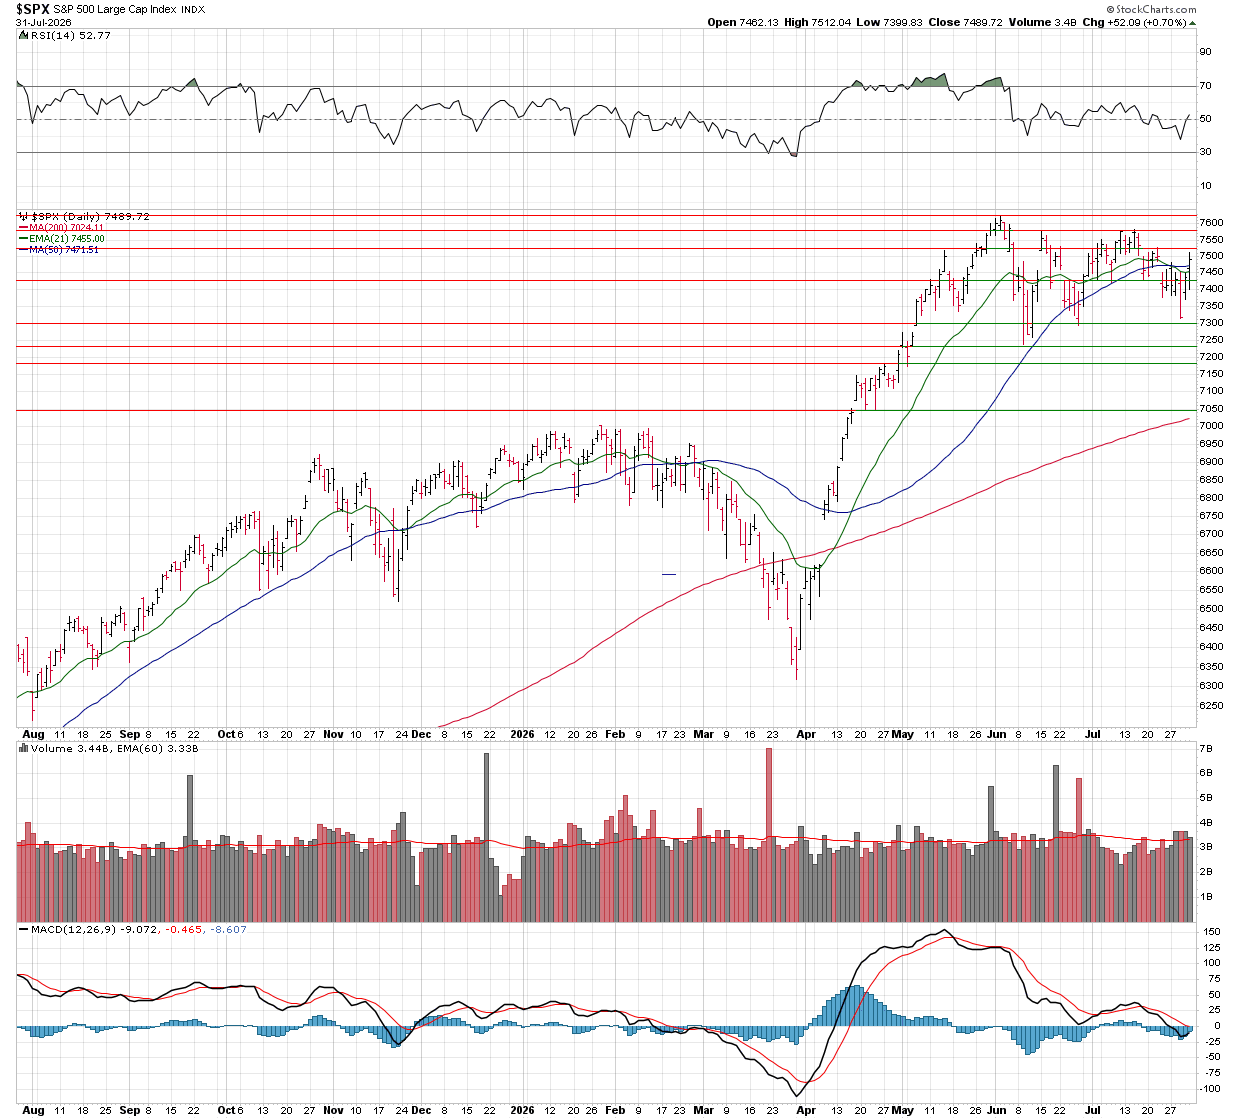
The S&P 500 gained 0.70% on Friday to finish at 7,489.72, reclaiming both the 21-day EMA and 50-day moving average while moving back toward its two-week high near 7,526. The RSI climbed back above 50, signaling improving momentum, while the MACD remains slightly below the zero line but is beginning to turn higher. Holding above the 7,450–7,475 area would keep the rebound intact, while a break above 7,525 would put the recent highs near 7,575–7,600 back in play.
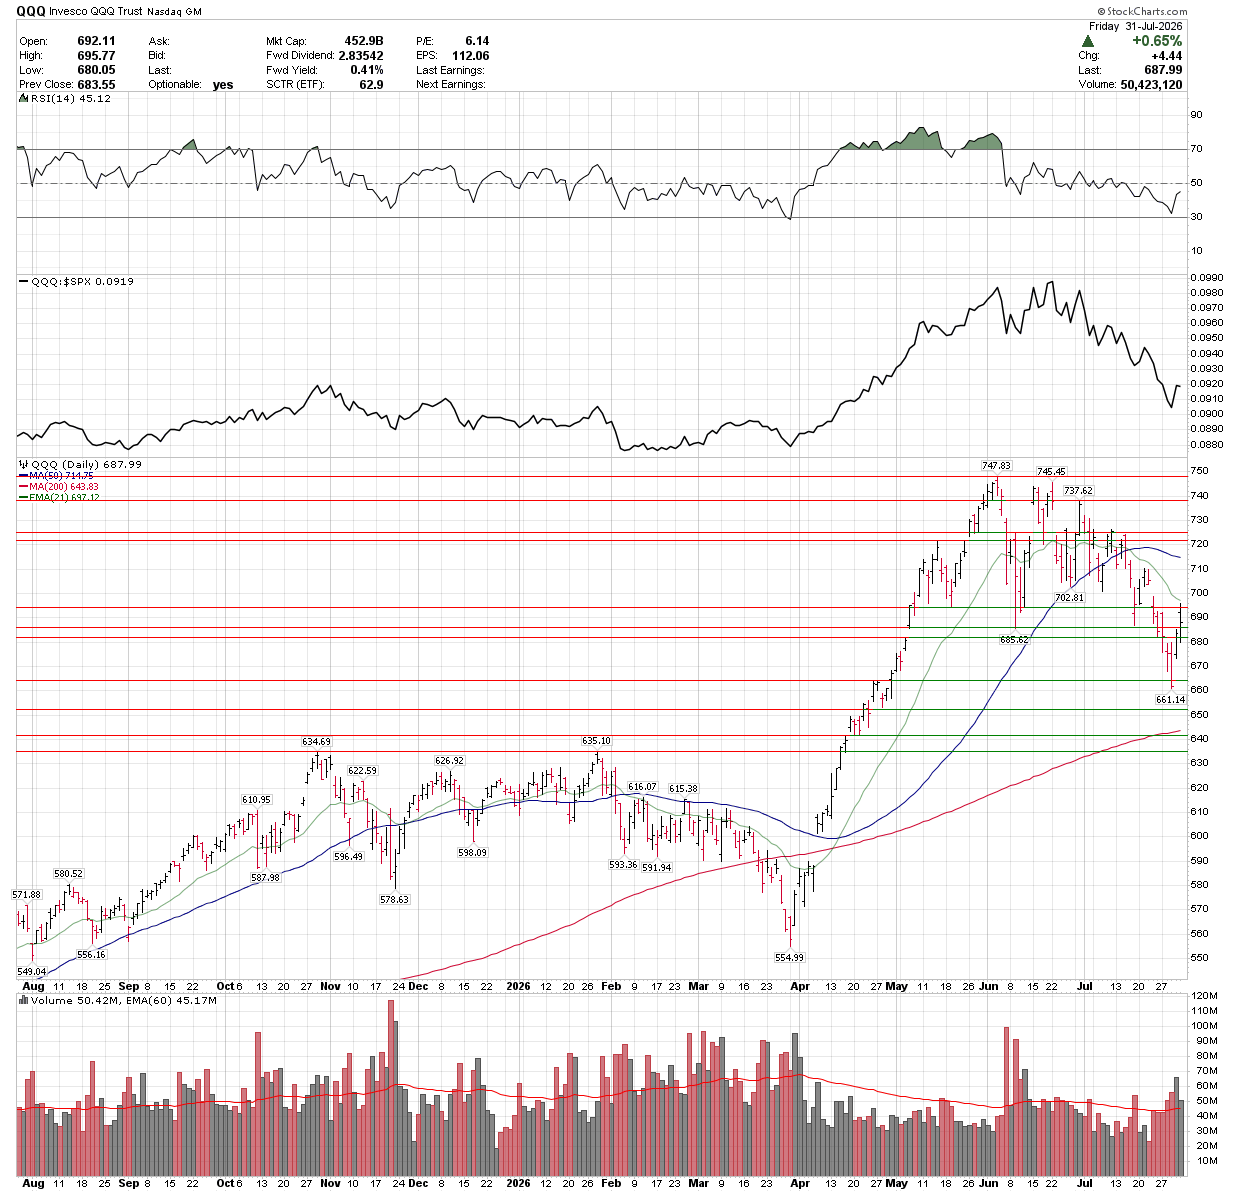
The QQQ gained 0.65% on Friday to close at 687.99, recovering sharply after falling to nearly 661 at the midweek low. The rebound was fueled by strong reactions to Microsoft and Amazon earnings, but the index still finished below both its 21-day EMA near 697 and 50-day moving average near 715, leaving the short-term trend damaged. RSI recovered to roughly 45 from near-oversold levels, while relative performance versus the S&P 500 remains weak. A sustained move back above 697–703 would improve the setup, with the 50-day near 715 the more important resistance level, while failure to hold 680–685 would leave the recent low near 661 vulnerable to another test.
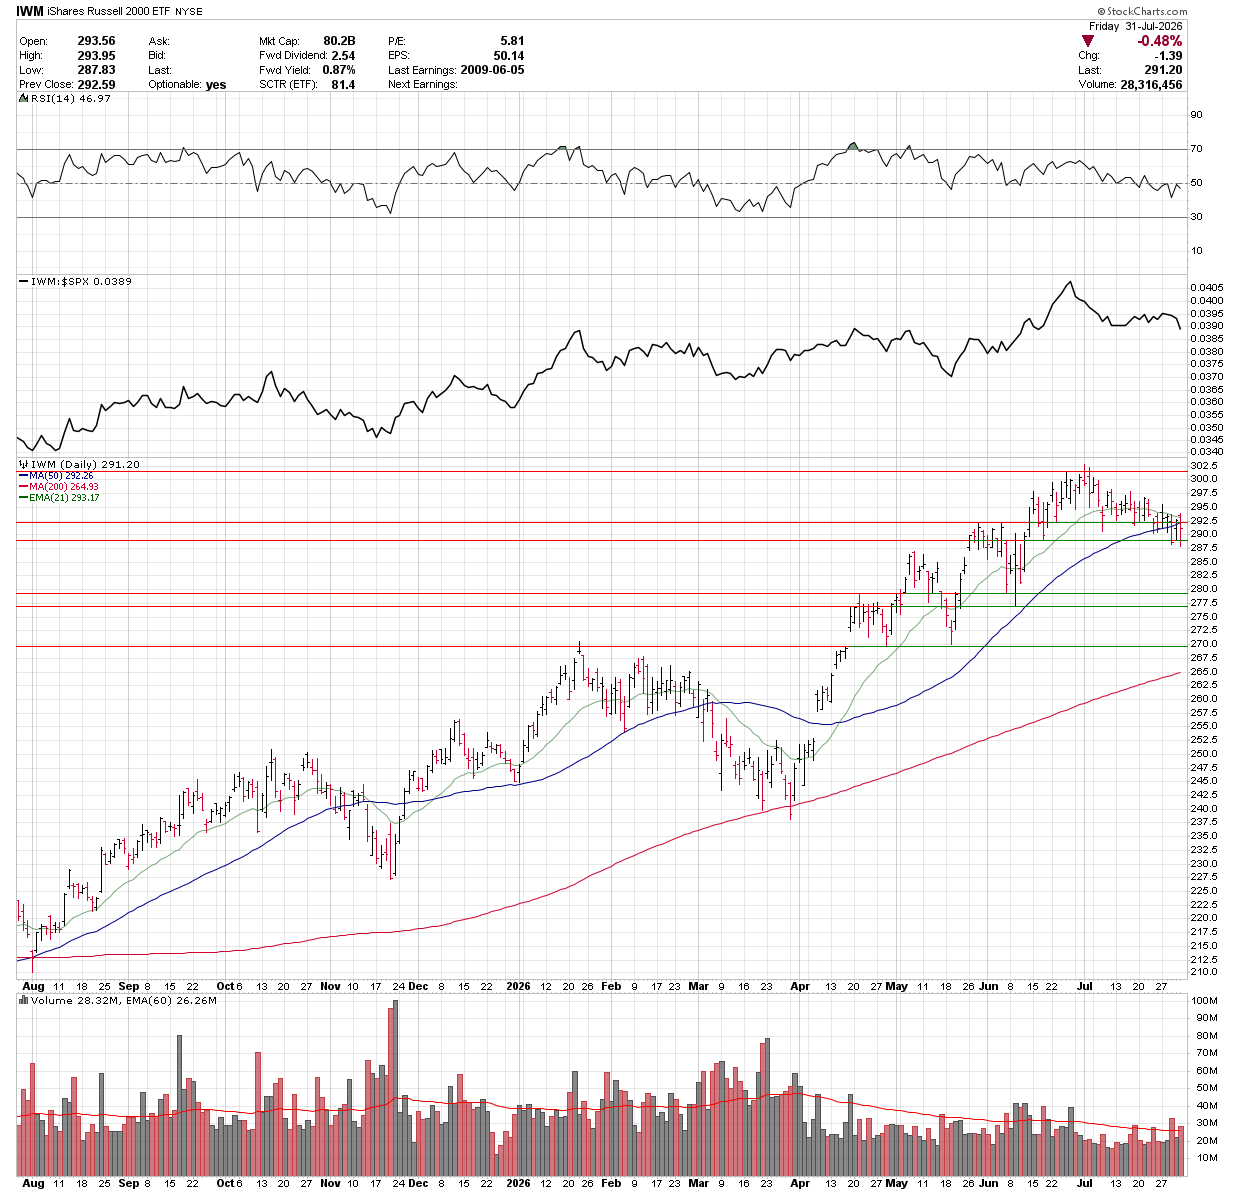
The Russell 2000 finished essentially flat, edging up 0.01% to close at 291.20 as buyers continued to defend the 288–290 support zone. The index remains just below its 21-day EMA near 293.17 and 50-day moving average near 292.26, leaving it at an important short-term inflection point. RSI is holding just under 50, while relative performance versus the S&P 500 has begun to soften after improving through much of the spring. A move back above 293–295 would strengthen the case for another push toward 300–302, while a break below 288 would expose the next support area near 278–280.
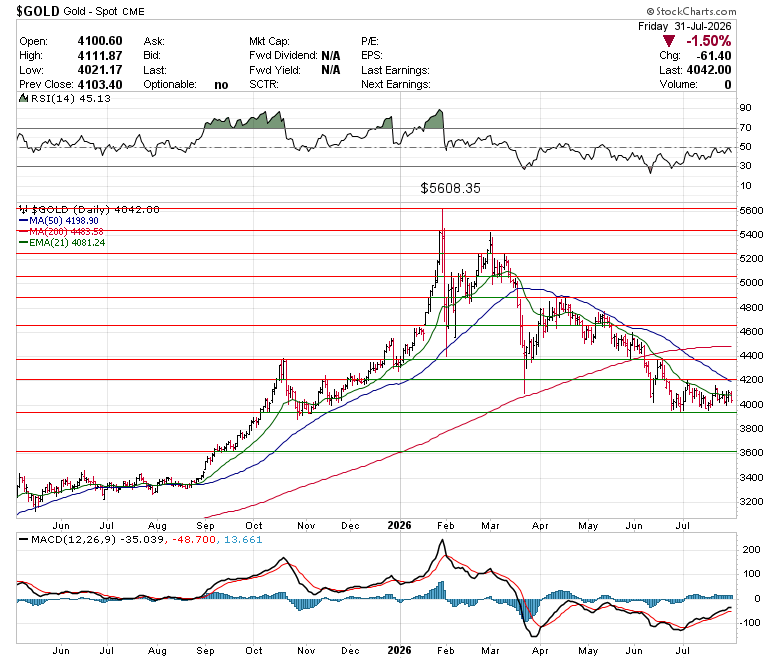
Gold slipped 0.25% to close near $4,042, leaving it roughly in the middle of its one-month range as it continues to consolidate just above the psychologically important $4,000 level. The metal remains below its declining 21-day EMA near $4,081 and well below the 50-day moving average near $4,199, so the broader short-term trend is still weak despite the recent stabilization. RSI has recovered into the mid-40s and MACD is improving from deeply negative territory, suggesting downside momentum is fading, but buyers have not yet regained control. Holding the $3,950–$4,000 area would preserve the developing base, while a break above $4,100 would be the first sign of a stronger rebound and could open a move toward $4,200. A failure at current levels would put the recent lows near $3,900–$3,950 back in focus.
The U.S. Dollar Index fell 1.64% for the week to close at 99.80, as the yen surged following reported Japanese currency intervention. The decline pushed the dollar below key support near 100.50 and beneath both its 21-day EMA and 50-day moving average, leaving the index close to a more important support zone around 99.00–99.20, where the rising 200-day moving average currently sits. A decisive break below that area would weaken the medium-term technical structure and expose the 97.50–98.00 region, while a recovery back above 100.50 would suggest the intervention-driven decline is beginning to fade.
Silver fell 0.73% to close at $57.56, holding just above an important support zone near $55. The metal remains below its declining 20-day EMA, 50-day moving average and 200-day moving average, keeping the broader technical structure under pressure following the sharp decline from its January peak. Momentum has begun to stabilize, with the MACD turning modestly higher, but the RSI near 43 still reflects weak demand. A sustained break below $55 would expose the $50–$52 area, while silver would need to reclaim $60–$61 and then the 200-day moving average near $64 to signal a more meaningful recovery.
Copper rose 2.86% this past week to close at $6.48 per pound, finishing near its highest level in roughly two months. The metal remains firmly above its 20-day, 50-day and 200-day moving averages, while improving momentum has brought the January and May highs back into focus. Copper is now approaching the record area near $6.65, although the precise all-time high can vary by contract and data provider, with some continuous futures series showing levels above $6.70.
WTI crude fell 4.47% for the week to close at $86.42 per barrel, despite rebounding 3.39% on Friday. Oil remained above its rising 21-day EMA near $81.89 and 50-day moving average around $82.22, preserving the short-term recovery structure, but it failed to hold the week’s spike above $92. With the United States holding off on additional strikes against Iran while negotiations continue, some of the geopolitical risk premium could unwind when trading resumes Sunday evening. That leaves WTI vulnerable to an initial move back toward $82–$83, although renewed military escalation or disruption around the Strait of Hormuz could quickly reverse that decline.
Bitcoin fell roughly 2%–3% on the week, slipping back below both its 21-day EMA and 50-day moving average over the last several sessions and closing near $63,243. Price is sitting just above an important support shelf in the $61,000–$62,000 area after failing to hold the rebound toward roughly $67,000 two weeks ago. Momentum remains soft, with RSI near 46, and the broader trend is still weak below the declining 200-day moving average near $71,300. Any positive progress on crypto market-structure legislation such as the CLARITY Act could help sentiment at the margin by reinforcing the case for clearer regulatory treatment, but the chart still needs a move back above the 21-day and 50-day averages—and then through the $66,000–$67,000 zone—to improve the near-term technical picture. A break below $61,000 would raise the risk of another leg lower.
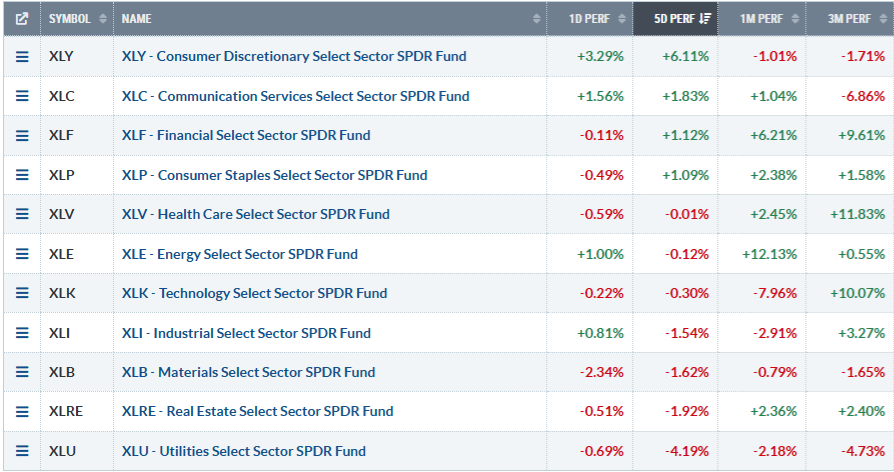
Sector performance was mixed over the past five days, with consumer discretionary leading at 6.11%, followed by communication services and financials, while utilities, real estate, materials and industrials lagged. Over the past month, leadership shifted sharply toward energy, which gained 12.13%, and financials, up 6.21%, while technology fell 7.96% and became the clear underperformer. The three-month picture remains stronger overall, led by health care at 11.83%, technology at 10.07% and financials at 9.61%, showing that technology’s recent weakness is still a pullback within a solid medium-term trend, while communication services and utilities remain the weakest sectors over that period.
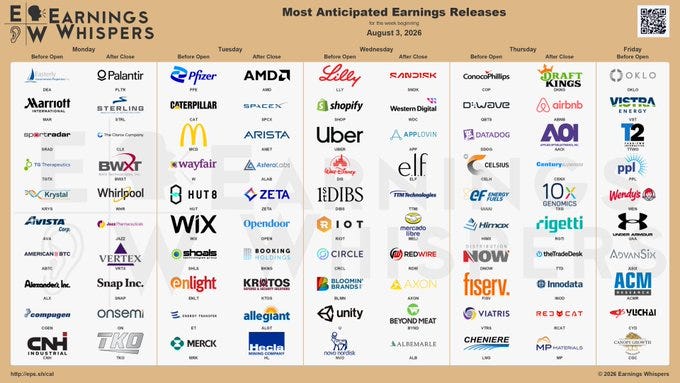
The earnings calendar remains crowded next week, with several high-profile reports capable of driving sharp moves across technology, consumer, industrial and energy stocks. Palantir headlines Monday after the close, followed Tuesday by Pfizer, Caterpillar and McDonald’s before the bell, with AMD, Arista Networks, Super Micro and Snap reporting after hours. Wednesday brings Eli Lilly, Shopify and Uber before the open, while AppLovin, DoorDash and Airbnb report later in the week. Energy exposure will also be active through ConocoPhillips, Occidental and several smaller producers, while Friday closes with Oklo, Vistra and PPL. The broad mix should provide an important read on AI spending, advertising demand, consumer resilience, industrial activity and power demand.
🕓 9:45 AM — S&P Global Manufacturing PMI (Jul): Est. 53.8 | Prior 53.8
🕓 10:00 AM — ISM Manufacturing PMI (Jul): Est. 54.0 | Prior 53.3
🕓 10:00 AM — ISM Manufacturing Prices (Jul): Est. 70.0 | Prior 73.0
🕓 10:00 AM — ISM Manufacturing Employment (Jul): Prior 49.7
🕓 10:00 AM — Construction Spending MoM (Jun): Est. 0.2% | Prior 0.1%
🕓 10:00 AM — ISM Manufacturing New Orders (Jul): Prior 56.0
🕓 11:30 AM — Atlanta Fed GDPNow (Q3)
🌙 2:00 PM — Senior Loan Officer Opinion Survey
☀️ 8:30 AM — Trade Balance (Jun): Est. –$73.00B | Prior –$77.60B
🕓 10:00 AM — JOLTS Job Openings (Jun): Est. 7.420M | Prior 7.594M
🕓 10:00 AM — Factory Orders MoM (Jun): Est. 0.0% | Prior –1.3%
🕓 10:00 AM — IBD/TIPP Economic Optimism (Aug): Est. 47.5 | Prior 45.5
🕓 11:30 AM — Atlanta Fed GDPNow (Q3)
🌙 2:00 PM — Total Vehicle Sales (Jul): Prior 16.50M
🌙 4:30 PM — API Weekly Crude-Oil Inventories: Prior +3.296M
☀️ 8:15 AM — ADP Nonfarm Employment Change (Jul): Est. 71K | Prior 98K
🕓 9:45 AM — S&P Global Services PMI (Jul): Est. 53.6 | Prior 53.6
🕓 9:45 AM — S&P Global Composite PMI (Jul): Est. 53.6 | Prior 53.6
🕓 10:00 AM — ISM Services PMI (Jul): Est. 54.2 | Prior 54.0
🕓 10:00 AM — ISM Services Prices (Jul): Prior 67.7
🕓 10:00 AM — ISM Services Employment (Jul): Prior 51.2
🕓 10:00 AM — ISM Services New Orders (Jul): Prior 55.1
🕓 10:30 AM — EIA Crude-Oil Inventories: Prior –7.167M
🌙 4:05 PM — Fed Governor Cook Speaks
☀️ 5:30 AM — Challenger Job Cuts (Jul): Prior 45.849K
☀️ 8:30 AM — Initial Jobless Claims: Est. 205K | Prior 197K
☀️ 8:30 AM — Unit Labor Costs QoQ (Q2): Est. 2.1% | Prior 1.8%
☀️ 8:30 AM — Nonfarm Productivity QoQ (Q2): Est. 0.7% | Prior 0.3%
☀️ 8:30 AM — Continuing Jobless Claims: Prior 1.782M
🕓 10:00 AM — Wholesale Inventories MoM (Jun): Est. 0.3% | Prior 0.3%
🕓 10:30 AM — Natural-Gas Storage: Prior +28B
🕓 11:30 AM — Atlanta Fed GDPNow (Q3)
☀️ 8:30 AM — Nonfarm Payrolls (Jul): Est. 88K | Prior 57K
☀️ 8:30 AM — Unemployment Rate (Jul): Est. 4.2% | Prior 4.2%
☀️ 8:30 AM — Average Hourly Earnings MoM (Jul): Est. 0.3% | Prior 0.3%
☀️ 8:30 AM — Average Hourly Earnings YoY (Jul): Prior 3.5%
☀️ 8:30 AM — Private Payrolls (Jul): Prior 49K
☀️ 8:30 AM — Manufacturing Payrolls (Jul): Prior 3K
☀️ 8:30 AM — Labor-Force Participation Rate (Jul): Prior 61.5%
☀️ 8:30 AM — Average Weekly Hours (Jul): Prior 34.3
🕓 10:00 AM — Richmond Fed President Barkin Speaks
🕓 11:00 AM — NY Fed One-Year Inflation Expectations (Jul): Prior 3.7%
🌙 3:00 PM — Consumer Credit (Jun): Est. $12.10B | Prior –$0.18B
The week begins with manufacturing and services activity data before shifting decisively toward the labor market. Monday’s ISM manufacturing report will provide the first major test of growth, employment and price pressures, followed Tuesday by JOLTS and Wednesday by ADP and the ISM services survey. Thursday’s claims, productivity and unit-labor-cost data will set the stage for Friday’s employment report, where payroll growth is expected to improve modestly to 88,000 while unemployment holds at 4.2%. With wage growth and labor costs still central to the inflation outlook, Friday’s report carries the greatest potential to move Treasury yields, the dollar and expectations for the Federal Reserve’s next policy decision.
Beyond the calendar, the market enters the week caught between resilient earnings and a tightening financial backdrop. The S&P 500 has reclaimed its short-term moving averages, but the QQQ remains below key resistance, the Russell 2000 is still near an inflection point and the sharp weakness in the Dow Transports continues to warn that broader cyclical participation has deteriorated. The combination of a steepening Treasury curve, persistent inflation pressure and expectations for additional Fed tightening leaves equities vulnerable to any upside surprise in wages, payrolls or services prices. Strong results from Amazon and Microsoft have stabilized sentiment, but earnings will need to keep outrunning higher long-term yields and weakening breadth, while the unresolved Iran situation remains an additional source of volatility through oil prices and inflation expectations.
That’s all for this week’s report.
Eric
No posts
Comments
Nothing yet. Say the first thing.
Sign in to join the conversation.