
Welcome to The Merciless Trade, where I break down significant updates in the financial markets and find connections between them. Preparing you for the week ahead as I flip through charts, analyze the data, and cut through the noise to get an edge.
Now let’s do this…
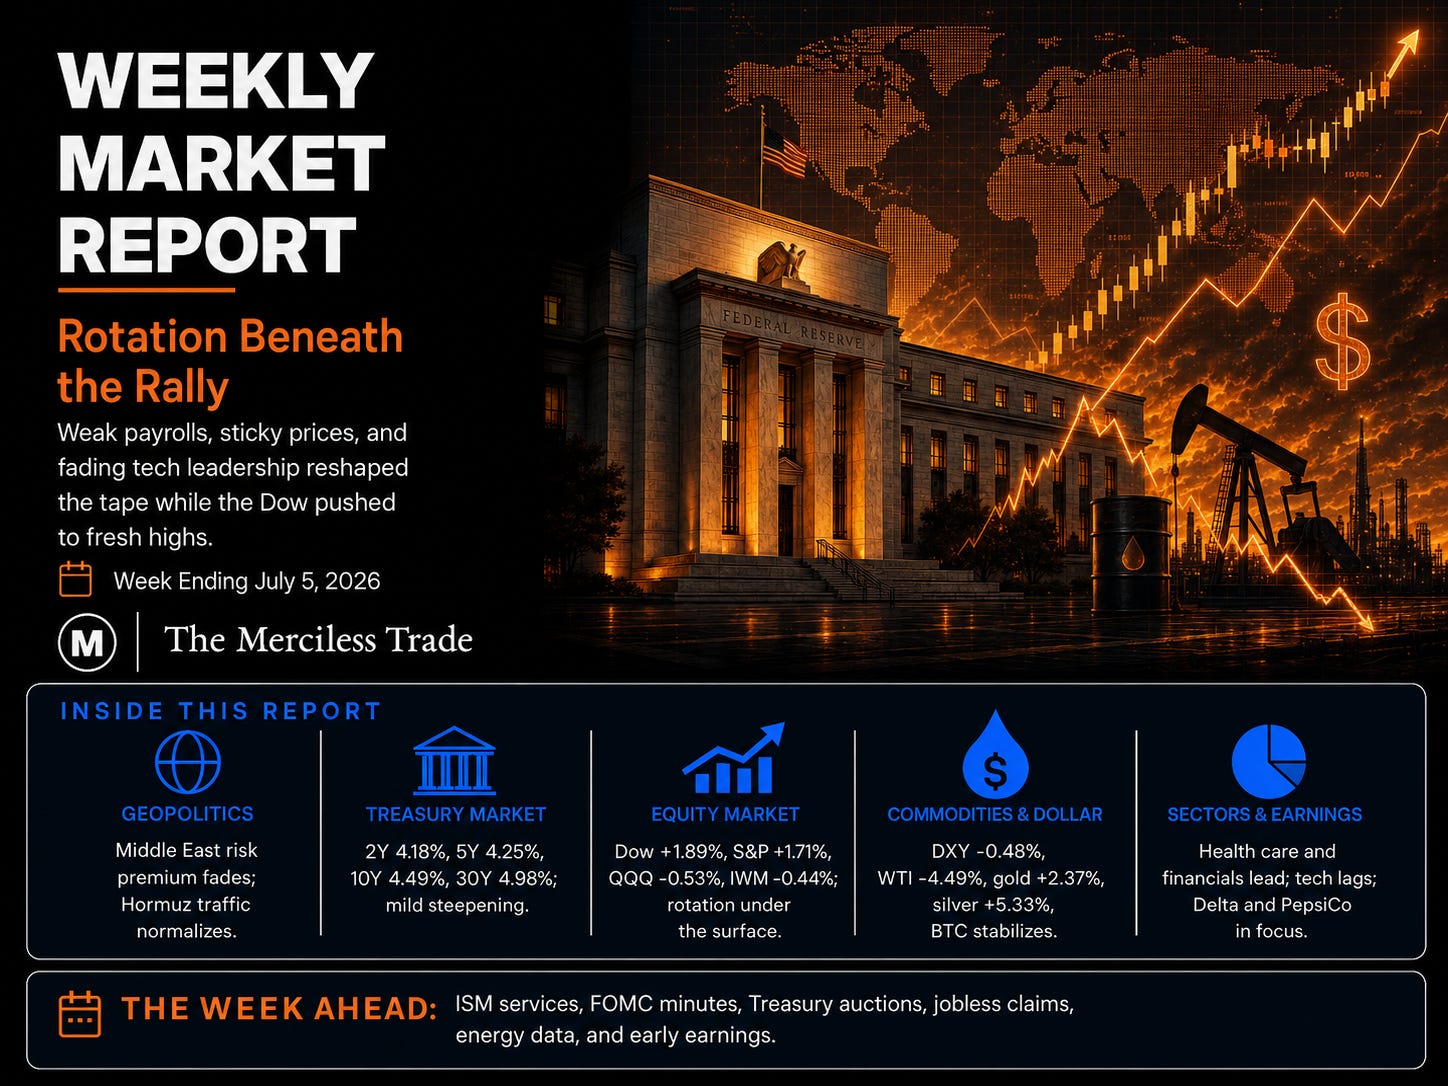
Markets entered July with a familiar headline — major indexes still near highs — but the action underneath told a more complicated story. The Dow and S&P 500 pushed higher, with the Dow notching another record close, yet the rally was no longer being led cleanly by the same crowded AI and mega-cap growth names that carried much of the spring advance. QQQ and IWM faded late in the week, technology lagged, and SPY saw a five-day net outflow of more than $7 billion even as the broader tape held together. That is not a sign of panic, but it is a sign of a market becoming more selective.
The shift came as investors were forced to balance three competing narratives: a softer labor market, sticky inflation pressure, and growing questions around AI valuations. The June jobs report was weak enough to raise concerns about hiring momentum, but not clean enough to settle the Fed debate, especially with ISM prices still elevated despite cooling from May. Kevin Warsh added to that tension during his appearance in Sintra, pushing back on expectations for easier policy, reaffirming the Fed’s 2% inflation target, and refusing to offer forward guidance on the next rate move. At the same time, warnings from Goldman Sachs, Citi, and Jeremy Grantham kept pressure on the AI trade, while health care, financials, and defensive groups picked up leadership.
Commodities and currencies reinforced the same split. Crude continued to unwind as Middle East risk premium faded and Strait of Hormuz traffic normalized, while gold and silver bounced as rate fears cooled. The dollar pulled back into support, and Bitcoin stabilized near $60,000 after reclaiming its 21-day EMA. Taken together, last week was not about one clean macro message. It was about a market repricing policy expectations, geopolitical risk, and leadership quality at the same time.
Last week’s economic data painted a mixed but clearly softer picture of the U.S. economy. The biggest signal came from the labor market, where June nonfarm payrolls rose just 57,000 versus expectations for 114,000, private payrolls increased only 49,000, and prior months were revised sharply lower. The unemployment rate improved to 4.2%, but that was helped by a drop in labor-force participation to 61.5%, making the headline stronger than the underlying details. Manufacturing remained in expansion, with ISM Manufacturing PMI at 53.3, though it missed expectations, while prices stayed elevated at 73.0, keeping the inflation picture from looking fully clean. Consumer confidence softened, construction spending was flat, and factory orders declined less than feared. Energy data leaned bullish, with large crude and gasoline inventory draws and a modest rise in the Baker Hughes rig count.
Baker Hughes Oil Rig Count +5 to 445; NatGas Rig Count +1 to 126; Total Rig Count 580 vs. 573 prior
Durables Excluding Defense (MoM) For May -4.6% Vs -4.6% Prior
Factory Orders (MoM) For May -1.3% Vs -1.7% Est
Private Nonfarm Payrolls For June Revises Prior From 120K To 97K
Nonfarm Payrolls For June Revises Prior From 172K To 129K
Private Nonfarm Payrolls For June 49K Vs 110K Est.
Manufacturing Payrolls For June 3.000K vs 3.000K Est; Prior -2.000K
Unemployment Rate For June 4.2% Vs 4.3% Est.
Participation Rate For June 61.5% Vs 61.8% Prior
Continuing Jobless Claims 1,814K Vs 1,810K Est.
U6 Unemployment Rate For June 7.9% Vs 8.1% Prior
Average Hourly Earnings (YoY) For June 3.5% Vs 3.5% Est.
Nonfarm Payrolls For June 57K Vs 114K Est.
Average Hourly Earnings (MoM) For June 0.3% Vs 0.3% Est.
Gasoline Inventories 2.333M Barrel Draw Vs 0.950M Barrel Draw Est.
Construction Spending (MoM) For May 0.1% Vs 0.1% Est.
ISM Manufacturing Employment For June 49.7 Vs 48.6 Prior
ISM Manufacturing Prices For June 73.0 Vs 77.7 Est.
ISM Manufacturing PMI For June 53.3 Vs 53.8 Est.
S&P Global Manufacturing PMI For June 53.9 Vs 55.7 Est
ADP Nonfarm Employment Change For June 98K Vs 118K Est.
API Crude Oil Stock 6.072M Barrel Draw Vs 0.765M Barrel Draw Prior
Dallas Fed Services Revenues For June 9.8 Vs 5.0 Prior
Texas Services Sector Outlook For June 2.9 Vs -7.7 Prior
JOLTS Job Openings For May 7.594M Vs 7.280M Est
CB Consumer Confidence For June 91.2 Vs 94.4 Est.
Chicago PMI For June 56.7 Vs 55.7 Est
Redbook Retail Sales Index Up 10.5% YoY For Week Ended 6/27/26
Redbook Retail Sales Index For June 2026 Vs June 2025: 9.7% YoY
Dallas Fed Texas Manufacturing Output Index 4.1 In June Vs 9.4 In May
Dallas Fed Mfg Business Index For June 0.0 Vs 0.4 Prior
The Treasury curve was pulled between two forces last week—softer labor data that argued for a more cautious Fed path, and sticky inflation/supply signals that kept pressure on the long end. Yields backed up early as firmer manufacturing data, elevated ISM prices, and bullish oil inventory draws challenged the clean slowdown narrative. By midweek, the 2-year was near 4.18% and the 10-year near 4.46%, before the weak jobs report shifted the tone. Payrolls rose just 57,000, private payrolls slowed to 49,000, and prior months were revised lower, giving the front end some relief as traders questioned how much more tightening the economy can absorb. The long end, however, held firmer as price pressures, energy strength, Treasury supply, and term-premium concerns remained in play. The result was a mild steepening bias: the market became more sensitive to labor weakness at the front end, but stopped short of declaring the inflation and fiscal-risk story over.
The 2-Year closed at 4.18%
The 5-Year closed at 4.25%
The 10-Year closed at 4.49%
The 20-Year closed at 4.99%
The 30-Year closed at 4.98%
For July 29, markets price a 78.1% chance rates stay unchanged, a 21.9% chance of a 25-basis-point hike.
For the September 16 Fed meeting, markets are currently pricing a 45.4% chance that rates remain unchanged, with a 45.4% chance of a 25-basis-point hike, a 9.2% chance of a 50-basis-point hike.
For the October 28 Fed meeting, the odds now show a 30.8% chance of rates remaining steady, while the combined probability of at least one hike is roughly 69.2%. A 25-basis-point hike is the single most likely outcome at 45.4%, followed by a 20.8% chance of a 50-basis-point hike and a 2.9% chance of a 75-basis-point hike.
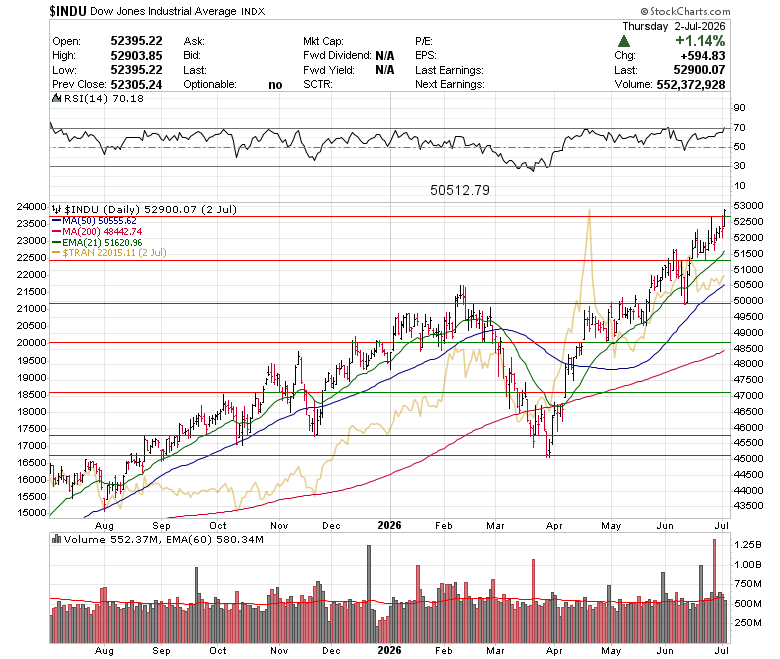
The Dow Jones Industrials gained 1.89% last week, finishing Friday with another record close at 52,900.27. The index remains in a strong short-term uptrend, with buyers continuing to press the breakout after clearing the prior high area. Near-term support should now come in around the former breakout/range zone near 52,000–52,650, while the rising 21-day EMA near 51,620 is the more important trend-support level below that. Momentum is strong, with RSI pushing into overbought territory, so some consolidation would not be surprising. But as long as the Dow holds above the prior highs and the 21-day EMA, the trend remains constructive and pullbacks still look more like digestion than a confirmed reversal. The Dow Transports also moved higher, gaining 0.38% and closing back above 22,000, but the group remains stuck in the middle of its one-month range. That keeps the transport signal supportive, but not yet confirming a fresh breakout alongside the Industrials.
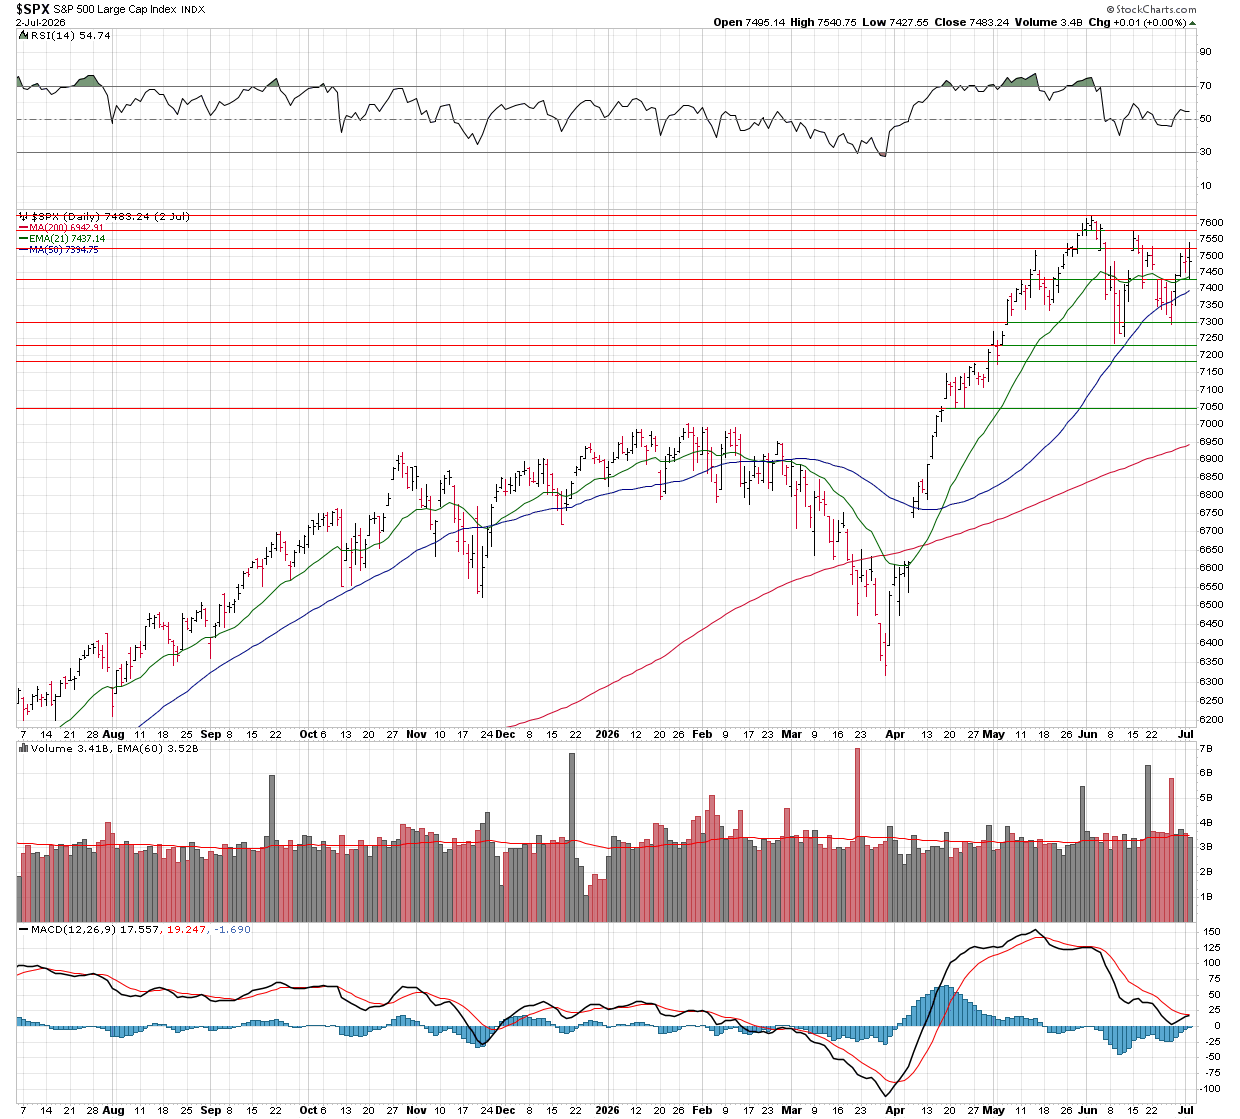
The S&P 500 rose 1.71% last week, rebounding after finding support near 7,430, almost directly in line with the rising 21-day EMA at 7,437.14. That keeps the short-term uptrend intact, with buyers continuing to defend the first major moving-average test. The index still sits below the recent high near 7,600, so the next test is whether it can reclaim the upper end of the range and push back toward fresh highs. Momentum has cooled from overbought levels, but RSI remains constructive and MACD is trying to stabilize after the recent pullback. As long as the 21-day EMA holds, the setup remains more consolidation than breakdown; a decisive loss of that area would shift focus toward the 50-day MA near 7,395 and then the prior support zone around 7,300–7,250.
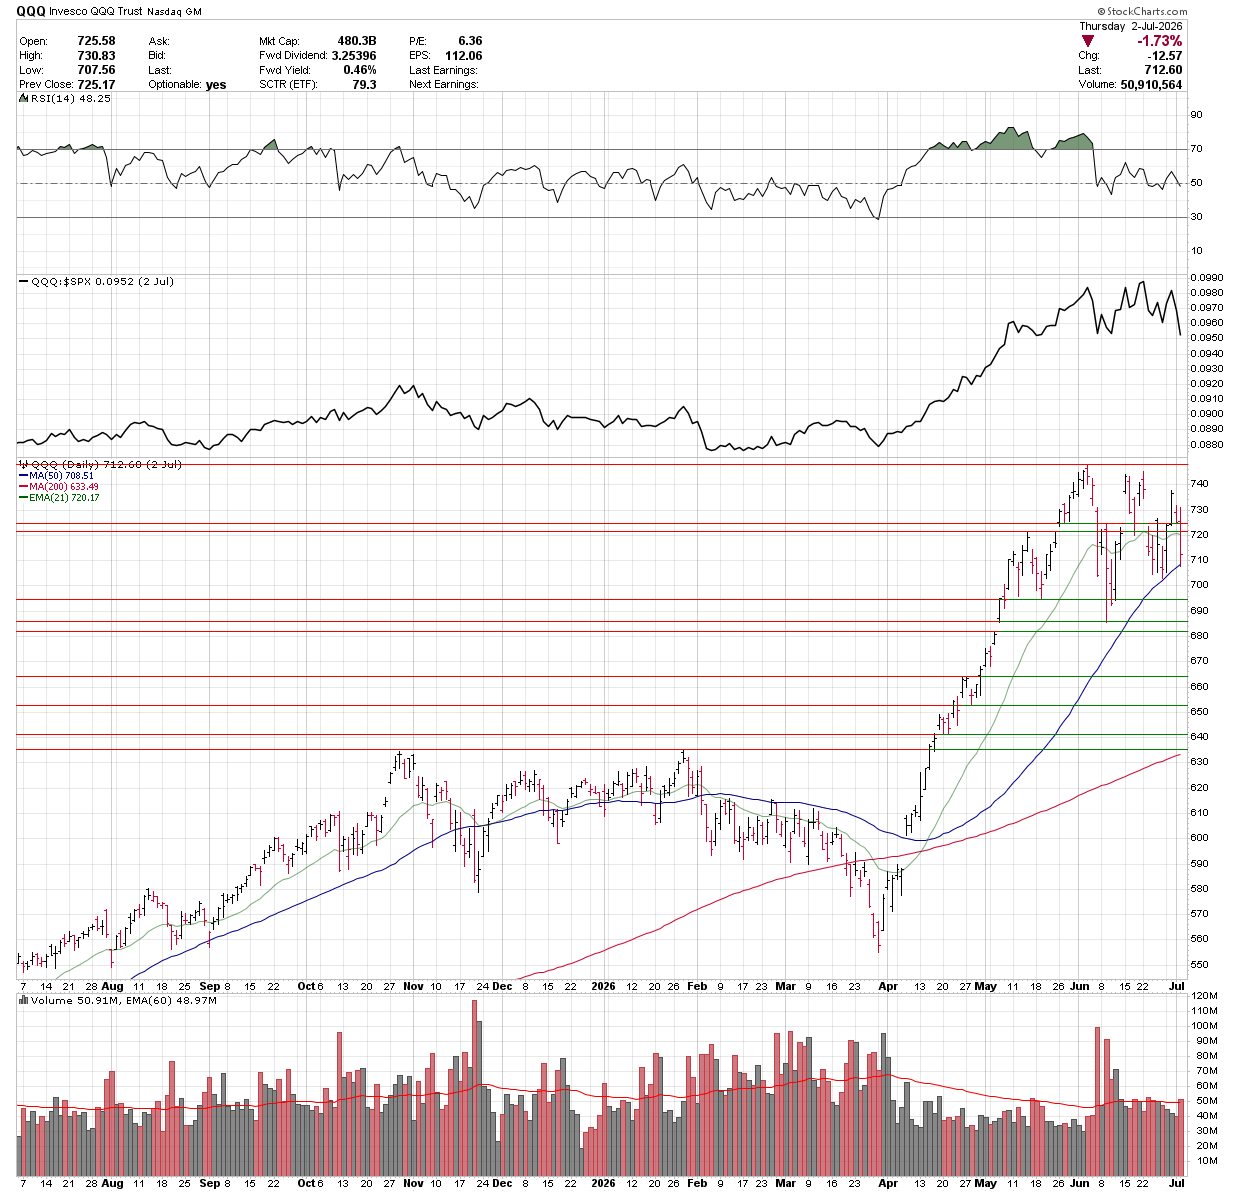
The QQQ Trust diverged from the broader market on Friday, falling 1.73% and finishing the week down 0.53% at $712.60. The pullback keeps QQQ in a choppy consolidation range after its sharp spring rally, with price still holding above the rising 50-day MA near $708.51, but struggling to regain momentum near the upper end of the recent range. Short-term resistance sits around $720–$730, with the prior highs closer to $740. A break below the 50-day would shift focus toward the $690–$700 support zone, while a reclaim of $730 would suggest buyers are stepping back into growth leadership. For now, QQQ remains constructive longer term, but its relative performance is starting to cool as money rotates into health care, financials, and the Dow.
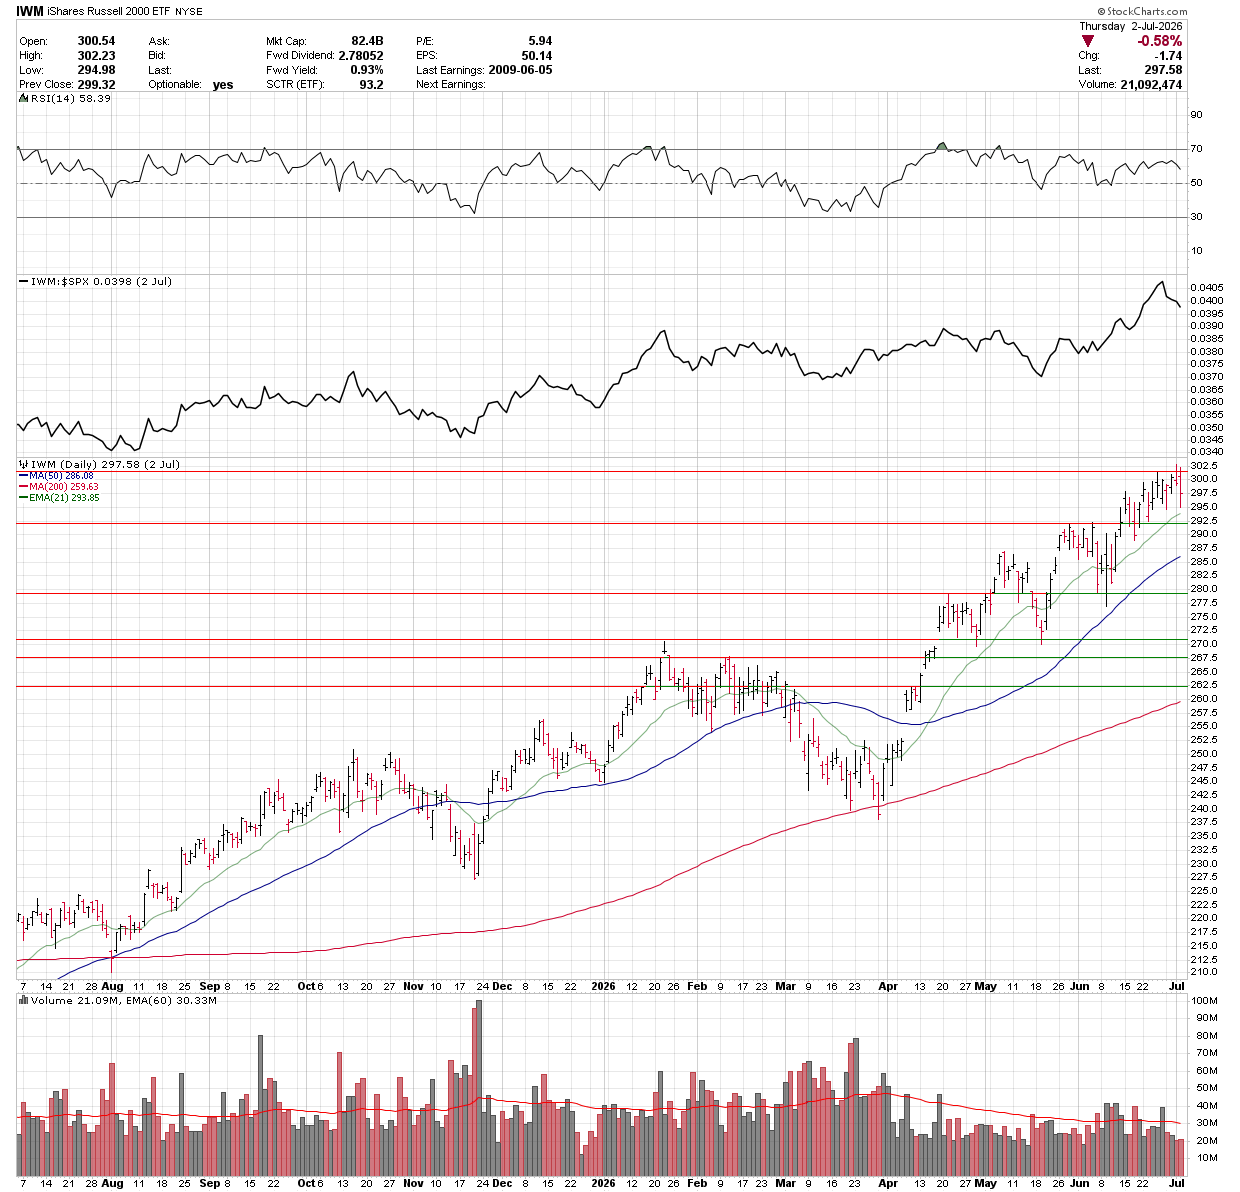
The Russell 2000 also lost momentum late in the week, with IWM falling 0.58% on Friday and finishing down 0.44% for the week at 297.58. The pullback came after a strong run toward the 300–302 resistance area, where buyers started to lose some control. Even with the weekly decline, the chart remains constructive as price is still above the rising 21-day EMA near 293.85 and well above the 50-day MA near 286.08. Near-term support sits around 293–294, with a more important level near 286–288 if the pullback deepens. The relative-strength line versus the S&P 500 remains elevated, so small caps are still holding leadership better than QQQ, but IWM likely needs a clean break above 300–302 to confirm the next leg higher.
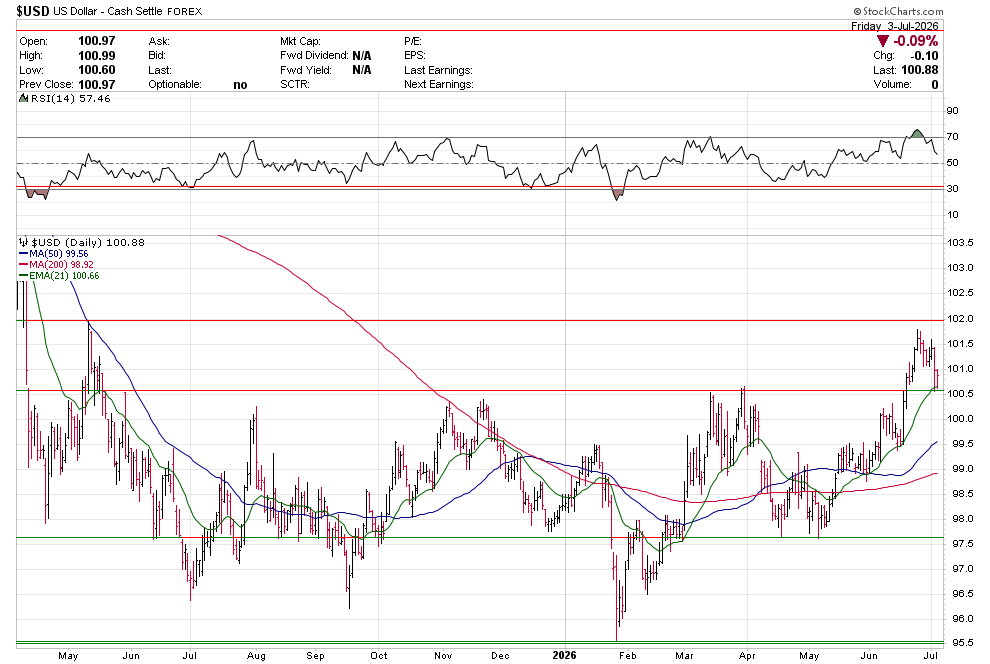
The U.S. Dollar Index fell 0.48% last week and is now testing an important support area near 100.50, after nearly reaching 102 less than two weeks ago. That level matters technically because it lines up closely with the rising 21-day EMA near 100.66, making this the first real test of the dollar’s recent breakout attempt. A hold above 100.50 would keep the short-term uptrend intact and could set up another push toward 101.50–102.00. But a decisive break below that area would weaken the setup and shift focus back toward the 50-day MA near 99.56, with the broader range still supported by the 200-day MA near 98.90. Momentum has cooled but remains constructive, so this looks more like a key retest than a confirmed reversal for now.
WTI crude continued to pull back last week, falling another 4.49% to close at $68.69, its lowest finish since early March. The move extends the sharp unwind from the spring spike, with crude now trading well below the 50-day MA near $90.16 and the 200-day MA near $73.94, leaving the chart technically damaged. The latest pressure came from a continued unwind of the Middle East risk premium as U.S.-Iran talks showed progress and traffic through the Strait of Hormuz began recovering, while OPEC+ also agreed to another August output increase of roughly 188,000 barrels per day. Short-term inventory data were not bearish, with U.S. crude and gasoline inventories drawing down, but the market is looking past that and focusing more on supply normalization, OPEC+ barrels returning, and softer global demand expectations. Near-term support sits around $65–$66, while the broken 200-day near $74 is now the first major resistance area.
Gold rose 2.37% last week to close at $4,122.76, but the bounce still leaves price below the declining 21-day EMA, which has capped rallies for roughly the last two months. Near-term, the key level is around $4,200. A clean breakout above that area would improve the technical setup and could open the door toward the $4,400 zone, where prior support and moving-average resistance come back into play. Until then, gold is stabilizing, but not yet confirming a trend reversal. RSI has improved from oversold levels, and MACD is trying to firm, but price still needs to reclaim short-term resistance before the chart shifts from a rebound to a real breakout attempt.
Silver rose 5.33% last week to close at $60.93, rebounding from a low of $56.65 after briefly testing the lower end of its recent range. The bounce carried price back toward the downsloping 21-day EMA near $64.01, while the 200-day SMA near $68.93 remains a larger overhead hurdle. The move helped stabilize short-term momentum, but the chart is still not cleanly bullish yet: silver remains below key moving averages, the relative-strength line versus the S&P 500 is still soft, and MACD remains negative. A sustained move back above the 21-day would improve the near-term setup, while failure there would keep the broader corrective trend in place.
Copper finished higher by 0.67% last week to close at $6.11, but the chart remains in a short-term consolidation phase. Price is still trading below its key short-term moving averages, with the 21-day EMA near $6.23 and the 50-day MA near $6.24, leaving the $6.20–$6.30 area as the first major resistance zone. At the same time, copper remains well above the 200-day SMA near $5.65, so the broader uptrend has not broken. The setup is mixed: near-term momentum has cooled, MACD remains slightly negative, and RSI is sitting in the mid-40s, but the longer-term trend still favors buyers as long as copper holds above the $5.90–$6.00 support zone. A reclaim of the short-term averages would improve the setup and put the prior highs back in play.
Bitcoin stabilized around the $60,000 area last week and has since rebounded to roughly $62,500, up about 5% from the recent lows. The move helped price reclaim the 21-day EMA near $62,367, which is the first short-term improvement after a prolonged decline. That said, the broader trend is still damaged, with Bitcoin trading well below the 50-day MA near $67,843 and the 200-day MA near $74,718. Near-term, holding above the 21-day EMA would keep the rebound attempt alive and could open the door toward $65,000–$68,000 resistance. A failure back below $60,000 would put the recent lows back in focus and suggest the bounce was only a short-covering move rather than a real trend shift.
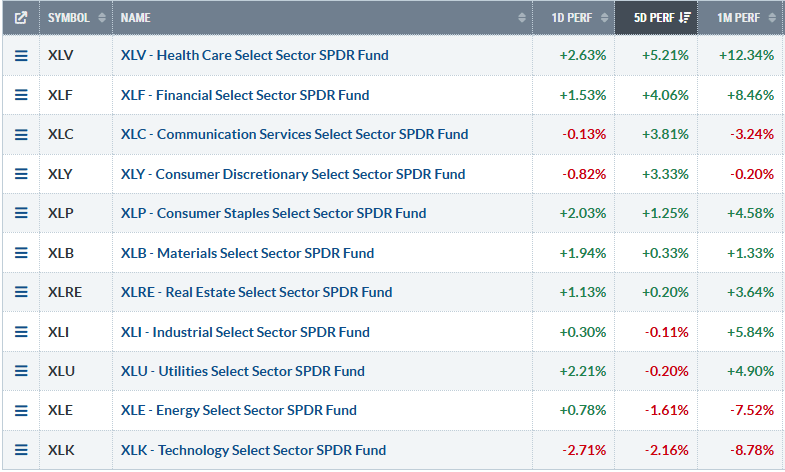
Health care and financials led the market over the last five sessions, with XLV up 5.21% and XLF up 4.06%, suggesting a rotation into more defensive and rate-sensitive leadership after the softer labor data. Communication services and consumer discretionary also bounced, but their one-month performance remains weak, showing the rally is not broad-based under the surface. Staples, materials, and real estate posted modest gains, while industrials, utilities, energy, and technology lagged. The biggest drag was tech, with XLK down 2.16% over five days and 8.78% over one month, signaling continued pressure on crowded growth leadership. Overall, the sector action points to a market rotating away from high-multiple tech and into health care, financials, and select defensive groups, while investors weigh a more cautious Fed path against slowing growth and sticky inflation.
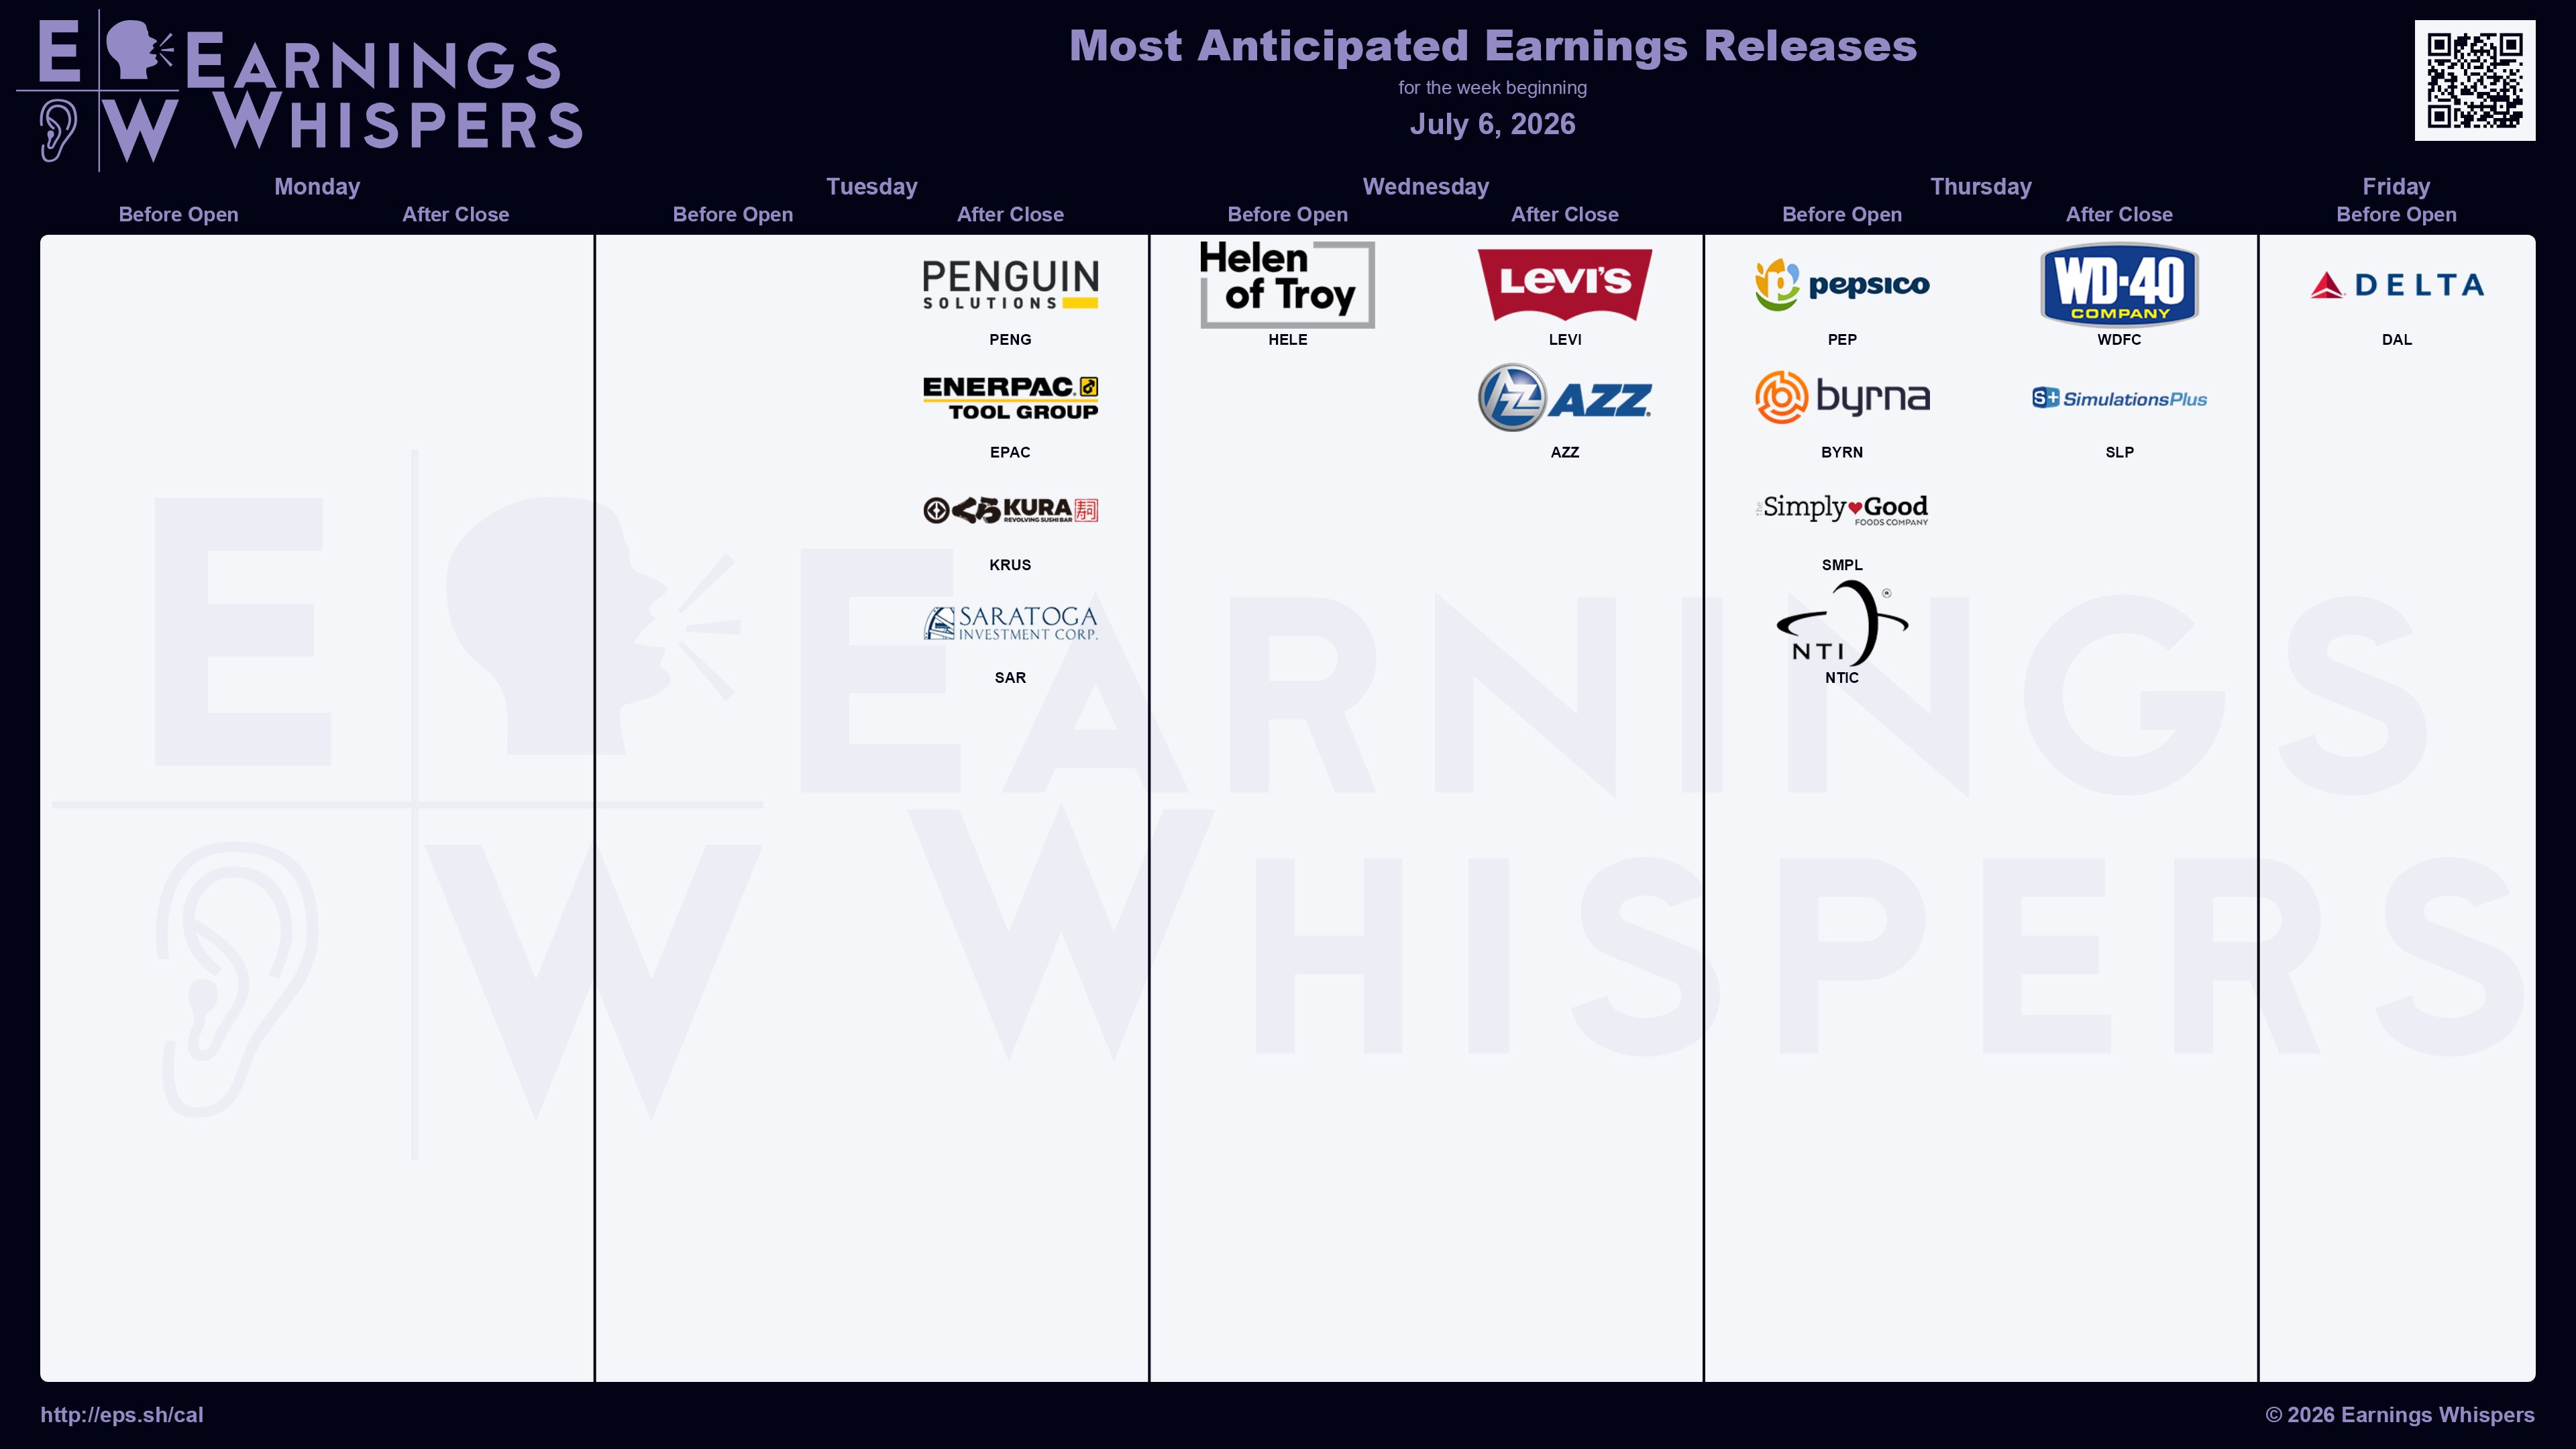
Earnings season is still in the warm-up phase, but this week offers a few early reads on the consumer, travel, and industrial economy. The biggest report is Delta Air Lines on Friday, which should give investors a cleaner look at travel demand, pricing power, fuel costs, and whether the consumer is still spending on services despite softer labor data. PepsiCo on Thursday will be another key consumer check, especially around volumes, pricing, and margin protection as shoppers push back against higher prices. Levi Strauss, Simply Good Foods, WD-40, and Helen of Troy add smaller but useful signals on discretionary demand, packaged goods, and household spending.
☀️ 09:45 S&P Global Services PMI (Jun) — Est 51.3 / Prior 51.3
☀️ 09:45 S&P Global Composite PMI (Jun) — Prior 52.2
🕓 10:00 ISM Non-Manufacturing PMI (Jun) — Est 54.2 / Prior 54.5
🕓 10:00 ISM Non-Manufacturing Prices (Jun) — Prior 71.3
🕓 10:00 ISM Non-Manufacturing Employment (Jun) — Prior 47.9
🕓 10:00 ISM Non-Manufacturing New Orders (Jun) — Prior 57.3
🕓 10:00 ISM Non-Manufacturing Business Activity (Jun) — Prior 57.7
🕓 10:00 CB Employment Trends Index (Jun) — Prior 107.01
🕓 11:00 Fed Waller Speaks
🕓 11:30 3-Month Bill Auction — Prior 3.740%
🕓 11:30 6-Month Bill Auction — Prior 3.840%
🕓 15:30 CFTC S&P 500 Spec Net Positions — Prior -35.4K
🕓 15:30 CFTC Nasdaq 100 Spec Net Positions — Prior -9.1K
🕓 15:30 CFTC Gold Spec Net Positions — Prior 181.3K
🕓 15:30 CFTC Crude Oil Spec Net Positions — Prior 114.6K
🕓 15:30 CFTC Copper Spec Net Positions — Prior 71.6K
🕓 15:30 CFTC Silver Spec Net Positions — Prior 23.8K
🕓 15:30 CFTC Natural Gas Spec Net Positions — Prior -176.7K
🕓 15:30 CFTC Wheat Spec Net Positions — Prior -48.4K
🕓 15:30 CFTC Corn Spec Net Positions — Prior 58.3K
🕓 15:30 CFTC Soybeans Spec Net Positions — Prior 100.8K
☀️ 08:15 ADP Employment Change Weekly — Prior 30.75K
☀️ 08:30 Trade Balance (May) — Est -78.50B / Prior -55.90B
☀️ 08:30 Exports (May) — Prior 327.10B
☀️ 08:30 Imports (May) — Prior 383.00B
☀️ 08:55 Redbook YoY — Prior 10.5%
🕓 10:00 IBD/TIPP Economic Optimism (Jul) — Est 45.0 / Prior 42.5
🕓 11:00 NY Fed 1-Year Consumer Inflation Expectations (Jun) — Prior 3.5%
🕓 11:30 Atlanta Fed GDPNow (Q2)
🕓 11:30 52-Week Bill Auction — Prior 3.750%
🕓 12:00 EIA Short-Term Energy Outlook
🕓 13:00 3-Year Note Auction — Prior 4.192%
🌙 16:30 API Weekly Crude Oil Stock — Prior -6.072M
☀️ 07:00 MBA 30-Year Mortgage Rate — Prior 6.57%
☀️ 07:00 MBA Mortgage Applications WoW — Prior 0.0%
☀️ 07:00 MBA Purchase Index — Prior 170.6
☀️ 07:00 Mortgage Market Index — Prior 272.2
☀️ 07:00 Mortgage Refinance Index — Prior 828.7
🕓 10:00 Wholesale Trade Sales MoM (May) — Prior 2.0%
🕓 10:00 Wholesale Inventories MoM (May) — Est 0.3% / Prior 0.3%
🕓 10:30 Crude Oil Inventories — Prior -3.775M
🕓 10:30 Cushing Crude Oil Inventories — Prior 0.709M
🕓 10:30 Gasoline Inventories — Prior -2.333M
🕓 10:30 EIA Weekly Distillates Stocks — Prior 2.483M
🕓 10:30 EIA Refinery Utilization WoW — Prior 0.5%
🕓 10:30 Crude Oil Imports — Prior 0.370M
🕓 10:30 Gasoline Production — Prior 0.481M
🕓 11:00 Thomson Reuters IPSOS PCSI (Jul) — Prior 49.14
🕓 11:30 Atlanta Fed GDPNow (Q2) — Est 1.2% / Prior 1.2%
🕓 13:00 10-Year Note Auction — Prior 4.538%
🕓 14:00 FOMC Meeting Minutes
🕓 15:00 Consumer Credit (May) — Est 17.60B / Prior 20.73B
☀️ 08:30 Initial Jobless Claims — Est 218K / Prior 215K
☀️ 08:30 Continuing Jobless Claims — Prior 1,814K
☀️ 08:30 Jobless Claims 4-Week Avg — Prior 222.00K
☀️ 09:00 Fed Williams Speaks
🕓 10:00 Existing Home Sales (Jun) — Est 4.20M / Prior 4.17M
🕓 10:00 Existing Home Sales MoM (Jun) — Prior 3.2%
🕓 10:30 Natural Gas Storage — Prior 87B
🕓 11:30 4-Week Bill Auction — Prior 3.605%
🕓 11:30 8-Week Bill Auction — Prior 3.650%
🕓 13:01 30-Year Bond Auction — Prior 5.050%
🕓 13:30 Fed Logan Speaks
☀️ 05:00 IEA Monthly Report
🕓 12:00 WASDE Report
🕓 13:00 Baker Hughes Oil Rig Count — Prior 445
🕓 13:00 Baker Hughes Total Rig Count — Prior 580
The market enters the new week with momentum still intact at the index level, but with leadership clearly shifting beneath the surface. The Dow and S&P 500 held up well, while QQQ and IWM faded late, tech lagged, and investors rotated toward health care, financials, and more defensive areas. The softer jobs report strengthened the case for a more cautious Fed path, but sticky ISM prices, firm energy data, and long-end Treasury pressure kept the macro picture from turning fully bullish. Commodities also reflected that split—crude continued to unwind as geopolitical risk premium faded, while gold, silver, and Bitcoin stabilized but still need follow-through to confirm stronger reversals.
This week’s calendar gives markets several key tests across growth, inflation, Fed policy, and Treasury demand. The main focus will be Monday’s ISM services report, especially prices, employment, and new orders, after last week’s payroll miss raised fresh questions about labor momentum. Fed speakers and the FOMC minutes will help shape the policy read, while the 3-year, 10-year, and 30-year auctions will test demand across the curve after the recent steepening bias. Energy also stays in focus with API and EIA inventories, the EIA outlook, the IEA report, and Baker Hughes rig data following large crude and gasoline draws. Thursday’s jobless claims will be the key labor follow-up, while existing home sales, consumer credit, mortgage data, and inflation expectations round out the week’s read on the consumer and rate-sensitive parts of the economy.
That’s all for this week’s report.
Eric
No posts
Comments
Nothing yet. Say the first thing.
Sign in to join the conversation.