


Dear Investors,
Ten charts have sat on my desk for a week, and I cannot get them to agree.
5 of them tell a story you already believe, and tell it beautifully. Earnings are exploding. Analysts are revising upward at a pace that essentially doesn’t happen. The Fed is being talked out of its own hiking cycle by two soft inflation prints. And the tape is riding an analog to 1998 with a precision that stopped being charming around the third time I checked it.
Stop after the fifth chart and you close this email reassured. You’d be entitled to.
The other 5 are the reason I am writing this at all.
Not because they contradict the first 5. That took me most of the week to see. They contradict nothing. They are the same market described at a different derivative, and put in order they assemble something I have seen exactly twice in my career: 1999, and 2007.
Both times the setup was legible months ahead. Both times almost nobody moved, because the surface data was excellent right up until the morning it wasn’t.
I will walk the first 5 in the open. But the part that changes what you own on Monday, rather than how you feel on Friday, sits in the second half of this letter: the number separating this cycle from 1999 and the exact moment it flips; the internal structure that says the top is later than the analog allows; the leverage ratio that has passed the dot-com peak; and the one asset that has already answered the question everyone else is still debating.
5 threads. 4 of them I’m dropping on purpose in the free half.
The S&P is up 56% from the April 2025 low. At the identical point of the 1998 cycle, it was up 59%.
16 months of two lines refusing to separate by more than a handful of points. Through the October chop. Through the February drawdown to +27%. Through the June breakout above +50%.
Read it forward and it stops being a parlour trick. From here the 1998 path added about 3 points, printed +59%, wandered 5 months between +39% and +58%, and then it broke. By the equivalent of July 2027 the same measure sat at +16%.
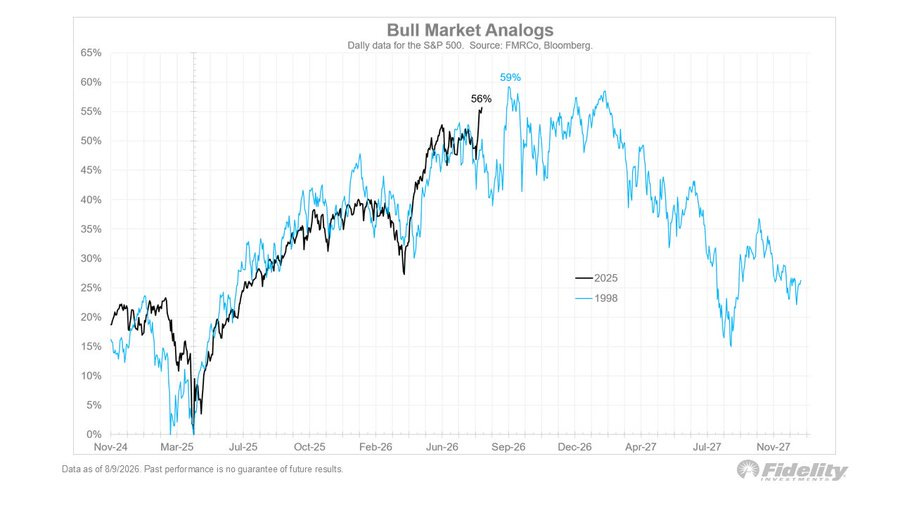
Go from 58% above the starting line to 16% above it and you have a 26.6% drawdown, delivered across roughly 7 months, with two thoroughly convincing failed rallies buried inside it.
People remember the crash and forget the payment schedule.
The S&P returned 26.7% in 1998 and 19.5% in 1999 before losing 10.1%, 13.0% and 23.4% - a 49.1% peak to trough decline. The Nasdaq returned 85.6% in 1999, then handed back 39.3%, 21.1% and 31.5%: a 78% round trip.
Bonds ran the film backwards. The Agg lost 0.82% in 1999 as the 10-year climbed from 4.16% to 6.79%, then returned 11.6%, 8.4% and 10.3%. And in currency, the euro launched at 1.1747 and traded 0.8230 by October 2000, down 30%, while USD/JPY collapsed from 147.6 to 111 in the LTCM unwind before grinding on to 101.5.
What stays with me is not the drawdown.
It is that stocks and bonds fell together in 1999, and then moved apart in 2000. The correlation changed sign around the top. That flip is the tell, and I come back to it after the paywall.
An analog is a shape. It tells you what rhymed, never what caused it. So I hold this one loosely until I can name the cause - and by the end of this letter, I think I can.
Normalize every secular cycle to 1.00 and a century fits on a single page.
The bulls finished at 4.60x over 9 years from 1920, 7.62x over 19 years from 1949, 17.44x over 22 years from 1978. The one we are living in sits at 10.51x after 17 years. The bears finished at 0.45x, 0.87x and 0.48x.
There is no terminal multiple. A 279% spread separates the smallest secular bull of the century from the largest, and matching 1978-2000 would require another +66% from here.
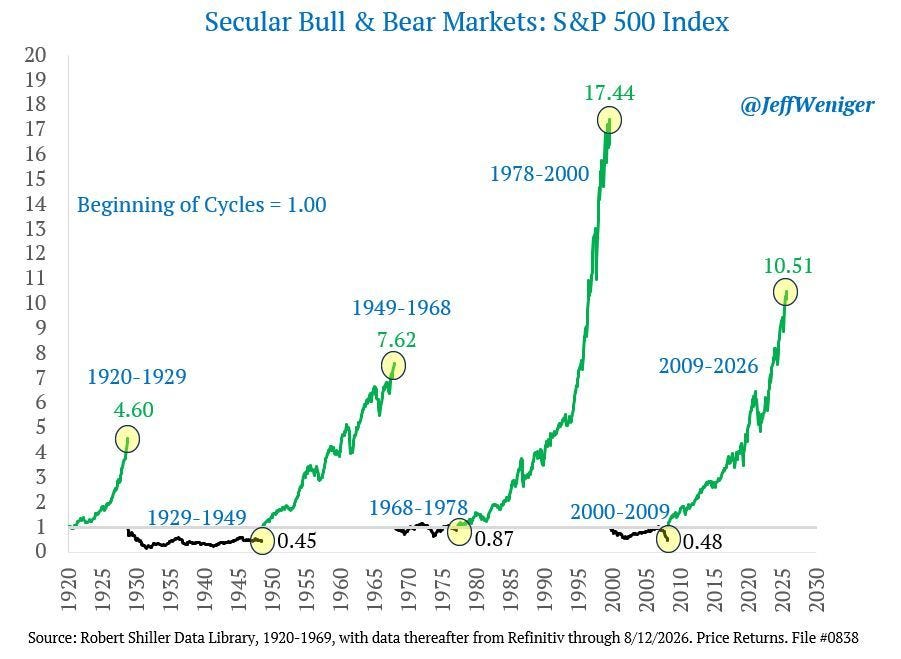
What is knowable is the cost of getting the era wrong, and it has never been a 20% correction.
Across 2000-2009 the S&P delivered roughly -0.95% annualized while the Agg returned around +6.3%. Bonds beat stocks by 7 points a year for 10 straight years.
The 1968-1978 stretch looks gentle at -13% in price, until you set cumulative CPI near +87% beside it and find a real loss around -53% - with long Treasuries destroyed alongside as the 10-year went 5.65% to 8.9%, and eventually 15.84% by 1981.
In both decades, what saved people was not a bond. It was a currency decision.
DXY fell from 120.9 in February 2002 to 71.3 in March 2008, -41%, while gold ran $256 to $1,011 and EAFE beat the S&P 6 years running. The rolling 3-year correlation between the dollar and gold sits near -0.7; between the dollar and non-US outperformance, near -0.6.
Hold those two numbers. They become the actionable part of this letter later.
Target rate 3.75%, effective rate 3.63%. Futures imply 3.879% at the December meeting - 0.992 hikes, just under one move by year-end.
The path then climbs to 4.018% by June 2027, about 39 basis points of tightening, and then turns around and gives it back: 3.893% by December 2027, with 41.8% already stripped off that meeting’s hike count.
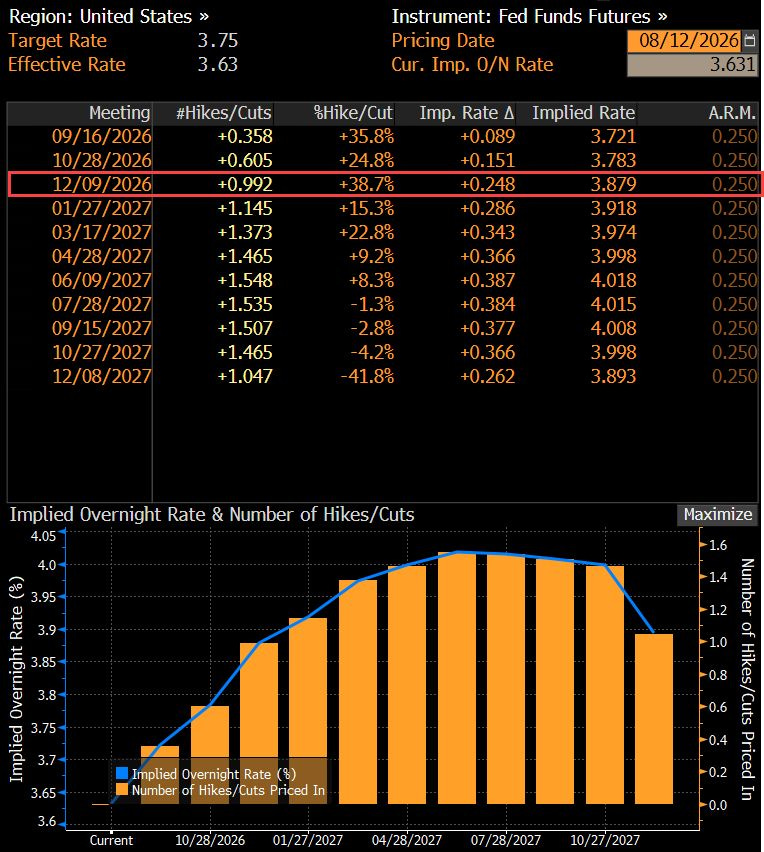
That is not a restrictive curve. It prices one hike, a top in mid-2027, and half of it undone inside 18 months. A policy path that expects to be wrong about itself.
I have seen the shape before.
In 2018 the Fed delivered 4 hikes to 2.25-2.50%, and the fourth quarter took the S&P down 19.8% peak to trough, 6.2% on the year. The 10-year peaked at 3.24% that November and was at 1.46% by August 2019. The Agg returned 0.01%, then 8.7%. Three cuts later the S&P returned +28.9%.
And USD/JPY went 114 to 104.8 in the January 2019 flash crash, with AUD/JPY down about 7% in minutes.
The terminal rate priced was never reached, and what ended the path was not inflation. It was leverage.
The first crack showed up in the yen rather than in equities - down 24% in the 1998 unwind, gapping in January 2019. Not a coincidence, and I show you why in the fifth thread, where the number we carry today is worse than either.
Cumulative federal interest costs through June of fiscal 2026 reached $827.6 billion, with every prior year sitting underneath.
The run rate is roughly $2.85 billion a day. Over $1 trillion a year. Around 14% of all federal spending. Debt has crossed $40 trillion, and the 30 year recently touched 5.27%, its highest since 2007.
The size was never the problem. The refinancing is.
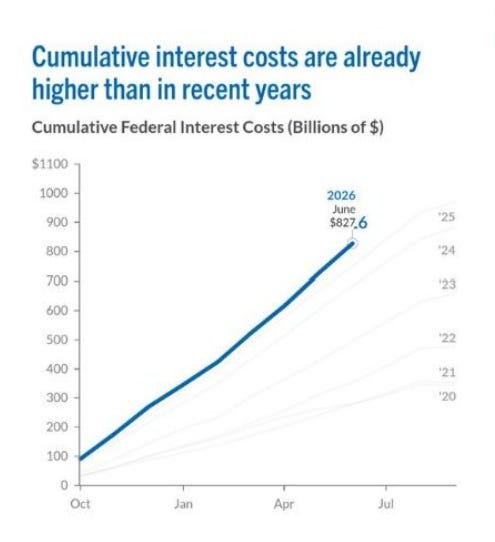
Much of that stock was issued when the front end was near zero and the long end near 2%. On $40 trillion, every 100 basis points on the average coupon is roughly $400 billion a year. About 1.3% of GDP. Permanently. Before a dollar of new spending is even argued about.
Higher rates produce higher interest costs, larger deficits, more issuance, higher rates. And the loop does not care who is in office.
We have a template for what that repricing costs, and it is only 4 years old.
In 2022 the 10-year real yield went from -1.0% to +1.7%, and the damage was correlated and total: the S&P -19.4%, the Nasdaq 100 -33%, the Agg -13.0% in its worst calendar year on record, a 60/40 book -17%.
And here is the detail everyone has already forgotten. S&P earnings actually grew that year. The entire decline was multiple compression, forward P/E from around 22.5 to 15.2.
In currency, the dollar gained 8.2%, the euro broke parity to 0.9536, USD/JPY reached 151.95. Term premium is a currency event before it is an equity event.
Gold sits near -0.8 to the 10-year real yield. Long-duration equities near -0.6. Bank equities run positive. Those 3 numbers decide who gets hurt here and who gets paid.
The average revision path since 2000 goes down: -2% by day 150, -9% by day 500. Analysts start optimistic and get marked down all the way to the print, and that base rate has held for a quarter of a century.
2026 broke it. After dipping to -3.7% the line turned and finished at +14.9%, roughly 24 points above the historical path.
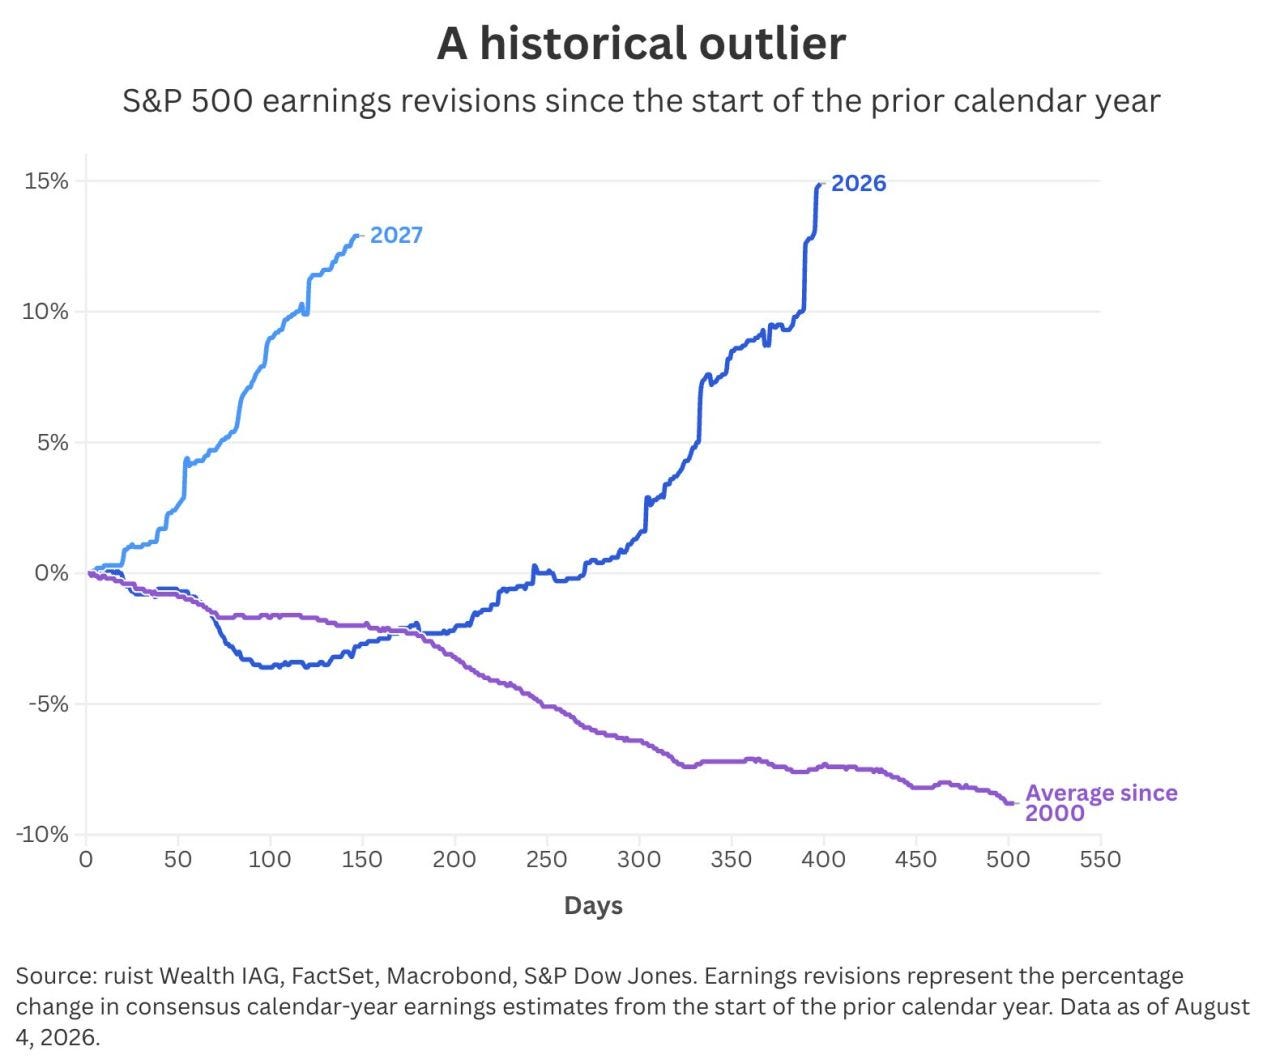
And 2027 is rarer still: +12.8% by day 150 against an average of -1.7%. A 14.5 point divergence at precisely the stage when estimates are almost always being cut.
The realized numbers earn it. With 88% reported, the S&P has posted +50.4% Y/Y earnings growth against an expectation of +23.1%. A 27.3 point beat, the second consecutive quarter above +25%, the seventh of double digits.
The last time growth ran this hot was Q2 2021, on more than $4 trillion of stimulus.
Which is exactly the problem. And it is where the free half of this letter ends.
Because Q2 2021 was the peak. Growth ran near +88%, the S&P still finished that year +26.9% - and then 2022 delivered -19.4%.
Nothing about 2021 was fake. It simply could not be lapped.
Same after Q1 2010: roughly +55% growth, followed by +12.8% in 2010 and 0.0% in 2011. The year of peak growth pays. The year after pays low single digits at best.
+50.4% cannot be lapped either. Markets don’t reprice on the level of growth, but on the change in its rate - and on current estimates, that turns within 2 to 3 quarters.
So, after 5 charts: the engine is real, it is decelerating, the analog is 3 points from where it topped, and the fiscal chart is quietly raising the discount rate underneath all of it.
What I haven’t told you is whether any of that matters this year.
The next 5 charts answer it, in a direction most readers will not expect.
One is the strongest argument against the 1999 comparison I have ever put in this letter, and it carries a precise trigger: two numbers that tell you the regime has changed the moment they swap signs.
Another shows the internals doing the exact opposite of 1999, buying this cycle more time than the analog allows and telling you what to own while it lasts. The third is a leverage reading past the dot-com peak that changes not whether the drawdown comes, but how fast it travels.
And the last is already trading, with an elasticity I can measure to the decimal.
PRO subscribers, log in below. The rest of this is where the letter earns its keep.
Two simple paths below - Yearly to begin, Lifetime to never look back.
[🎁 #7 BONUS if you become a PRO today]


Comments
Nothing yet. Say the first thing.
Sign in to join the conversation.