
“Now is the winter of our discontent / Made glorious summer by this sun of York.”
- Shakespeare, Richard III (Act I, Scene 1)
As humans we often think in seasons - the ones we experience from a climate and holiday perspective and the ones we experience as periods in our lives like middle age. If you love literature as I do, you may be familiar with the saying “the winter of discontent” or the novel written by John Steinbeck of a similar name. In the quote from Richard III, Richard, the young Duke of Gloucester, is professing his dissatisfaction with peace, preferring instead the chaos of war.
And all the clouds that lour’d upon our house
In the deep bosom of the ocean buried.
Now are our brows bound with victorious wreaths;
Our bruised arms hung up for monuments;
Our stern alarums changed to merry meetings,
Our dreadful marches to delightful measures.
Grim-visaged war hath smooth’d his wrinkled front;
Now that war has passed, he finds himself bored and vows to stir up chaos and “prove a villain.” Richard seems well-suited for our current season.
Tis not the season for declines in the stock market. For those that missed Friday’s action, the Nasdaq Composite declined by 1,121.53 points or -4.18%, led by losses in the below, pictured stocks.
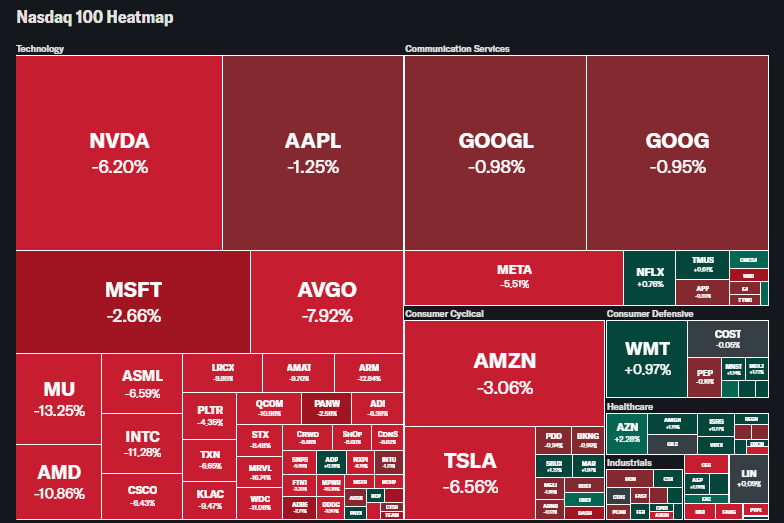
If you recall, Nvidia was on a relentless march last year - its stock price rising from $135.13 on May 30th to $157.99 by the end of June. At the time, it’s rise seemed to exemplify a seasonal frenzy in the markets which were “healing” from the Tariff Terror in April. For perspective, since 1971, the Nasdaq has only seen a negative YoY variance in June 11 times since 1971, one of which was June of 2022.
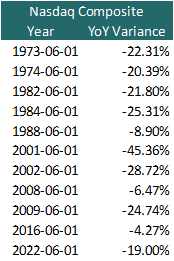
Source: FRED
Now, of course it is still very early in the month and the rollercoaster we have all been on is likely not going to end soon. However, the historical perspective and context is useful. Guess what hit an all-time high in June of 2022? Average gas prices. Per FRED, the highest average gas price we have seen since 1976 hit $5.058 in June of 2022.
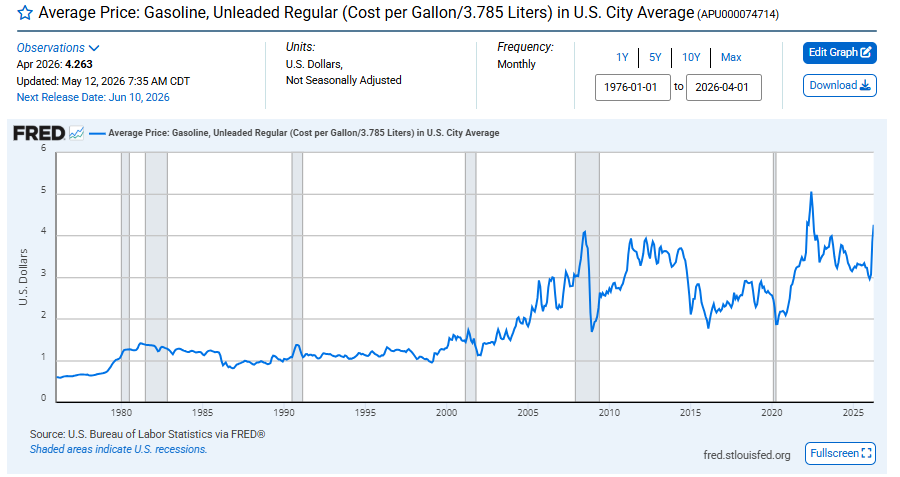
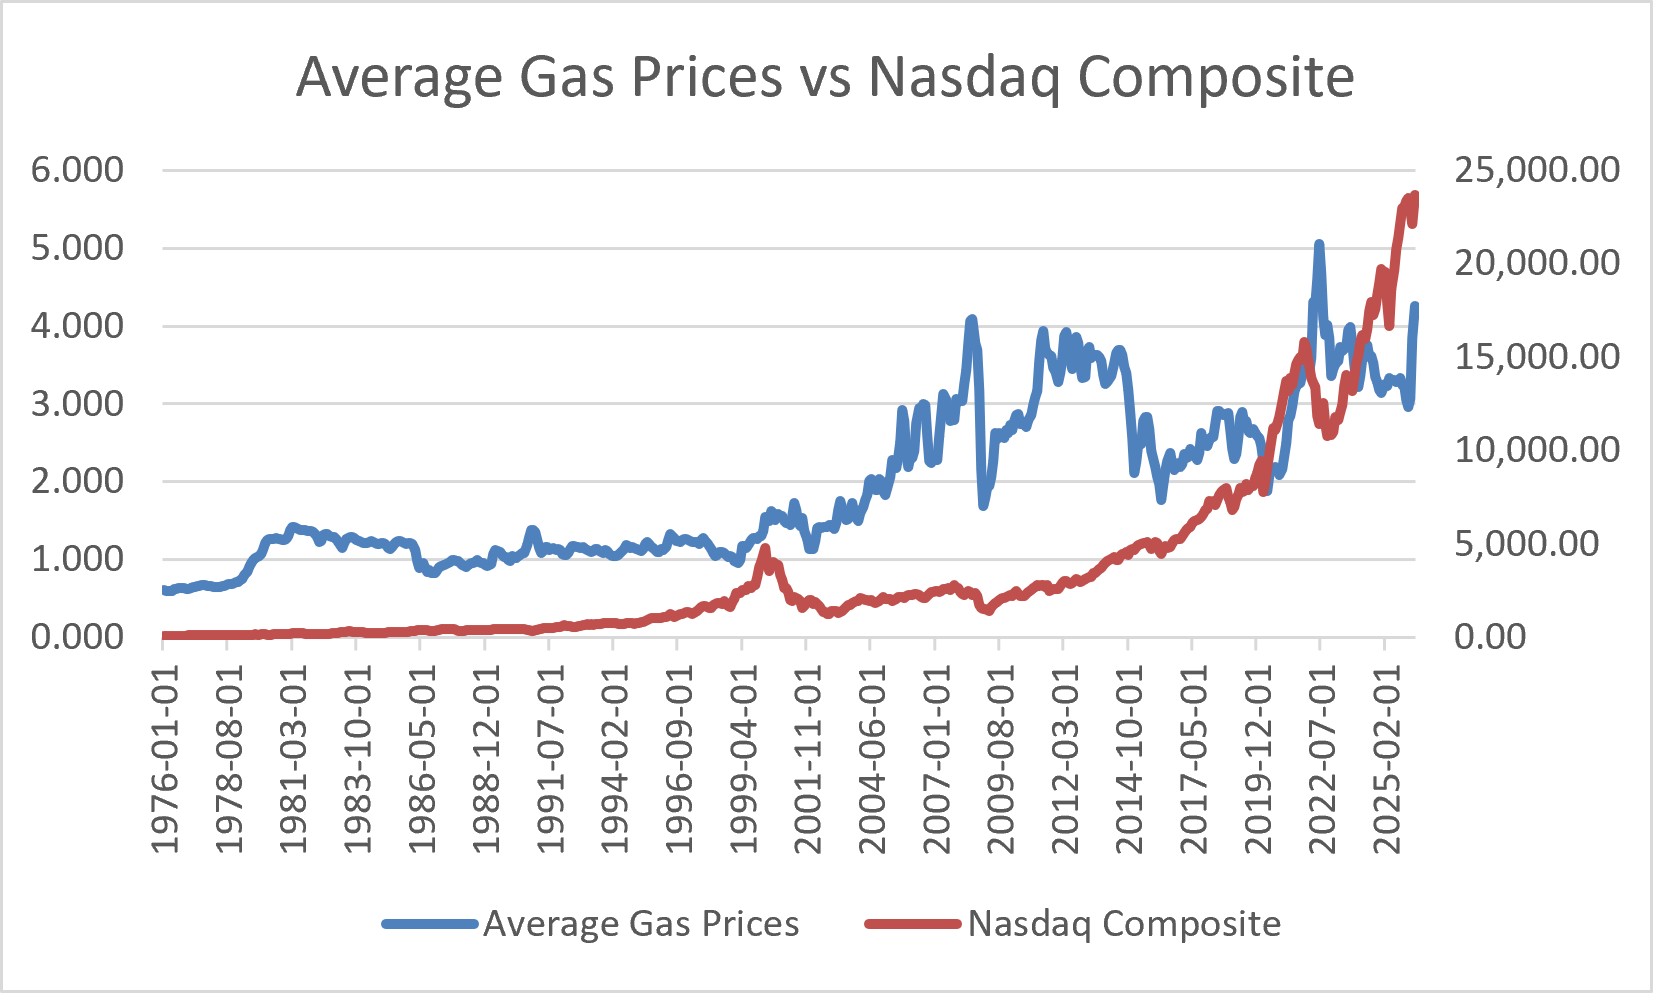
Source: FRED
Interesting, right? Just another data point, another view to consider.
The narrative machine on the other hand must be wicked tired from its recent, relentless efforts to provide an alternative perspective on AI; a perspective which many of us, including my pal Nobody Special, have been talking about for some time.
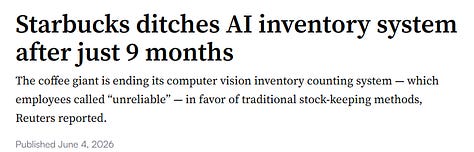
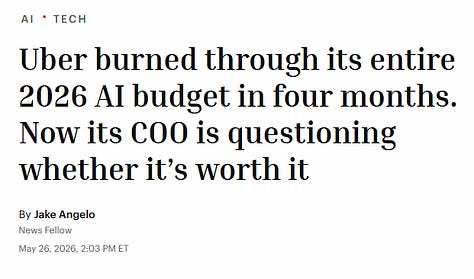


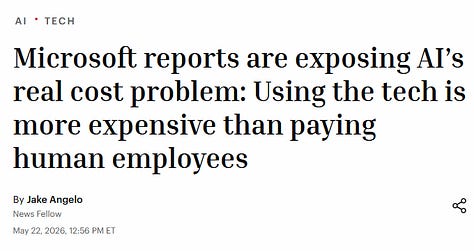

From Starbucks ditching its AI inventory system to Fortune’s article discussing how using AI is more expensive than humans, the narrative-busting articles are coming fast and furious. You may remember that I have discussed here several times that most of us in Fintech knew that the tech was more expensive than humans back in 2022. So why was that lesson forgotten even as the costs grew? There was just entirely too much money to be made.
Bonds joined the party with yields rising across the curve, forcing the 30-year mortgage rate to hit an ominous 6.66% at close on Friday. Bitcoin also sold off and has now lost all of its gains since Trump was elected. All in all, Friday was one heck of a session. The ironic thing? We received a “favorable” jobs report on Friday. For those who are avid market watchers this wouldn’t be that surprising due to how backwards things have been for years and years (better report=increased chances for rate hike, so lower stocks). For those who constantly tell me “the stock market is the economy, and we should all feel great” - well, it might(?) have been a bit of a shock. That jobs report on closer inspection of course was not all it was cracked up to be with the lion share of gains attributed to low-paying leisure and hospitality jobs likely related to cities hiring in anticipation of the FIFA World Cup starting next week.
So much of what has been holding up the housing market in terms of sales price has been narrative and risk asset hopium. If that confidence starts to crumble, then things could deteriorate much faster than anticipated. In looking at the city details for the 86 markets I track, the signs are clear that price drops are continuing to spread throughout the country. And, if you are not seeing outright price drops you are seeing lower sales and inventory increases signaling price drops are around the corner. Below I will share cities where we saw motivated, distressed and depressed selling in April as well as top five city summaries for sales, price, inventory and days on market. In those summaries I list the top and bottom five cities for each category. Preparing these summaries for both “all” of my cities and a subset which includes only the cities with populations over 500K, gives me a sense of shifts in trends. Which city blew the doors off the barn for sales and price increases? I will discuss and elaborate as to why that is not the great hope many see. Remember how I mentioned Boston in my last post? Things are getting spicy there, portending trouble for the Northeast. Additionally, Realtor.com just posted one of the funniest headlines of the cycle which I will review. And, finally, I include a recent piece on the madness in multifamily and the 2026 commercial real estate debt maturity wall. What I lay out in “Multifamily Madness” is yet another reason why the fall and winter seasons could be uglier than last year.
3, 2, 1…
Comments
Nothing yet. Say the first thing.
Sign in to join the conversation.