
The data below paints a stark picture of the current Canadian landscape, a story of domestic economic stagnation contrasted against a surprising silver lining for Canadian investors.
Every month, we are breaking down charts & data from our newest Chartpack, something we spend many hours on and are constantly updating.
Now available for free to all Loonie Hour subscribers.
Go Deeper: Download The 2026 Chartpack

DownloadCanada’s Meagre Growth Expectation
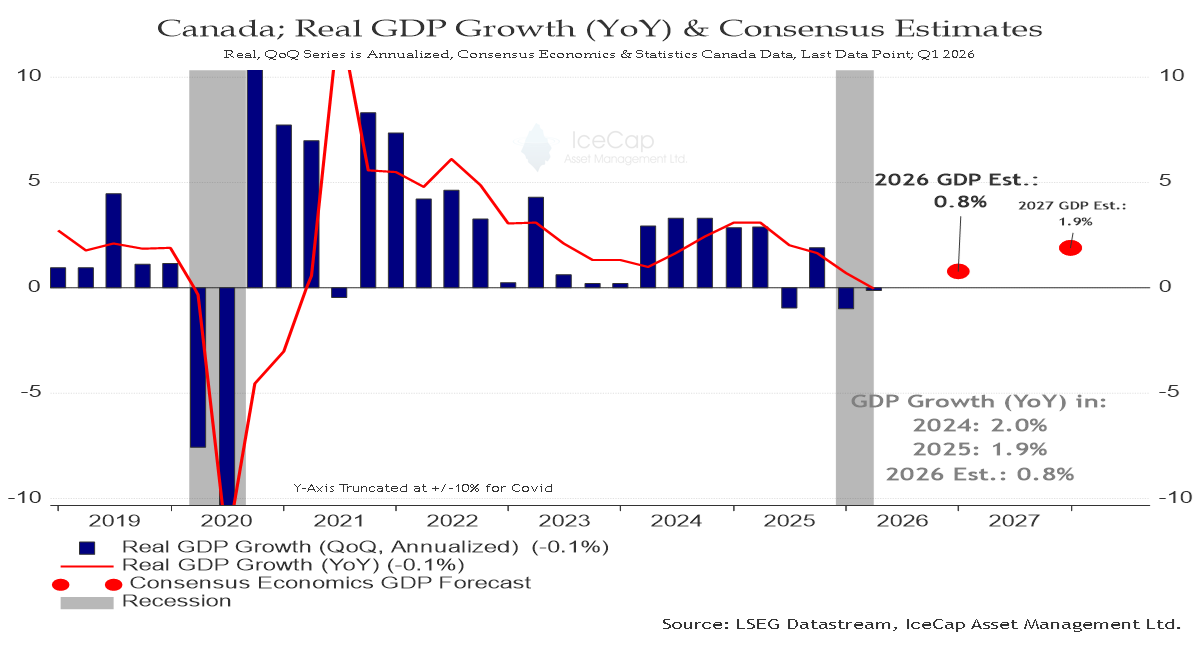
After a brief post-COVID rebound, Canada’s real GDP growth has been decelerating steadily — and the consensus forecast for 2026 is a mere 0.8%, less than half the already uninspiring 1.9% recorded in 2025. This is due to a dramatic change in immigration policy that has led to negative population growth, paired with poor productivity growth.
What makes this more troubling is that even this modest forecast may prove optimistic. The full weight of CUSMA uncertainty, tightening financial conditions, and a weakening housing market had been priced in. The 2027 consensus of 1.9% assumes a meaningful recovery that, on current evidence, has no obvious catalyst
Canada’s Generational Stagnation
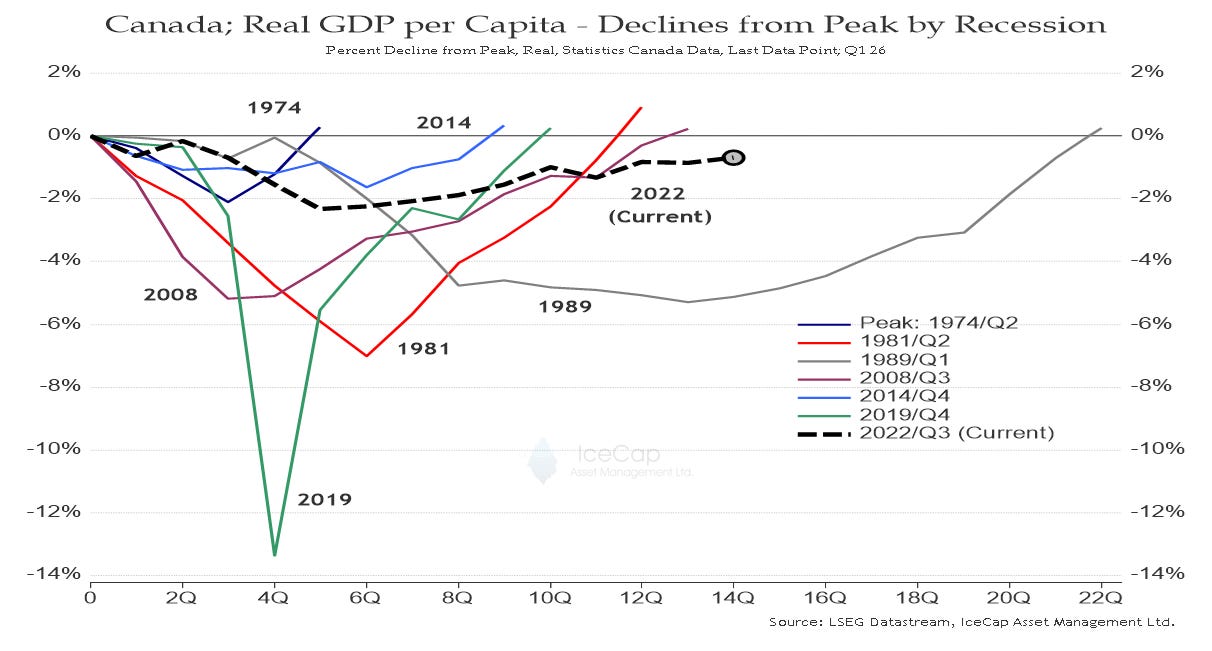
Canada is not in recession. It is doing something arguably worse — it is drifting. The current decline, which began in 2022, has now spanned 14 quarters without returning to its prior peak. That makes this the longest per-capita stagnation since the grinding aftermath of the 1989 recession — a downturn that took nearly 22 quarters to fully resolve.
What distinguishes this episode from those that preceded it is the absence of a cyclical catalyst for recovery. The recessions of 1981, 2008, and 2019 were sharp and externally driven — painful, but followed by genuine rebounds. Canada’s current malaise is both self-inflicted and structural. Weak productivity, collapsed private investment, and a decade of poor policy choices don’t reverse themselves when interest rates fall or commodity prices rise.
That is what makes the road back so difficult. The recovery, when it comes, is likely to be muted — and a long time coming.
Canadian Stocks Rise & Fall With Commodities
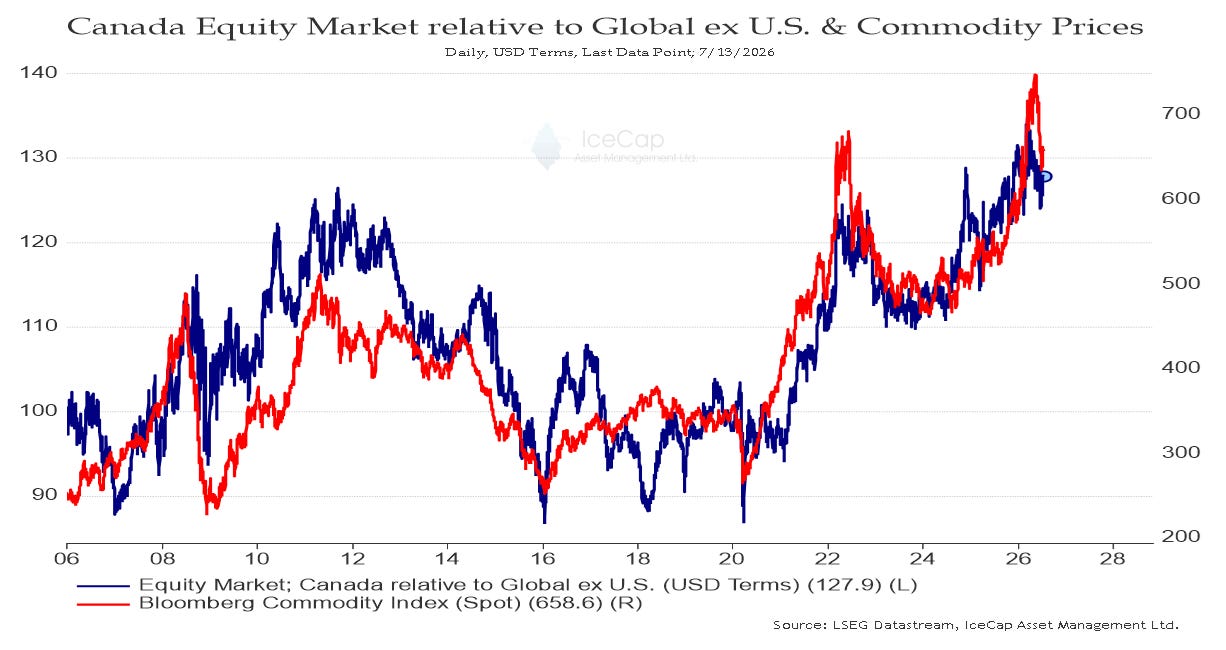
In contrast to Canada’s weak economy, the Canadian equity market has outperformed global equities — excluding the U.S. This is due to a large weight in resource-related companies (35%) and other sectors, such as banks, that stand to benefit from a resource boom. As the chart makes clear, Canadian equity market relative performance tracks commodity prices with remarkable consistency, a relationship that has held across two decades and multiple cycles. The implication for investors is straightforward. As long as the commodity cycle remains constructive, Canadian equities offer an attractive combination of resource exposure, reasonable valuations, and a currency that moves with the cycle.
The relationship between commodities and equities is just one piece of the puzzle in this drifting economy.
Have your own look at the data & charts within the Chartpack, and subscribe for our regular articles weekly.
No posts
Comments
Nothing yet. Say the first thing.
Sign in to join the conversation.