
No, “planning” a tree is not a typo, just a pun. Something I like to think is called ‘wit’, but might just be a ‘face-palm’, or a ‘dad joke’ instead. Your call.
The thing is, when I started fleshing out my ideas for Links, it quickly became clear that what I was imagining couldn’t possibly be accomplished by one person, not in a hundred years. The breadth of expertise required would be too varied, the scale of the project too huge, to even consider it. It would likely take a large team of professionals a decade to bring them to life, well and truly, plus years of preparation to even get to that point. Like, you know, going to school for it, planning it out, doing the research to lay the groundwork, etc.
So, I began looking at this project with that kind of time scale in mind - planning it for twenty years or so ahead. Accepting this made my job seem both significantly easier, and harder. Easier, because now I get to specialize - get really good at one little part of it. Harder, because instead of simply being a programmer or a researcher, I would need to set a course to eventually become the leader of a team, the architect of a large project.
And my little part of this grand whole? The tree. That stunning file system visualization in my head. The Filing Tree. (As in, ‘filing cabinet’, not ‘filling you with lasagna’. One lonely ‘L’.) Wait, aren’t I supposed to be the leader of this software revolution? Well, yeah, maybe in a dozen years—but see, every project needs a face, an attention-getter, something to kickstart it and develop interest. Something to draw funding. The Filing Tree, the idea that started it all, is that key part for Links.
And, this is something I feel like I can actually do, a part of it I understand top to bottom, instead of just architecturally.
TODO: how all of my gifts and talents seem perfectly suited, and no extra - both for this part, and for planning and leading the rest.
You’ll hear more about the rest of the ideas in Links later, as well as future plans and details for the Filing Tree, but in this post I’ll explain my process of discovery, figuring out how to build the Filing Tree, as well as portray at least the basic concepts of how it functions.
First, some housekeeping. This is my first DevLog post, and while this one may be a little more user-friendly, you can expect these devlogs to generally get kinda gnarly. I won’t spare you from the algorithms, nor the debugging, nor the math. I will try to thoroughly geek-out, and drive away any sane readers. Or, you know, drive you to insanity. But, I’ll still try to make it a tad entertaining (even though entertaining isn’t my intended purpose, and debugging is innately boring), so the more technically-skittish of you can still lurk around if you want and read the bits that don’t hurt your eyes or your brain, and hopefully get something neat out of it.
Also, they WON’T all be this long - but I felt I needed to tell the story, the process, of how the idea for GridTrees came to be.
For the time being, I’ll be catching up to myself - I’ve got about six more devlogs planned for events that have already occurred. When I do finally catch up, they might still lag a bit behind, depending on whether the material involved is sensitive to prepublication, since I am publishing my academic research along the way in scientific journals and conferences. (I’ll post relevant links when I do, for the more daring or professionally interested readers.)
As for anyone actually academically interested in my research, feel free to contact me. I want this work to progress, and I’ll be looking more and more for collaboration as time goes on.
Whew! No more housekeeping.
What I saw in my head, what I was imagining, I had to find a way to make it real. I believed there was a way, but had no idea, at the beginning, how to go about it. Remember, this time period was during my undergraduate degree, and was mostly before the rest of the ideas for Links came together, but definitely as they were building up. There wasn’t so much of a big picture at the start, no clear idea of the major pieces, just tidbits of cool interfaces and things I would change about computer operating systems if I made my own. Much of my thought was devoted to the tree, how one would interface with it, what it should look and feel like - and, of course, how to build it. “Planning a tree”, you might say - one I knew wouldn’t be ready to fully bear fruit for another twenty-or-so years.
At first, I didn’t really know how to sketch what was in my head - it was still vague. Still, I began attempting to do so, amid other OS interface ideas. Sometimes just a tree, sometimes trees worked into larger interfaces.
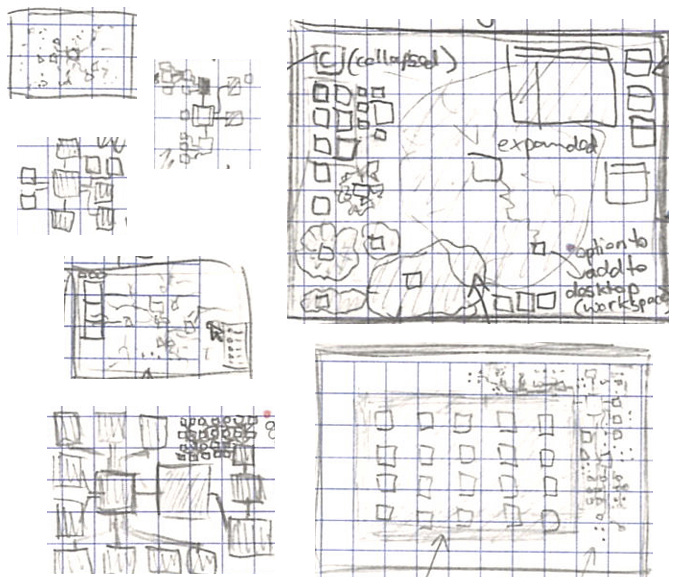

Eventually, the picture came a little clearer - though still different than I first imagined (Curiously, the current status of the tree actually looks closer to what I first imagined than these sketches do, I think):
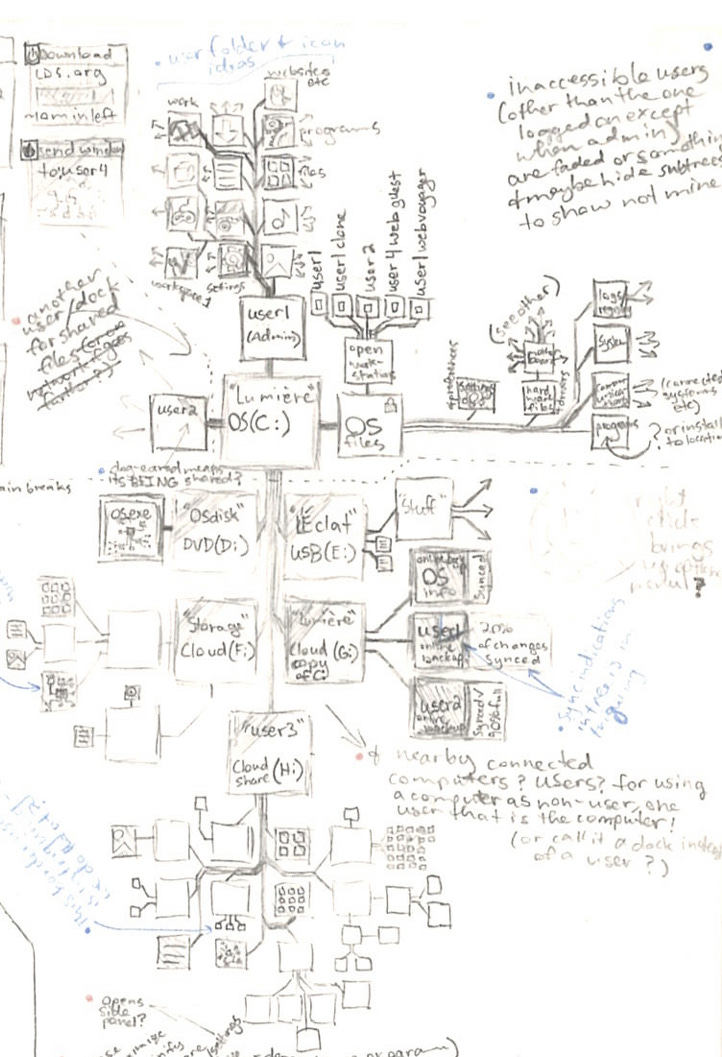
But, how could I build it?
The question eluded me, and I began diving deep. I began researching existing algorithms and visualizations, what was possible and how those worked. What was known, and what wasn’t. I began learning how tree-drawing algorithms were designed, and picking apart their algorithmic complexity, and whether they would work for what I wanted. This research was on my own, outside of the research lab I was involved with around this time (Dr. David Wingate’s Perception Control & Cognition Lab at Brigham Young University, then later, Dr. Nancy Fulda’s DRAGN Lab). Realistically, I’m not entirely sure when this research occurred, or which parts were this early on, but you get the idea.
Here’s a few things I learned; skip them if you’re not interested in other visualizations, and how they compare. They’re in block-quote format to make them easier for you to digest, or avoid.
Treemaps
I learned about Treemaps - a brilliant algorithm, and a design which has already become quite well-known and commonly used in data science. A Treemap subdivides an area in a hierarchy of subregions, usually color-coding them either based on the branch of the hierarchy, or based on some other statistic. The sizes of the subdivisions were themselves representative of the sizes of the files (or another metric, in visualizing other types of data). Some relevant points I will note:
Every region’s size and shape was dependent upon those around it - which means if you change one thing, in most implementations you have to change them all. This is prohibitive in large trees, though some implementations can get around this by creating local, zoomed-in renderings.
The hierarchy is muddy - as in, it’s confusing to look at. While many, more recent implementations attempt to resolve these issues by making region containment more clear, most algorithms often leave you wondering which things are inside of which other things.
Their layout is relatively unstable to changes (some treemap algorithms address this somewhat, others do not).
They are, however, excellent for getting a big-picture view of where the space on your hard drive has gone, as evidenced by tools (which I use, myself) such as QDirStat (for Linux) and its derivatives and look-alikes, like WinDirStat (for Windows) and TreeSizeFree (an app for Windows). Highly convenient tools.
The algorithm is fairly simple and fast, once you’ve got the sizes or other metadata pre-loaded - so much so that many researchers and coders alike have re-implemented the algorithm for widely varying use cases.
FSN, FSV
I also learned about FSN (File System Navigator) and FSV (File System Visualizer), surprisingly old attempts at visualizing real file systems. FSN was even featured in Jurassic Park, as one of the cool nerdy things people think goes on in fancy computer systems. It thus was granted exposure to a surprisingly broad audience - but, sadly, even this was not enough to spur widespread adoption, though I’m sure it encouraged related development. These visualizations, too, then, must have been lacking something vital for consumers. As far as I’m able to observe, they seem to have:
Really cool, at least for the time period. The interface could be drastically improved and cleaned up with modern software design methods, and you might actually have a decent tool. As is, though…
Slow and clunky controls
Limited view; other areas are present in the big picture, but don’t feel particularly substantive in FSN, though FSV does better.
Non-memorable shapes and locality (reducing the effectiveness of user memory as an aide to navigation)
GosperMaps
I learned about GosperMaps, a beautifully mathematical map-like construction giving trees a clear spatial locality. They are built on a discrete, hexagonal grid - however, they are built from the bottom up, and at least under their current design, a single change would require large scale recomputation on O(n), not just the regions hierarchically higher up the tree. I would say of GosperMaps, that:
They’re beautiful, with memorable shapes and locality. They feel truly navigable.
The hierarchy is a tad muddy; it takes a bit of extra visual effort to discern branch containment.
If I’ve understood their approach correctly, they’re intractable for dynamically updating trees.
Layout stability I am uncertain about.
Treevis.net
Finally, I found treevis.net, a wonderful treasure trove of research, old and current, on tree-drawing methods, where I learned about sunburst layouts, bubble treemaps, cascading treemaps, fractal trees, street layouts, icicle plots, various force-directed approaches, gyro- and other hyperbolic layouts, map-like layouts, box-drawing, various grid-based layouts…. and all the gathered research on literally hundreds of types of hierarchical visualizations!
You would think finding this would have discouraged me - “there are so many, and none of them have taken off in file browsing?” Or, “there are so many, this field has been overworked, with nothing truly new for a long time! It would be foolish to try to start in on this field of research.” Or, “there are so many, somebody must have already done what I’ve been thinking.” But no, quite the opposite. By the time I found this, I might have already had an inkling of how to approach my design, and I could see that the lines I was thinking along were different, unique. I could also see what many of these methods lacked, in terms of characteristics necessary for file browsing in a consumer market. I could even see what modern visualization research looked like, and where it was going on. I could see that I actually had something new, and it would eventually fit right in as real, academic, worthwhile research. I had a chance.
Explorer-like
Oh, and just so we’re all on the same page, I’ll give my
causticblunt analysis of our current file browsing tools, too, such as Windows Explorer, Mac Finder, Nautilus in Ubuntu, etc.:
Single layer (usually - Mac Finder is an exception, but only shows where you’ve been)
Virtually impossible to relate anything to a memorable locality (except on your desktop), as everything moves around when you resize a window (spatial memory support is minimal, limited to some linear sorting order), and shapes and colors are limited to individual files (no visual memory support)
Other parts of the hierarchy are entirely hidden, except the direct folder path
They are simple and fairly intuitive to understand, and easy to use.
Computationally fast and efficient (only the current branch of the file system needs queried)
Visually neat and tidy, with little to no visual clutter (low cognitive load)
But… boring, and navigationally challenged; manual navigation (non-automated search) is limited to visually searching the immediate branch for a specific name or icon (with non-unique icons, names take more mental effort to parse than shapes)
It has actually been adopted - widely. Like, it’s the only real option in consumer file browsing. So, grudgingly, it must have been successful for some reason - and I suspect it is because it is so simple that people like it - subconsciously.
You see, even though we think we want a cooler tool, it often ends up being more of a cognitive load than we want when using it as a simple means to an end for other tasks than exploring. Ain’t that the kicker? A successful interface or tool needs to be subconsciously easy and preferred, not just consciously! While I’m not sure if I can beat that, I might just be able to make the Filing Tree simple enough to be close, and useful enough to make up the difference. Fingers crossed.
None of what I found worked for my purpose. Even with the vast range of research on treevis.net, I could see that what I wanted didn’t yet exist. Not only did each method I examined not look and feel right, but most of them either wouldn’t be feasible as a live file browser, or wouldn’t support user memory because it lacked a stable layout, or simply wouldn’t be accepted by common users because it wasn’t simple enough, or one of a number of other reasons I identified later.
So, armed now with all of this new information, and many thoughts about how such algorithms work, the gears began to turn in my own head on how I could build something that both looked like I was imagining, and was efficient enough to work as a simple background program, rather than devouring extensive resources at every update, as many of the aforementioned methods might (Nom nom nom…).
In computer science lingo, I needed something with access complexity in O(log(n)), insert and delete complexity in O(log(n)), total memory requirements in O(n), and render complexity limited to, at most, O(v log(n)), if v is the number of items in view.
“Wait, hang on Nathan, you’ve been calling this thing the Filing Tree, but you went and titled this post something about ‘GridTrees’ - have you lost it?”
Just a little.
Though I didn’t come up with the name until later, GridTree is what I’ve titled the data structure, the brilliant thing behind the scenes that will make the Filing Tree program work. The two are well and truly different, similar to the way NTFS is different from Windows Explorer, a Treemap is different from QDirStat, and macaroni is different from Macaroni au Gratin. One is an ingredient, the other an experience! Other programs could also use GridTrees in their visualizations, and they might not even be used for file systems, but other types of hierarchical data instead (e.g. phylogenetic trees in biology, library catalogs, or regions of the night sky. I’m not too concerned about there being use cases - Data scientists are creative people, and businesses tend to ooze massive data sets like… ahem. Anyway, you get the picture.)
So, with that in mind, since the GridTree is really the keystone here, we won’t be much concerned with developing a true Filing Tree program for a while, other than my sketchy prototype for rendering and exploring GridTrees. Eventually we’ll discuss what the Filing Tree will look like, and how it will tie into other parts of the Links system, but for now, let’s get a little more technical.
Please wait, while I upload you into the Grid.
I kept dreaming of a world I thought I’d never see. And then one day… I got in.
— Kevin Flynn, Tron
(Actually, the visual is vaguely reminiscent of the Grid in Tron - the idea of your files having a location, a spatial representation, has been around a loooong time!)
(The rest of this article is finally the part which most resembles a normal devlog.)
Long before finishing all that research up above, I started thinking about various possible algorithms for tree layouts.
One of the first approaches essentially was to take a Treemap-type subdivision of the drawing area and draw nodes in them instead of filling them, then drawing the links, or ‘edges’ (graph theory term) or ‘traces’ (my term in this scenario, since they are reminiscent of traces on a circuit board) mostly on boundaries between rectangles. I figured this would give me something like this (the one on the right being an example including non-rectangular subdivisions as well):
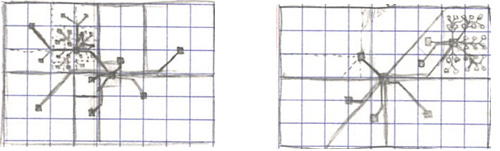
But, such an algorithm would suffer from the same O(n) layout and update problems as would a Treemap, even though it is more easily interpretable. That is, that you’d have to descend the entire hierarchy to compute the size of a higher branch, or store them - but then you might thrash higher branches with constant changes as any one of their many descendants experiences any kind of change.
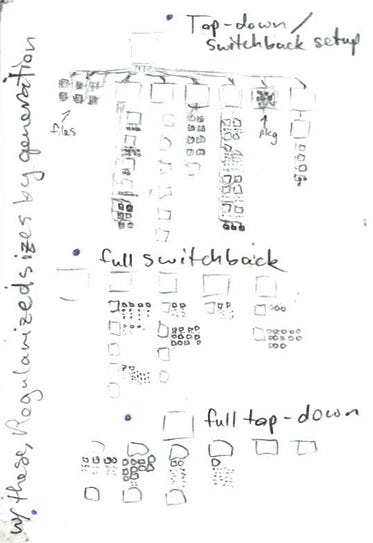
I briefly played with the idea a more regular approach, but it felt like it was lacking something, for sure:
Many thoughts passed through my head as well that I can no longer even clearly identify, but which still helped me along the right path:
The timing on all of the above is fuzzy, but likely was around 2016-2018. By this point, which was around halfway through my undergraduate, I had gained more experience, and the tree had had more time to germinate. Now I began examining potential algorithms in earnest, with great attention to detail.
I still loved the idea of dividing the drawing space in such a way as to be able to see at a glance a big-picture view of either the file sizes, or a representation of how many files were down there. These both have the same problem, though, of having to sum up and constantly update numbers built upon all of the tens to hundreds of thousands of lower branches. If I could somehow create a hybrid, which only approximated this information, it would be sufficient.
Likewise, I appreciated the force-directed methods I’d seen. These are methods which use pseudo-physics to “push” branches apart. Such methods - those which work with an entire tree simultaneously - become very slow for large trees, and wholly intractable for real-time renderings of trees the size of a file system. Nevertheless, I played with some force-directed concepts myself, in hopes that I could produce some sort of hybrid, one which only searched so deep, or one which changed only areas which pass some sort of pressure threshold, and then only briefly. I was intent on finding a way to do something like this, because I knew the layout had to be stable, and pushing apart branches would accomplish this.
During one camping trip with my family around this time, I had plenty of time to ponder on this problem. I remember looking up at the stars in the night sky, and feeling that sense of wonder they bring me every time - even in the midst of the busy-ness of life, and feeling worn out from school and other things. It must have been here that some of the pieces began to come together. I realized that I could get around the O(n) problem if each node’s children only had to remember their location relative to their parent (or each parent only stored the locations of its immediate children) - like the bottom left box in the image below. In such a case, even a force-directed approach might work, because the “pushes” only occur amid the siblings within a single branch, though size changes still propagate upwards, creating pushes at each level above.
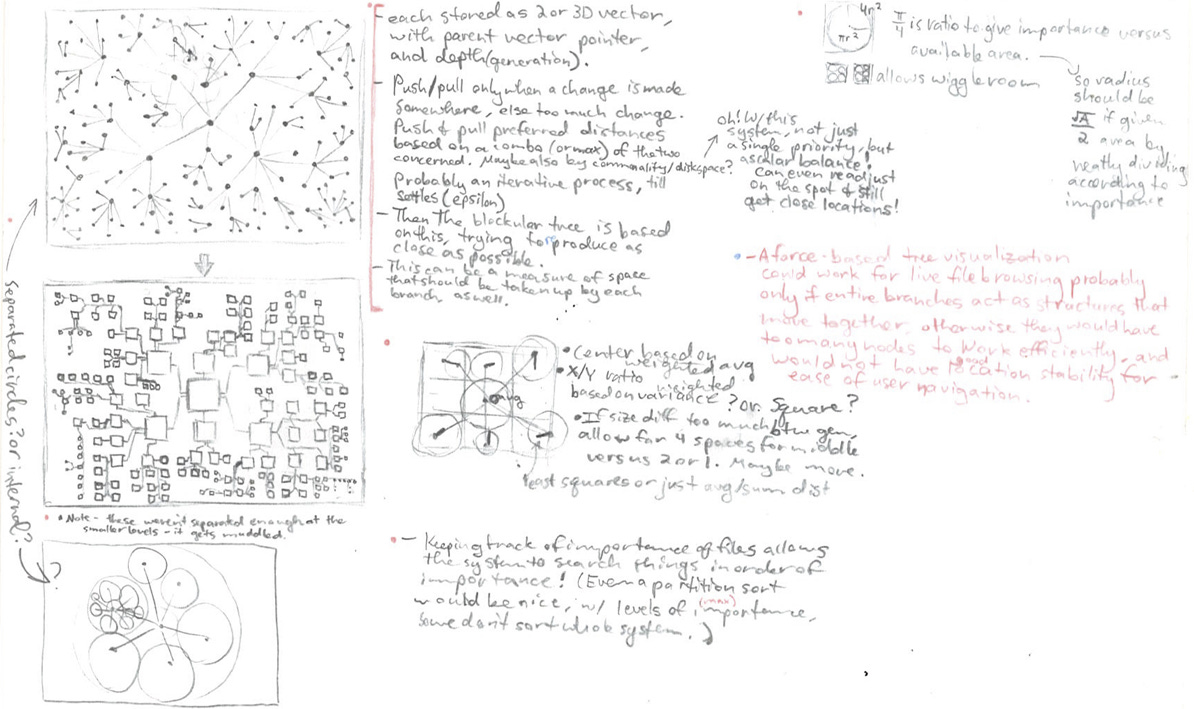
This, then, became an O(log(n)) solution, with a relatively stable layout! Only, it woudn’t look right - chaotic, instead of neat, organized structures (like in the first box above). So, this physics-y representation could be a backbone that isn’t rendered, while the actual locations might align to nearby grid slots that they fit within (see the middle box).
This could work! Though, choosing slots would be no easy task. And, it wasn’t the most efficient method. It didn’t feel quite finished, yet. But, it proved to me that what I was looking for might actually be possible. So, I kept my mind open.
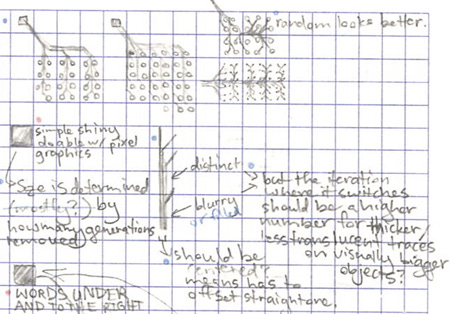
All along the way, my brain was also exploring, and sometimes solving, other, smaller parts of the problem, such as trace-drawing in groups of files,
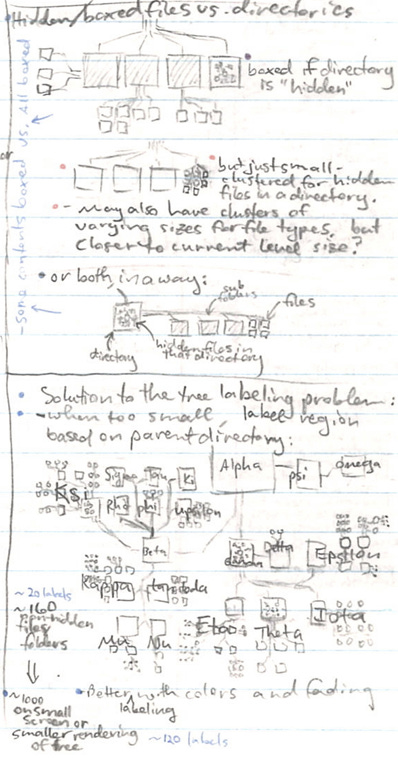
Compressing areas of the tree that aren’t useful to the user by drawing those branches inside their parent’s box (I call a branch drawn this way “boxed”), and labeling for areas too small to see by giving those areas’ drawing space to their parent’s label,
And considerations for box-drawing sizes and borders.
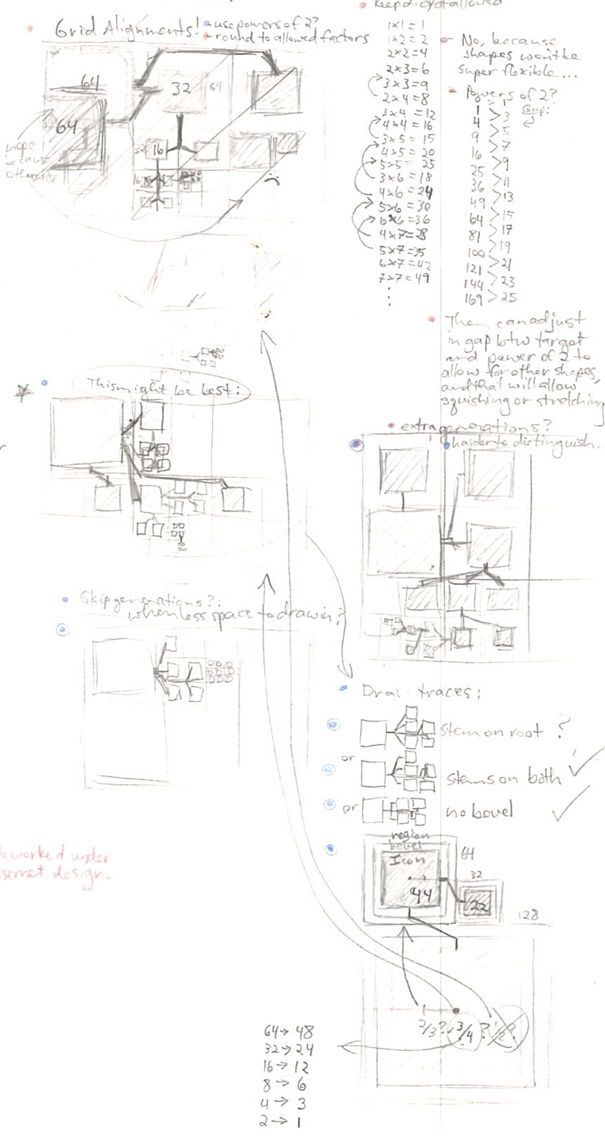
Over time (2019?), I identified problems with, and potential partial solutions for, the force-directed approach. Anything with a physics-like repulsion or collision calculation is going to be slow, and I tried thinking of things to mitigate that, like only doing checks more rarely, and leaving up to a threshold amount of space open after a deletion.
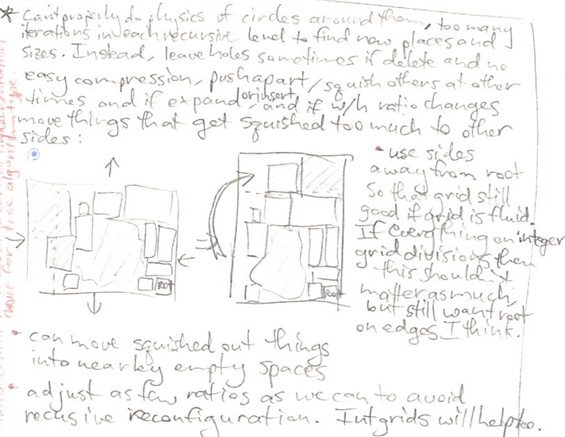
So, I iterated. What about rectangles? Parent rectangles bounding internal rectangles for their children, where they all move as a block when the parent is pushed around. Rectangles could be based on a neat and tidy grid, which could be much faster to compute changes for. I could set their sizes based upon their relative descendant counts, approximately. But, how do you arrange them, pack them neatly so there’s not tons of empty space around? Shape-packing, though I didn’t know it at the time, is a whole separate branch of research. (This is a part of the final solution that I still haven’t come to, but which is good enough for now as-is, without packing; although the idea below is worth considering, a sort of path-finding approach may serve better.)
Maybe an occasional physics-based correction sort of approach, with circles around them to push them apart, and then let them clump in towards the middle, to squish out extra space?
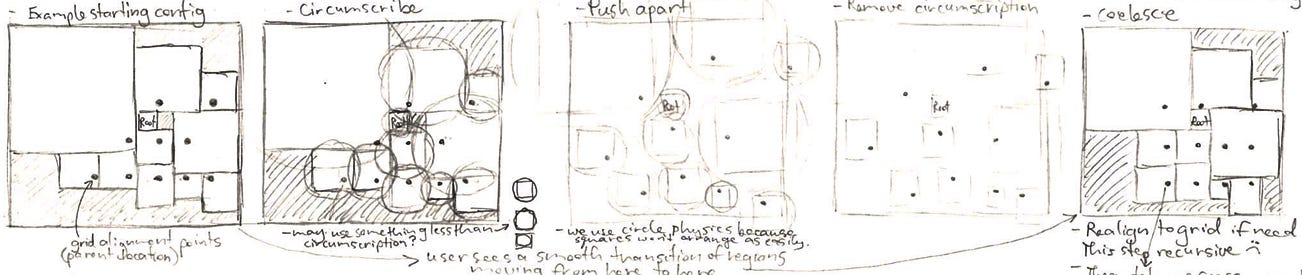
Of course, that’s not super stable - they might move around quite a bit whenever this happens. But, on the up-side, the result would look really good, and be really tidy, with rectangle bounding boxes!
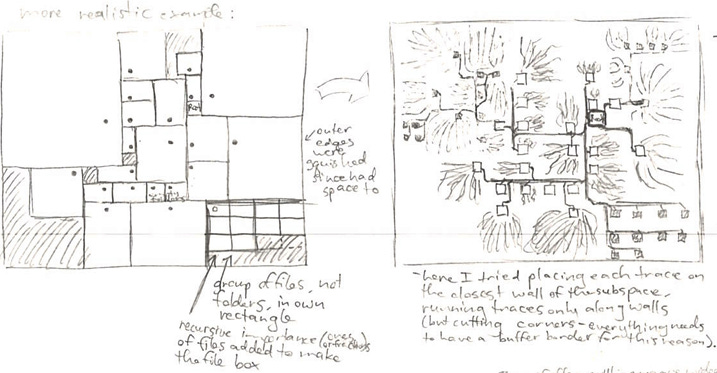
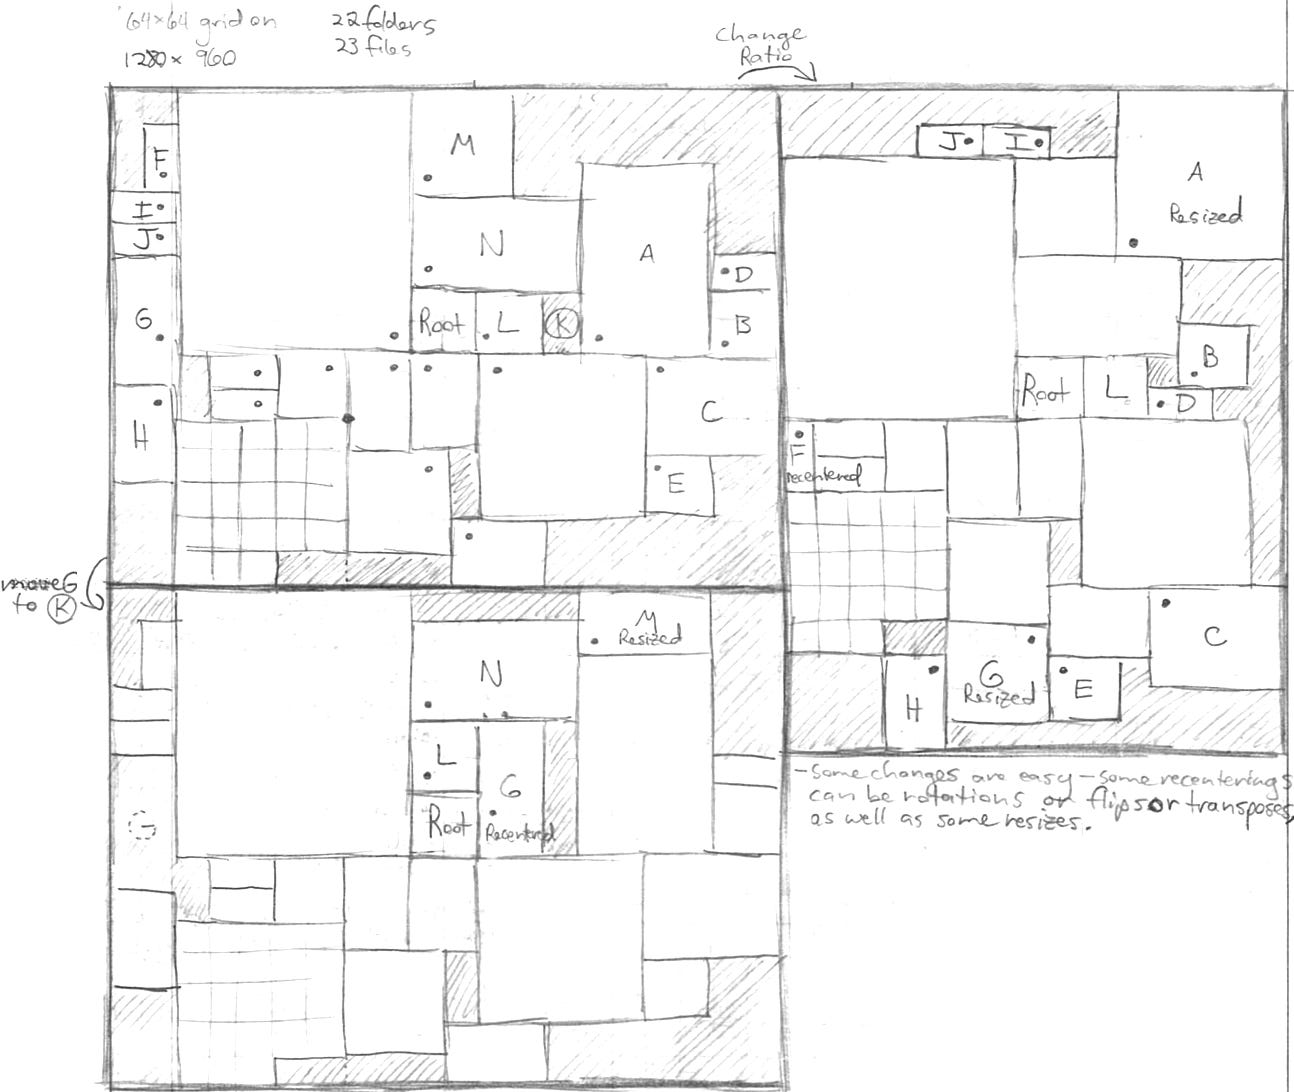
I began trying to code a prototype, to no avail. I didn’t understand it all well enough, yet, and it was a big project that I couldn’t do in the thick of my major’s core classes.
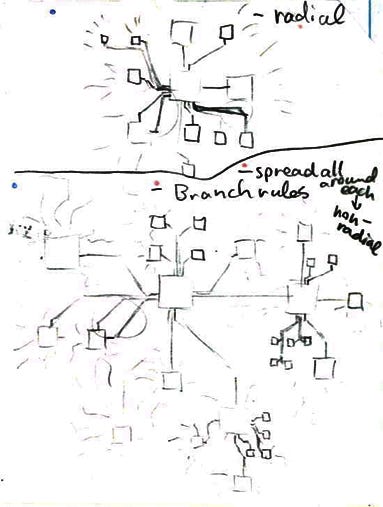
I played with other grid-based, but non-rectangle options, in hopes of dividing the space more systematically than this, since anything which rearranges objects makes the layout less stable, and therefore not as remember-able. I liked the idea of non-rectangular subregions, fitting together, but wasn’t sure how to make it work. I tried radial layouts adapted to a square grid, but the rules to make it work were messy and unreliable:
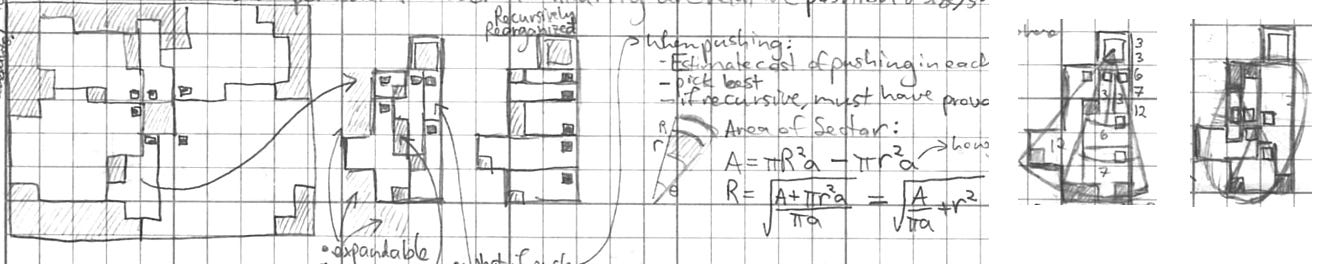
I started some code for this one, too. It didn’t get very far, either.
By this point, 2019-2020 ish, I was almost there. Maybe I knew it, maybe I didn’t, but I had most of the pieces for a simplified (rectangular) version of a GridTree, I only had to add a few finishing touches to finally get there. Well, the idea of one… a working protoype would yet be long in coming.
End of 2020 - Beginning of 2021
I was utterly burned out in school, but finally I was done with the final semester of my major’s core curriculum. I had a few more classes to take before I could graduate, but I took them very slowly, making a long, drawn-out super-senior year, where I had more time to simply be okay, more time to just sit, and more time to think and plan. And, with Covid-19 afoot, I had even more time to myself.
And it was time.
A veritable flood of ideas and details for Links began to take place. It had been flowing all along, but was becoming faster and faster. In the midst of my depression, while my faith gave me hope, working on Links brought excitement and enthusiasm into my life.
I’m not sure, but I think the name for Links came first, along with a clearer idea of a few more of its major components. Then, by January or February of 2021, the semester I would finally graduate from college, the pieces settled after months of stewing, and everything for the tree clicked into place. I don’t know exactly when or how it happened; it wasn’t sudden, or all at once, but finally all of the core pieces were there, and I understood them.
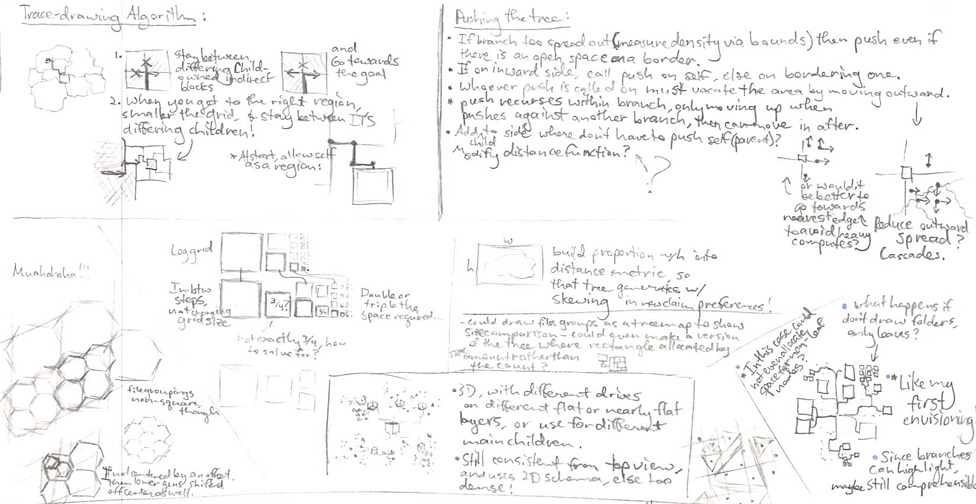
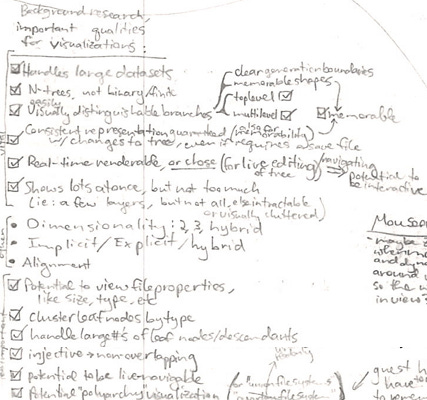
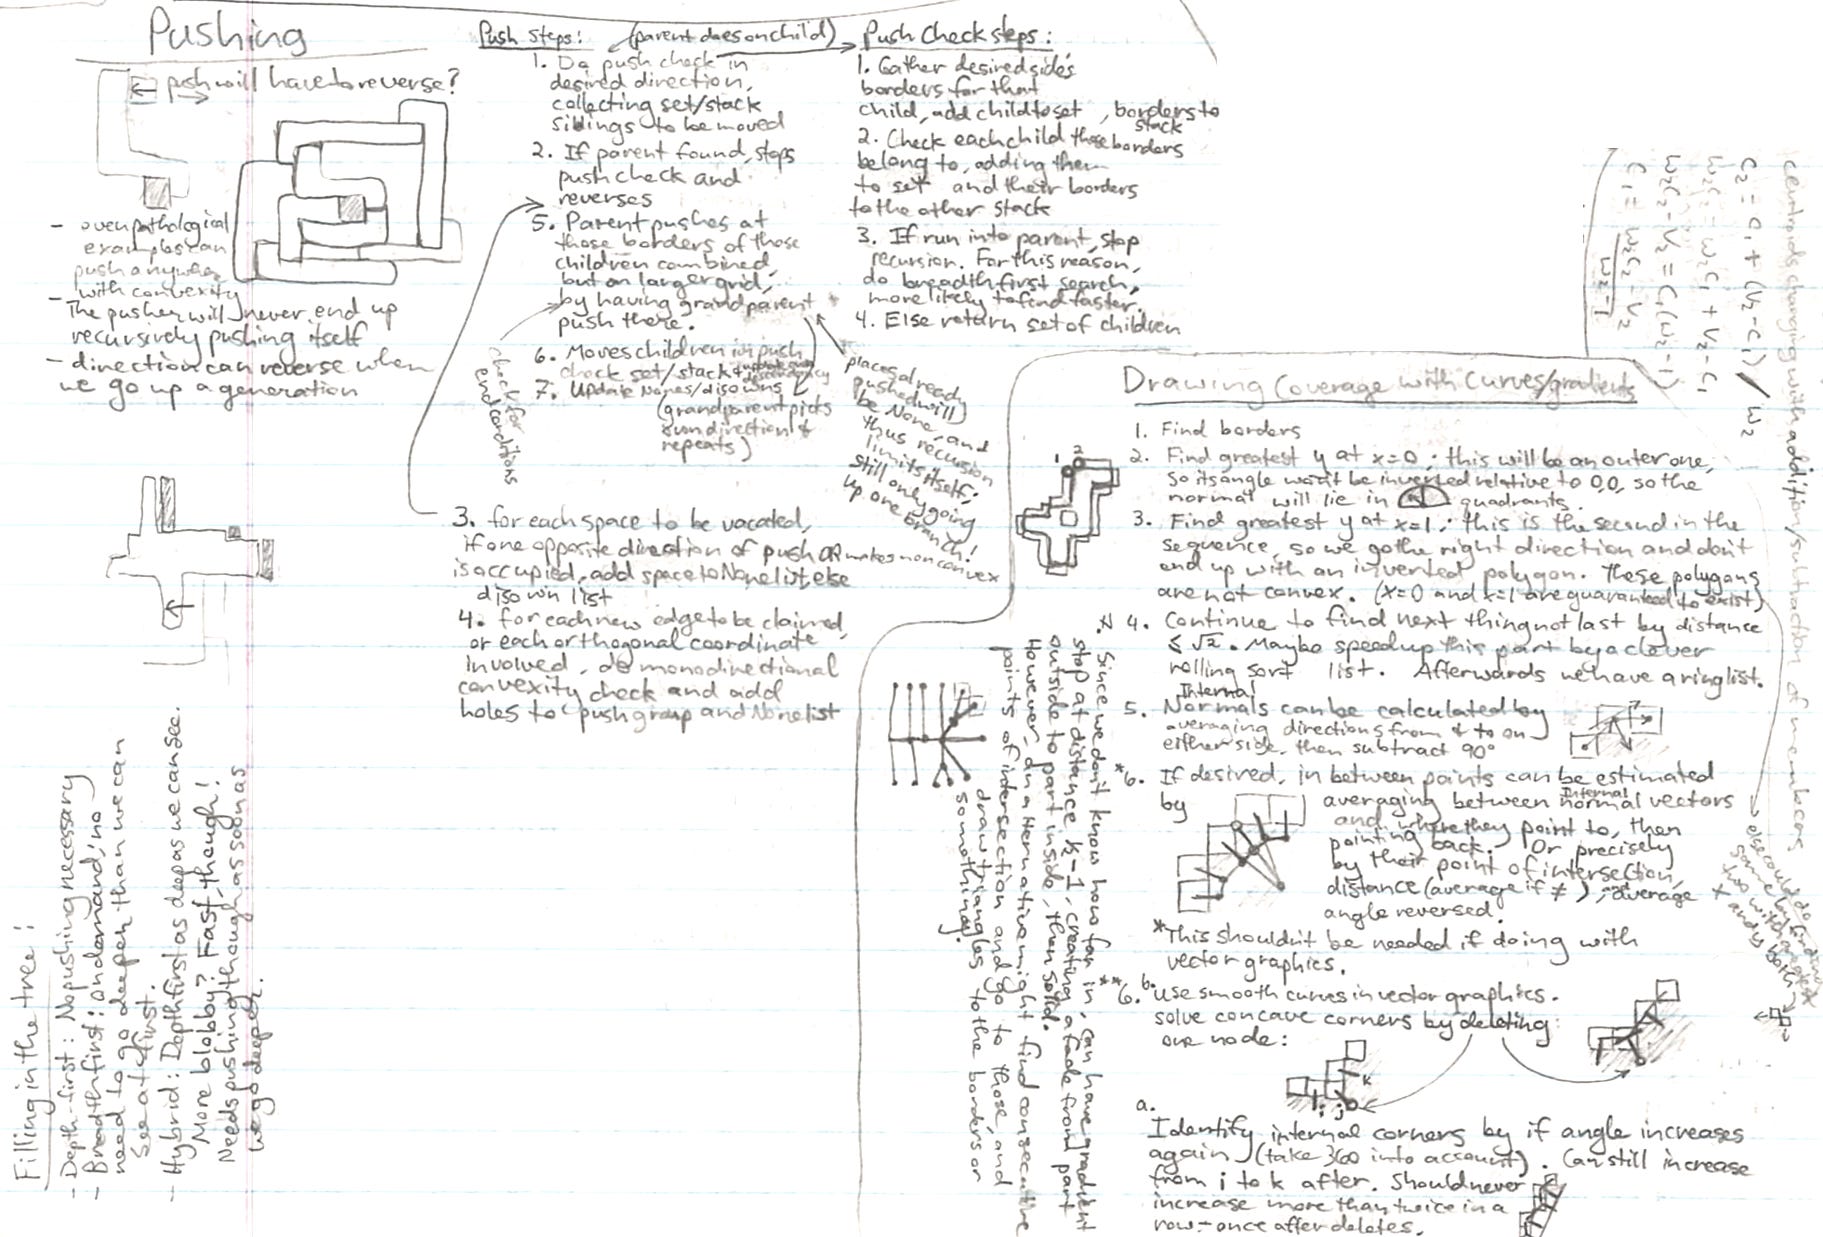
It probably helped that I was working to get some rudimentary code working around the same time - not the full algorithms that were in my head, but a basic mockup framework that I could start building them in. Having to code something is a good way of thinking deeply enough about it that you finally, truly understand it.
Finally, that February, the name came to me, and I called this new data structure a GridTree.
After this point, the tenor of my handwritten notes changes (though I’ll not post any further images for the moment). While still being multitudinous pages of tiny, cramped notes and diagrams, they sort of zone in, and take a more serious and organized approach - they feel more real. As if the whole thing began to feel more and more real to me. I organized them into a professional-looking portfolio binder, and began making liberal use of a 0.3 mm mechanical pencil. (I love that pencil.)
(Note: The ideas in the images above from my notes may no longer be quite accurate, as things have continued to evolve and become clear over time.)
A GridTree is, in essence, just what it sounds like. It is a tree of grids, or rather, coordinate-based hashmaps, in my current implementation. Each successive generation down the tree is drawn at half the scale, meaning four nodes at depth 2 take up the same space as 1 node at depth 1. Each node’s map represents the spatial claims of that node’s descendancy. These give space and shape to branches, and prevent them from overlapping. For its own location, each node needs only remember its position relative to its parent - thus when a node gets pushed around, its entire descendancy moves with it, without having to rewrite but a single coordinate pair (though some things need updated in the ascendancy).
Imagine first a node at the bottom - a leaf node. Its own map, or grid, would be empty, (or the size of its own little square,) as it has no descendants. It’s parent, however, obviously has at least one item in its grid, and probably more. A grid tells which region is owned by which immediate child - all further descendants are counted as simply being part of that child - which means, when we examine the grandparent, we see that it only stores a minified version of each of the maps in the layer below it. In this way, you could say that the information gets more and more serialized as it goes up the tree.
These grids are allowed to be odd-shaped - but with a constraint. One of the keys I had to figure out was that of orthogonal convexity - which means convex along the x and y axes (allowing -, L, T, +, and Z-like shapes, and other combinations of these, but not C or O shapes). This one simple constraint allows all child subregions within a map to easily slide apart in any direction so that something can be inserted anywhere, while changing the layout as little as possible. If C shapes were allowed, things could potentially get caught on each other, or get stuck inside of another subregion and have to change it or move further away in order to grow. We only want changes to propagate up the tree, not sideways to change siblings’ shapes, and we want those changes to be as small as possible.
Obeying this constraint makes our algorithms messy, but conceptually it’s easy to understand - you just fill in any C shape with claimed empty space, to make it orthoconvex. Of course, then you have to watch all that empty space, clean it up when it’s no longer needed, etc….
When a branch grows (or shrinks), sometimes the change is big enough that it propagates up the tree, changing the map of its parent, and sometimes that change moves upwards, and so on. But not always - and that’s the beauty of it. That makes it fast, visually stable, and algorithmically appreciable - magical, even, in my mind.
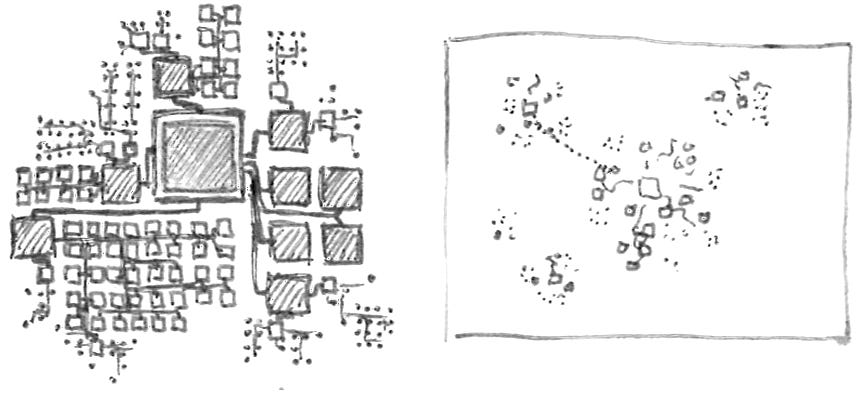
This design allows me to have more interesting branch shapes than simple rectangles would (though that works too). It allows O(log(n))-like insertion, move, and deletion behavior. It has a stable layout without any force-directed computation, looks really cool, doesn’t clutter the visual space too much, shows you several layers at once while still differentiating easily which generation a node belongs to, and making deeper parts of the tree feel further away. I had yet to fully solve navigating around the tree visually, but it felt doable (and I have solved it, since then). It can be rendered and updated in real-time, has fairly clear branch groupings and hierarchical structure, and leaves options open for color-coding nodes based on any desired critera (usually file type, but one can also do size, frequency, etc).
And, years down the road, with it finally working, I can say it looks quite a bit like I was imagining from the very beginning, that fateful night in Belgium. And that is amazing. I won’t spoil you with the eyecandy just yet, however.
Now, if all of that left you totally confused, don’t worry. It only took me a few years to understand it… and I’ll try to go more in depth in a later post - the one where I make cool diagrams to help explain it! I apologize that it’s all very abstract for the moment.
Something I find fascinating about this whole process, is that I likely didn’t even know for sure that I had the answer, at first. I believe there was a point where I saw that a certain hierarchical structuring and mapping system could work, before I yet knew how to do it. From there, I had to figure out the actual insertion and other tree operation algorithms to follow that structure. As if, perhaps, I first had the answer before I knew it, and then later, some part of me knew that this could actually work, before I knew how, and then finally, the whole thing clarified in my mind as I studied it out. Pieces of a complex understanding, such as this one, they distill a little at a time in our minds.
I believe the gospel of Jesus Christ is usually the same way. It is over time, with many tiny experiences, that we slowly grow our own witness, or testimony, that God is real, that the holy scriptures are truly His word, and that Jesus Christ is our Redeemer. Our understanding of Grace, our very faith, takes time to cultivate, and it comes a tiny piece at a time - long before the whole picture is clear. And moving forward anyways? Trying, despite a lack of any real proof? That is what faith is. I have grown such faith in my life, nourished it until it has become a powerful and sturdy tree - similar to how I exercised faith in pursuing the process of discovering GridTrees, even though I had no proof, along the way, that it could ever really resolve into a functional whole. But I pushed forwards, I kept purusing my hope, my dream, until I proved it is real.
And then?
If you stop when you have the answer, the whole process is wasted. Having proven by your diligence that you really want this, I hope that you then keep on going. Faith, if not acted on, is dead. Just as an idea, even a perfect one, without someone to build it, amounts to nothing.
So. Keep on going. Use what you learn. Make of it something real. Let it change your life.
As for this journey of discovering GridTrees, I don’t think I can quite describe how inspired all of this has felt, all along the way, and still feels. I cannot possibly attribute this flood of ideas, of light and knowledge, to myself alone; I can only thank that higher power that I rely upon, every day of my life. Neither the bright sparks of clear illumination entering my mind in an instant, nor the slow sunrise of understanding of ideas too big for my mind to fully hold, have felt like they came from me. And if that’s the case, then…
Why does God need a GridTree?
I have no idea if He even does. Is Links really important, in the grand scheme of things? I’ve been pondering on these questions for a long time. Perhaps, rather, all He really needs from it, is for me to learn some life lessons by working to create it, and to share what I learn with those for whom it will make a difference.
So. I know this project will take many years; that’s why I’m starting now. After all, don’t they say that, “The best time to plan[t] a tree is 20 years ago”? Perhaps twenty years from now, the world will need it. I guess only God really knows. And that’s enough to me, for now.
Comments
Nothing yet. Say the first thing.
Sign in to join the conversation.