

When the valley looks calm, but the fault lines are already glowing.
This desk tracks a curated network of independent macro analysts -- traders and strategists who run real capital, publish original thesis, and operate outside the institutional consensus machine. Over the past three weeks, they’ve done something unusual: they’ve all independently reached the same conclusion.
Every one of them is now defensively positioned.
One by one, across different frameworks and different asset classes, each arrived at some version of the same read: risk is mispriced, positioning is extreme, and something is structurally fragile beneath the surface. The last holdout -- who was still adding risk on February 8th -- flipped bearish on February 15th.
That would be notable on its own. What makes it a signal worth writing about is what the rest of the market is doing: the exact opposite.
h/t Kevin Muir
The Gap
Here’s the positioning picture in February 2026:
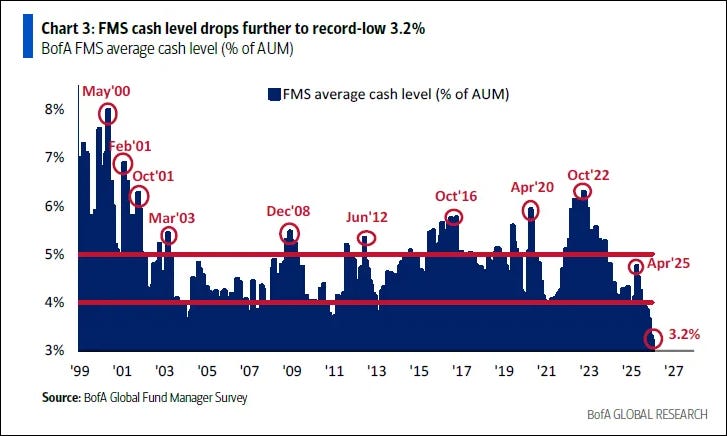
Institutional fund cash sits at a record low of 3.2% -- the lowest reading in the history of the BofA Fund Manager Survey. JPM retail equity flows just hit $48 billion on a 21-day rolling basis -- an all-time record, roughly double the prior peak extreme. The BofA Bull & Bear indicator reads 9.6, the highest since March 2006 and a level that has triggered sell signals with a 63% hit rate since 2002. Citadel Securities measures retail risk-on positioning at the 95th percentile. Equity protection is at its cheapest since the 2018 Volmageddon blow-up. The S&P 500 trades at 22 times forward earnings -- a multiple last sustained during the dot-com era.
The crowd isn’t just bullish. The crowd is historically, quantifiably, all-in.
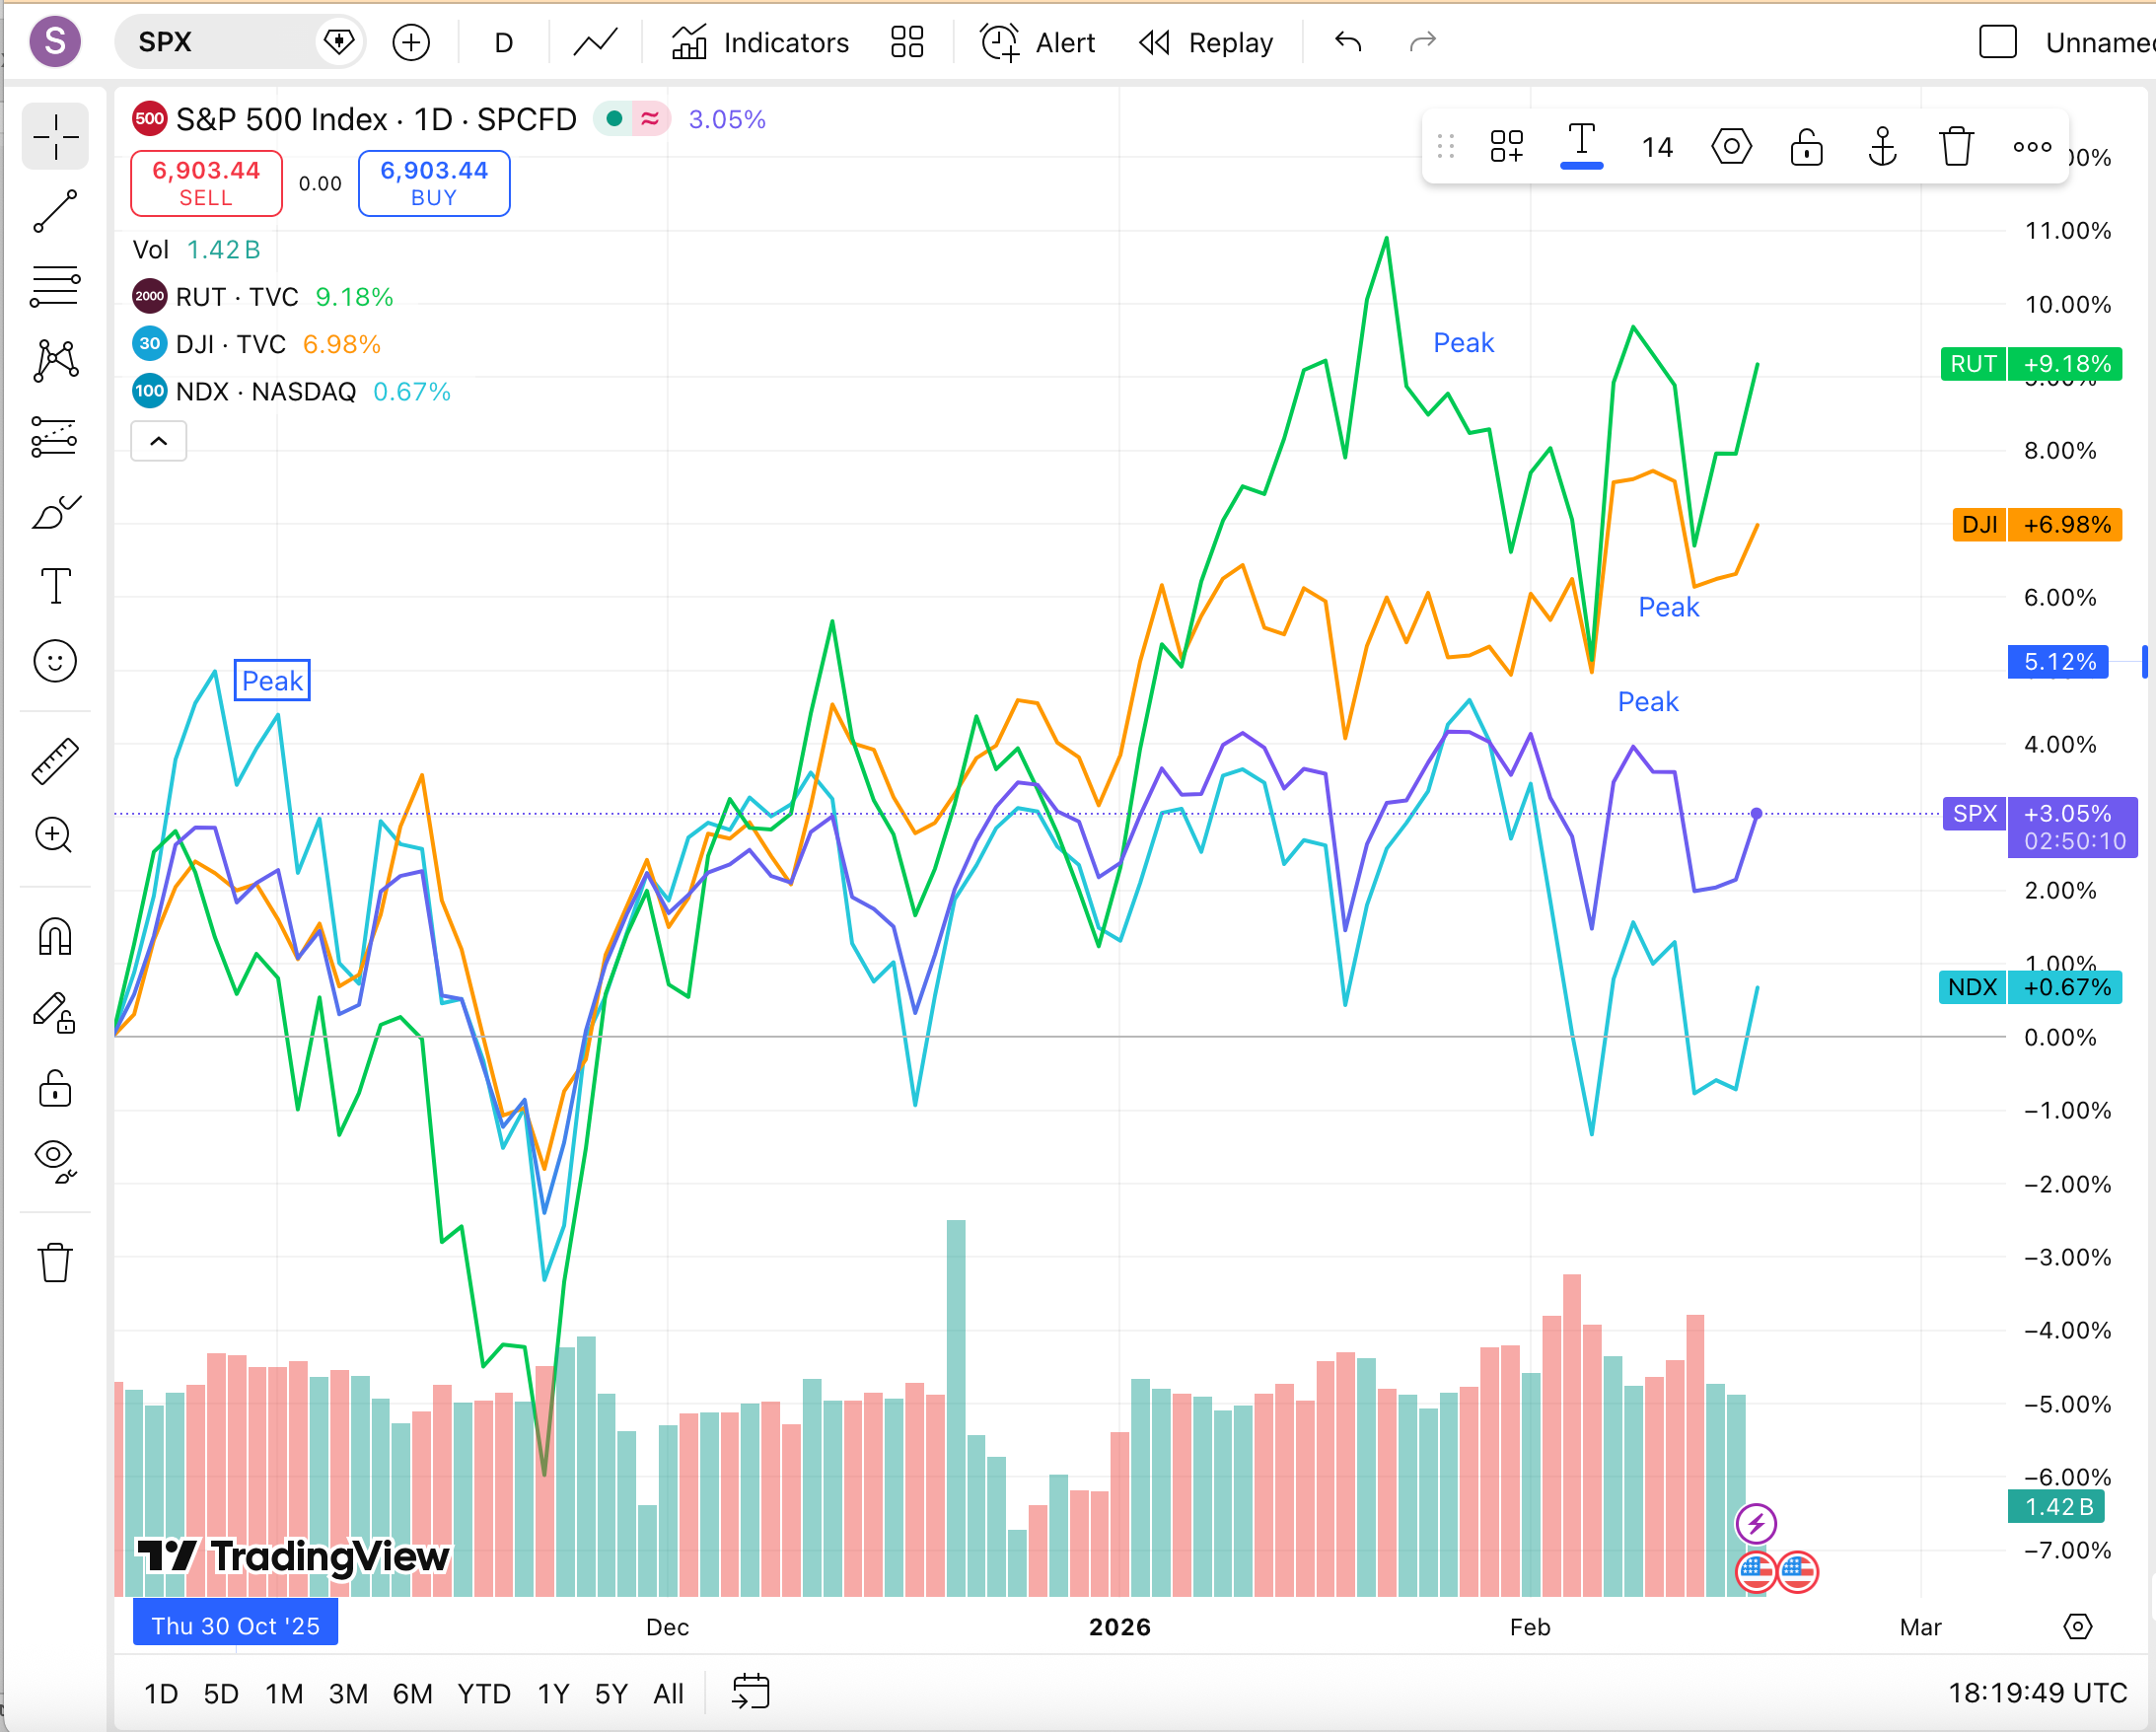
Meanwhile, the analysts this desk tracks are buying puts, raising cash, harvesting winning positions, rotating out of US assets, and -- in one case -- running fully open downside exposure for the first time in years. One describes the current market as a “positioning shock waiting to happen.” Another says the potential for a volatility accident “is greatly underappreciated.” A third frames the current regime as a bear market already underway, with the diverging all-time highs across indices (Nasdaq peaked October, Russell in January, the S&P in late January, the Dow in early February) as the signature rolling-top pattern.
The gap between what these scouts see and where the majority is positioned is, by multiple measures, the widest it has been in decades.
What They See: A Bifurcated Regime
The macro regime doesn’t fit neatly into any single category, which is itself a warning sign.
Manufacturing is inflecting higher. ISM New Orders posted their strongest reading since 2001 outside the pandemic recovery. German factory orders surged 13% year-over-year in December. Goldman Sachs’ Current Activity Indicator shows global growth at +3.0%, with developed markets at a 12-month high.
But the labor market tells a different story. The February jobs report beat expectations at +130k, yet annual benchmark revisions revealed that 2025 averaged just 15,000 jobs per month -- the weakest non-recession hiring year since 2003. Professional and business services shed 57,000 positions in a single month. NFIB job openings hit their weakest level since the pandemic. The surface looks passable. The foundations are deteriorating.
This is the bifurcation: manufacturing and commodities say early-cycle recovery. Labor and the consumer say late-cycle fragility. Both are showing up simultaneously in the data, and the resolution matters enormously for what comes next.
The scouts are betting that the labor side leads. The crowd is betting it doesn’t matter.
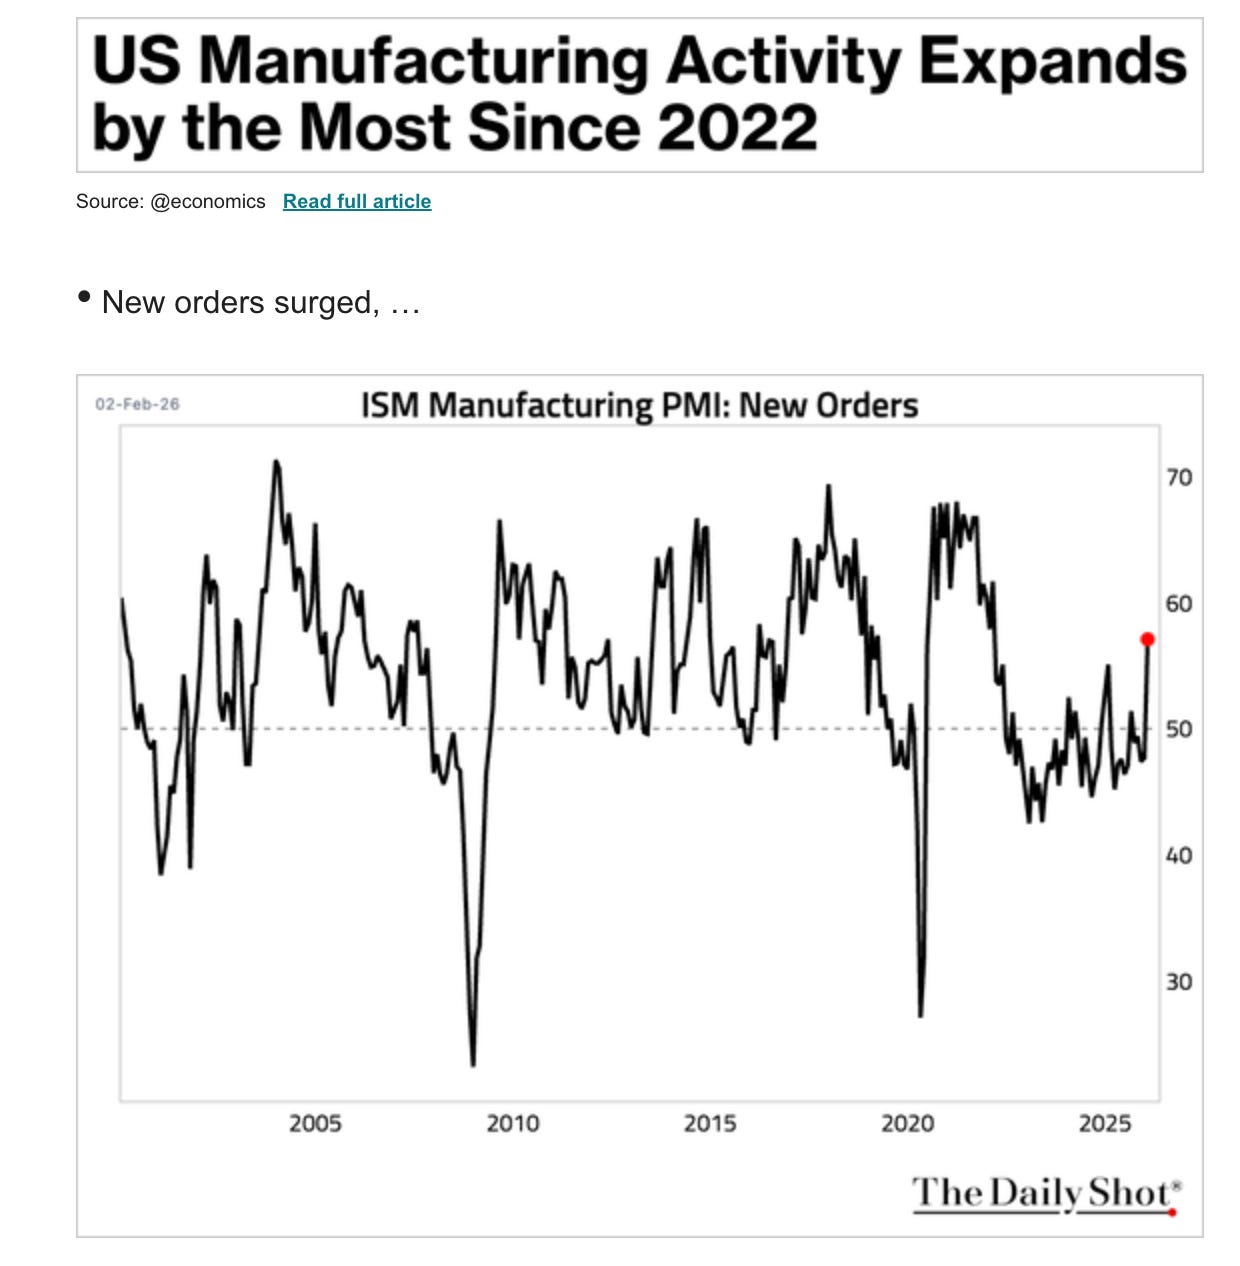
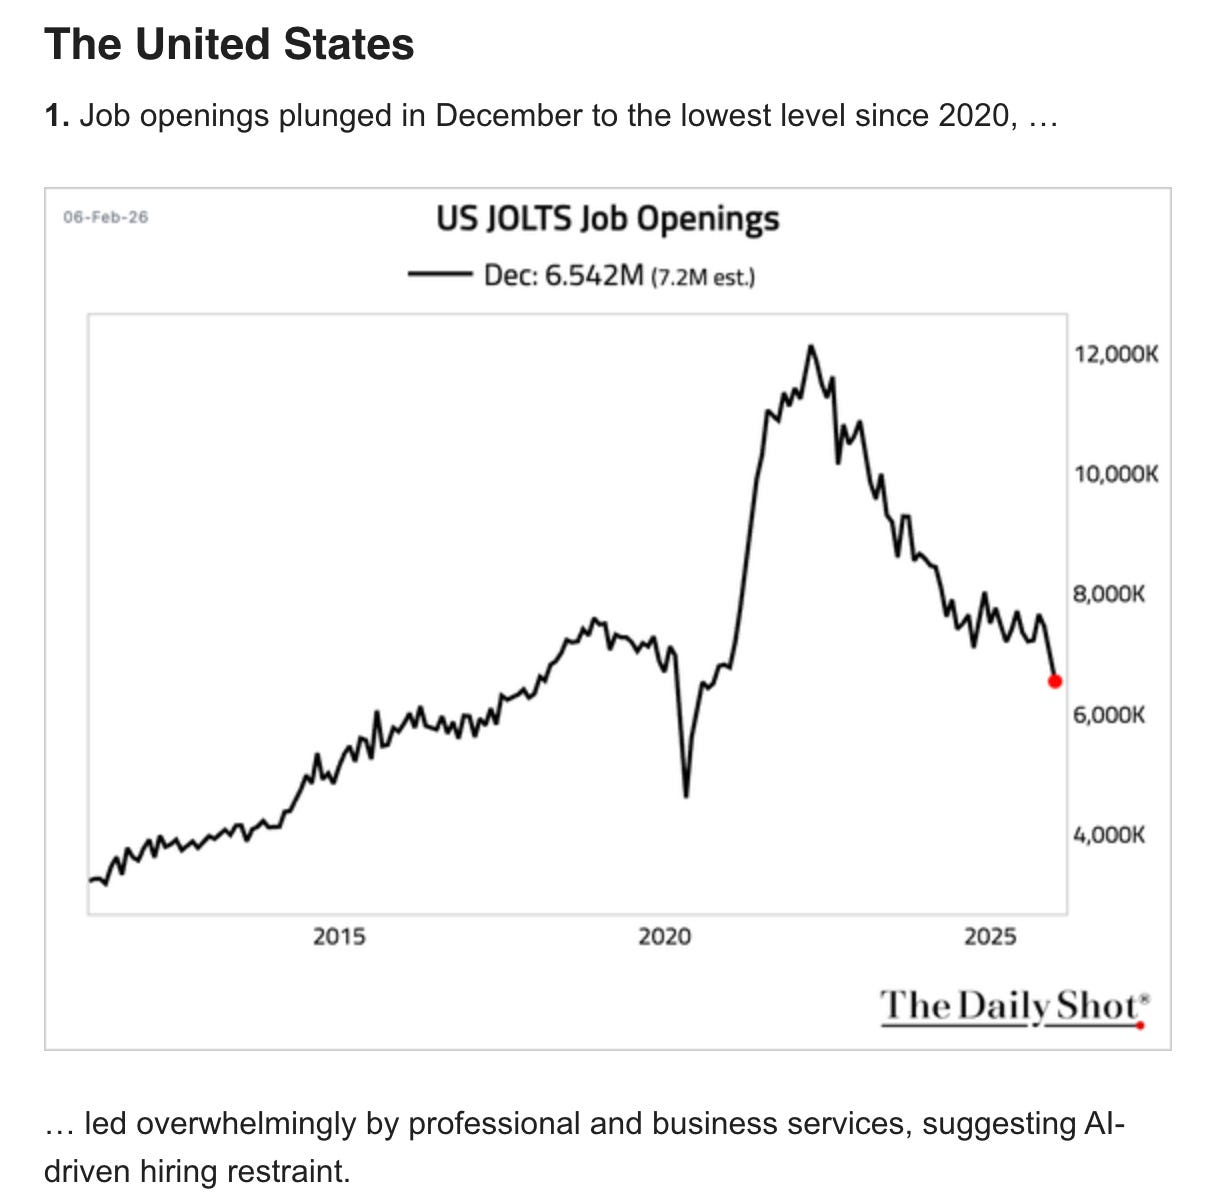
Source: Daily Shot (@SoberLook), Feb 3 and Feb 6, 2026 editions. Underlying data from FRED (ISM PMI series, JOLTS series JTSJOL).
Five Themes, One Direction
Across the analyst network, five major themes are converging toward the same macro direction. The degree of independent agreement is rare -- and it tells you something about the structural forces at work.
The bond bear. The US government has $10 trillion in Treasuries maturing in the next twelve months. Foreign ownership has declined from 33% to 25%. Net interest runs $3.5 billion per day. Multiple independent analysts, reinforced by institutional research, see long-end yields grinding higher regardless of whether growth accelerates or contracts. The fiscal math doesn’t require a recession or a boom to be bearish for bonds -- the supply alone overwhelms.
The dollar bear. Twelve independent voices now point the same direction on the dollar. The structural case -- reserve diversification, twin deficits at 12% of GDP, a 23-year dollar cycle that’s the longest on record -- is well established. But what confirmed it was a February data point: strong US payrolls printed, and the dollar didn’t rally. The historical correlation between growth surprise and dollar strength appears broken. A former Goldman chief FX strategist documented this regime shift with 20 years of scatter plot data.
The rotation. Value is crushing growth. International equities are outperforming US benchmarks by 15 to 20 percentage points year-to-date. Rail stocks are breaking out of their second-longest consolidation ever. The Dow leads the Nasdaq by five points. Foreign investors hold a record 36% allocation to US equities -- more than double their 2014 level -- and if that flow reverses even partially, the magnitude of capital rotation dwarfs anything in recent memory.
Two historical analogs are competing. The 2003 analog says this is the start of a multi-year value-led cycle. The 2000 analog says it’s the last rotation before everything rolls over. In three of the four prior instances when more than 60% of S&P stocks outperformed the index, the S&P itself declined with a median loss of nearly 12%. The next four to six weeks are the arbiter.
Image: EFA (International) vs SPY (US) year-to-date performance gap.
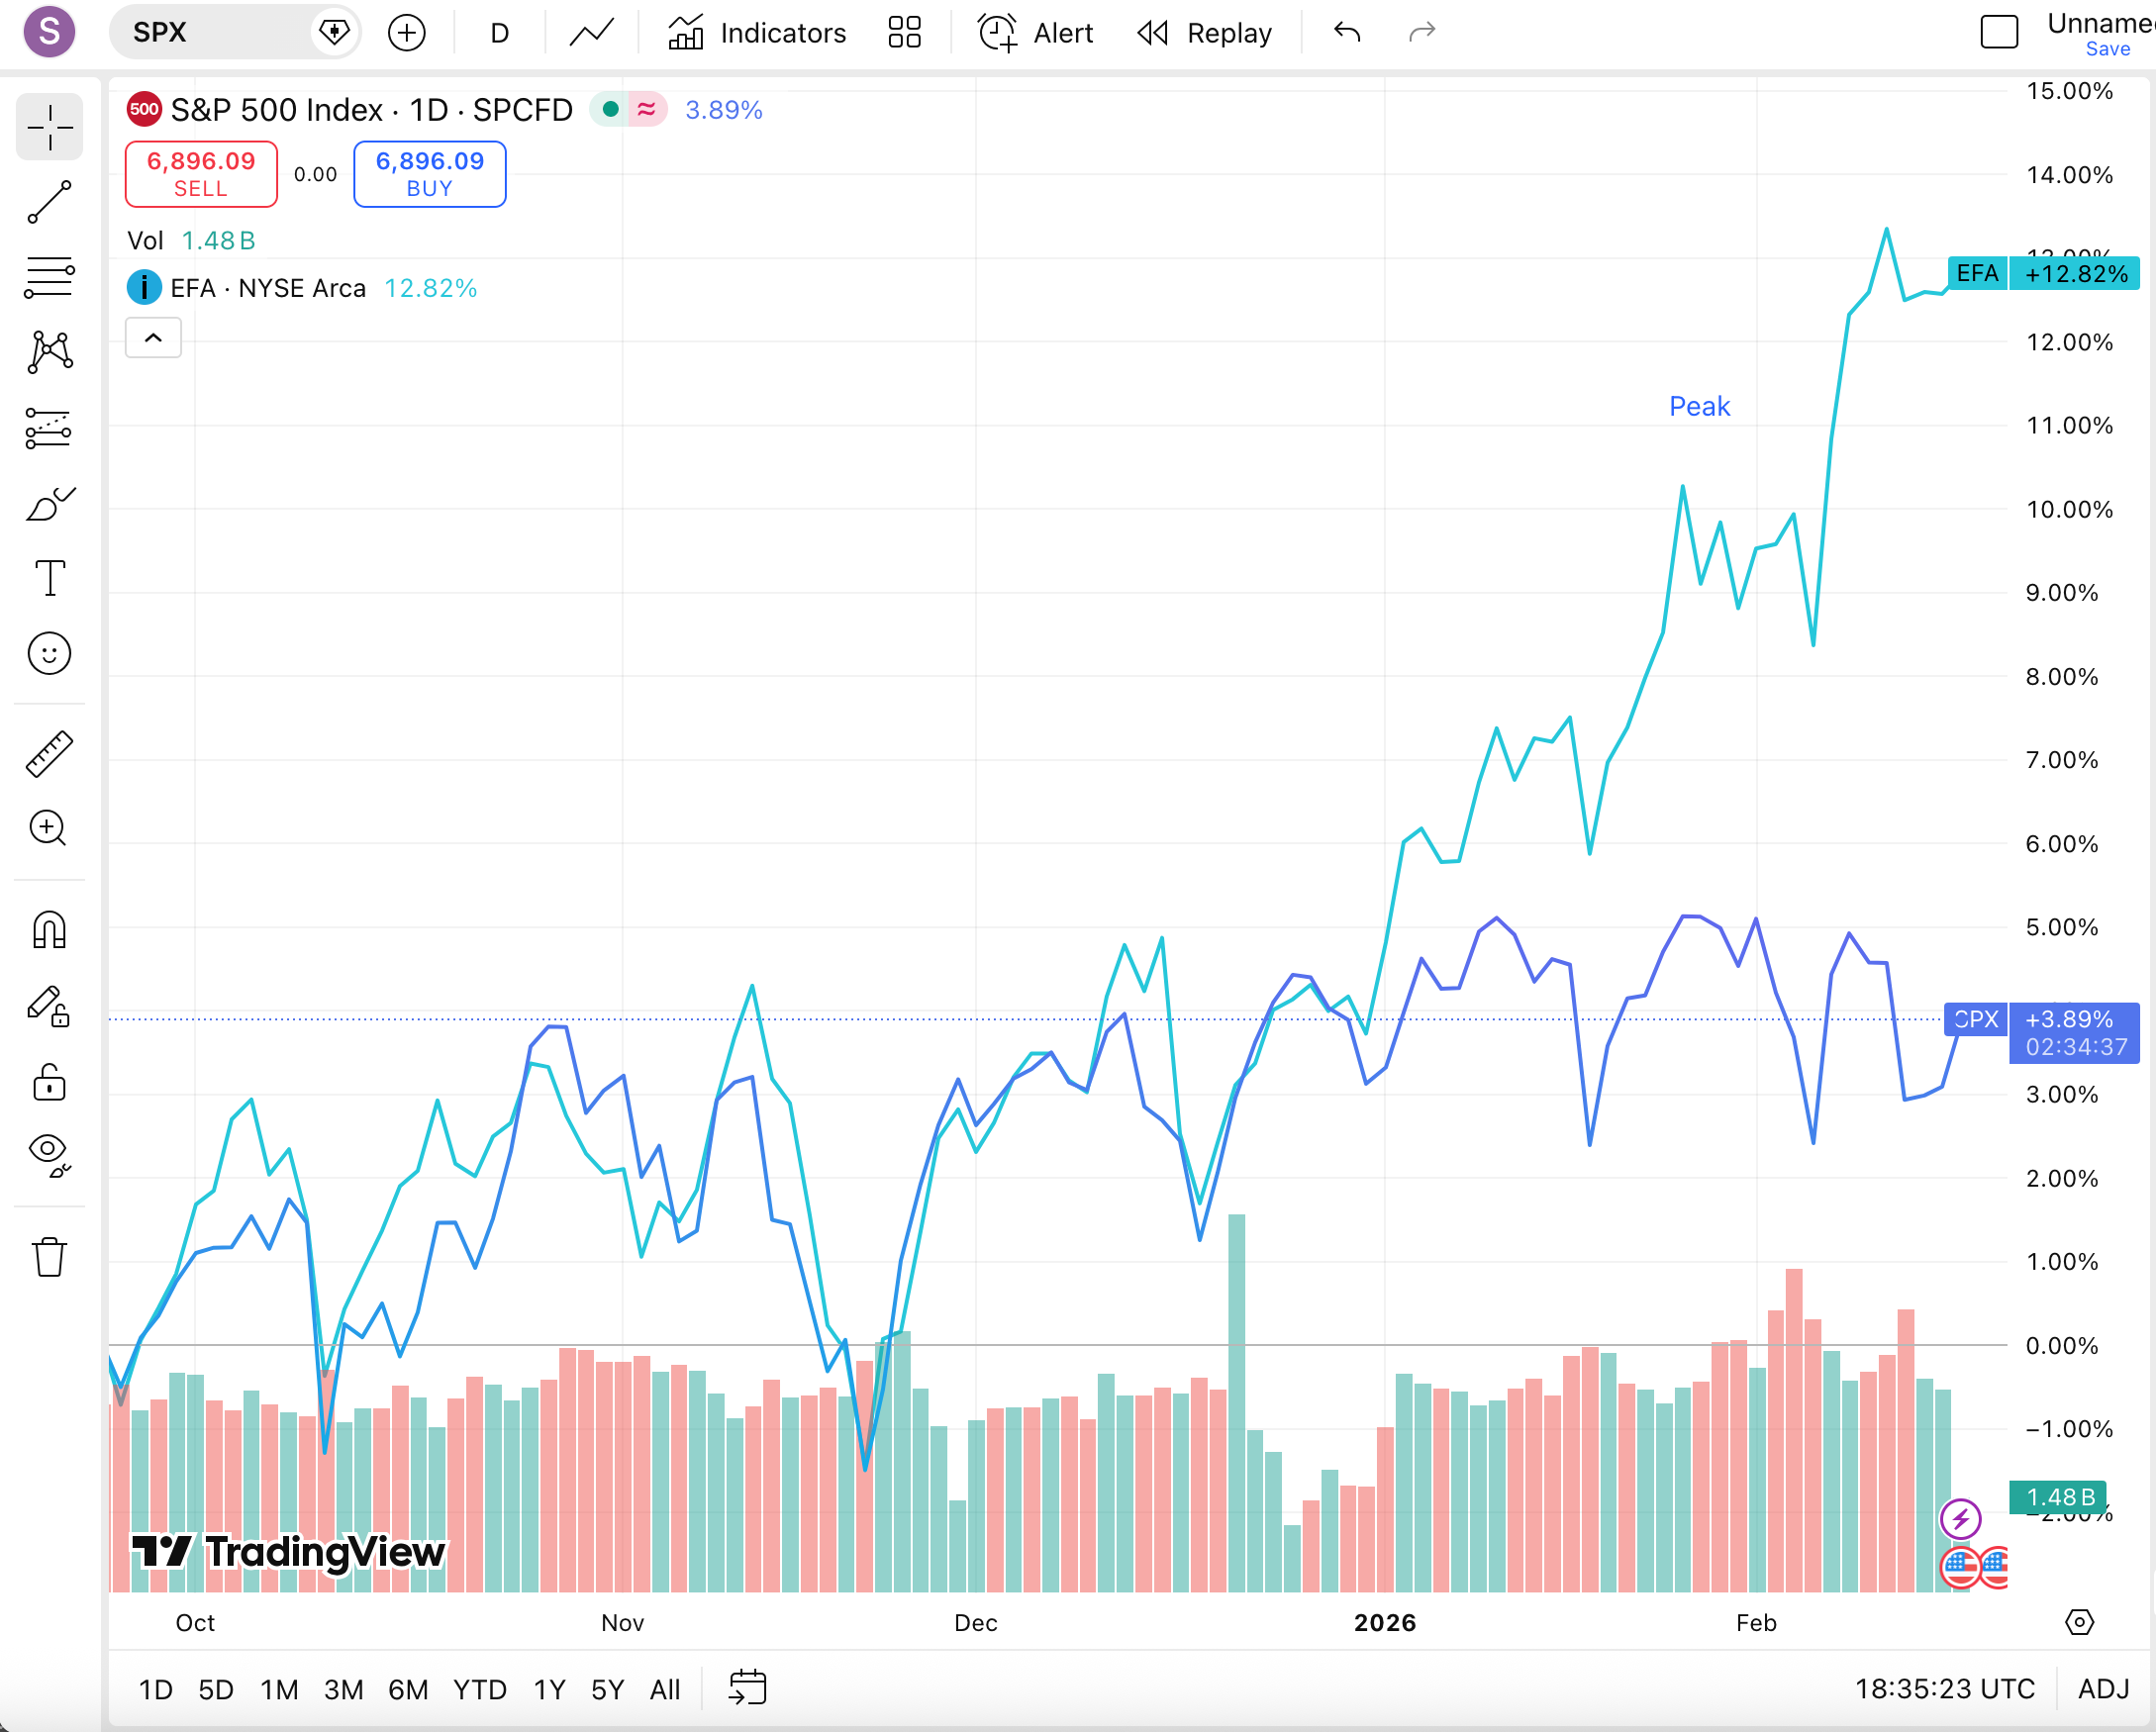
The metals question. Every analyst in the network agrees that gold and silver are going higher. But the most interesting signal isn’t the direction -- it’s the disagreement on why. One camp sees reflationary trade dynamics. Another sees financial system stress. The evidence for the stress interpretation is uncomfortable: inflation swap rates are lower than most of late 2025 even as gold went parabolic. If the metals move were about inflation, swaps would be rising too. They’re not. Gold volatility has only been higher during the 2008 financial crisis and March 2020. Something beyond inflation is being priced.
The AI displacement cascade. Software and knowledge-work businesses are being repriced in real time. In a single week, $50-100 billion companies in insurance brokerage, financial data, and real estate services lost 8-12% of their market value. The software ETF hit its most oversold reading in twenty years. Valuations compressed to the 2014/2016 trough -- but the bounce has been tepid. The displacement is moving beyond pure software into any business whose competitive advantage consists primarily of organizing information. And the reflexive loop underneath -- software exposure in syndicated loans, BDCs, and private equity -- creates a contagion channel that most investors haven’t mapped.
What Breaks This
Every thesis on this desk carries an explicit invalidation. That’s non-negotiable.
The biggest risk to the scout consensus isn’t that any single thesis is wrong. It’s that the structural bid underneath US equities -- 401k inflows, corporate buybacks at $1.5 trillion annualized, a shrinking public company universe -- makes drawdowns shallower and recoveries faster than historical patterns suggest. The scouts could be directionally right and still lose money to time decay on their hedges if the catalyst arrives late. Protection is cheap now. It won’t stay cheap if the trigger doesn’t arrive by mid-March.
The other risk is simpler: the crowd has been right for most of the last fifteen years. Buying every dip, staying long US mega-cap tech, and ignoring macro warning signals has been the dominant strategy of a generation. The scouts are asking you to consider that this time the structural setup is different. They may be early. Being early and being wrong look identical until they don’t.

Gunjan Banerji@GunjanJS
Mutual funds are all in on the stock market At the start of 2026, US equity mutual funds held just 1.1% of asset in cash, the lowest level in 20 years of data history --Goldman

10:00 PM · Feb 9, 2026 · 6.55K Views
2 Replies · 9 Reposts · 57 Likes
Mutual fund cash at 20-year lows (Goldman data, 1.1% of assets). Source: Goldman Sachs fund flow data, cited by @GunjanJS. H/t Kevin Muir / The Macro Tourist private feed, Feb 5-11, 2026.
The Desk’s Posture
The desk maintains its hedges. It does not add risk here. But critically -- it also does not add bearish exposure. When the forward-looking analysts have all arrived at the same conclusion, the question shifts from “are they right?” to “who is left to sell?” The next surprise, when it comes, may not be the one anyone is bracing for.
In a regime this contested, the desk favors convexity over direction. That means reducing outright exposure -- the positions that need the market to move in a specific direction on a specific timeline -- and replacing them with asymmetric structures that pay if the move happens but limit damage if the timing is wrong. In practice: own the right to participate in the rotation toward real assets and industrials without betting the portfolio on when it arrives, while simultaneously owning downside protection on the indices and sectors most exposed to a positioning unwind. The goal isn’t to predict the resolution. It’s to be positioned to benefit from it regardless of which side of the bifurcation leads -- while paying as little as possible to wait.
Protection is cheap. Optionality is underpriced. And in a market where the crowd is all-in and the scouts are all-out, the one thing you don’t want to be is directionally committed to a single outcome.
This is what the scouts see from the ridge. The valley below looks calm. The data says otherwise.
This is the inaugural post from the Global Macro Intelligence Desk at Leading Platforms. The desk synthesizes directional calls from a curated analyst network, tracking where they agree, where they diverge, and where the crowd is getting dangerous. Every thesis has a kill switch.
Nothing here is investment advice. These are analytical observations, not recommendations. Do your own work.
No posts
Comments
Nothing yet. Say the first thing.
Sign in to join the conversation.