
Blending Elliott Wave Theory with price action helps traders spot high-probability trading opportunities. Check out the research below on Paytm on how Elliott wave acts as a GPS even for stocks.
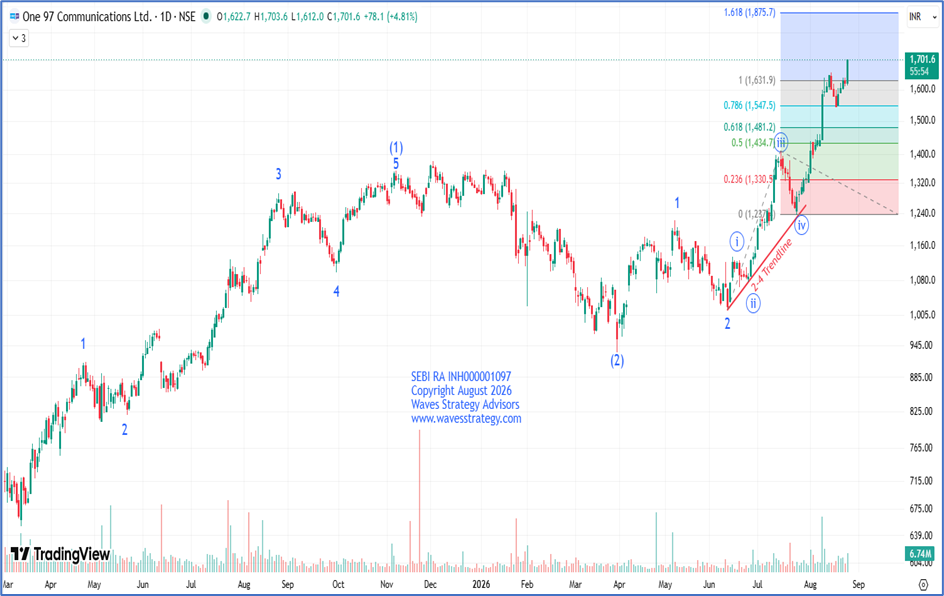
On the daily chart, PAYTM can be observed heading higher, particularly since mid-June 2026, indicating strong bullishness in the stock.
Since then, the stock has delivered a whopping gain of more than 66%, forming Higher High and Higher Low structure, which is a positive sign.
As per the wave perspective, PAYTM completed its Primary Wave (2) in March 2026 near the 930 level.
Post which the stock has been trading in the form of Primary Wave (3), which is further subdividing in nature.
The current rise is ongoing in the form of Intermediate Wave 3, within which Internal Wave 5 is currently unfolding.
Internal Wave 5 appears to be extended, and if the extension continues, then as per Elliott Wave guidelines, it can potentially extend up to 1.618 * of Waves 1 and 3.
The combination of Elliot Wave structure, price action, suggests the stock is on the side of bulls.
Dips can be used as an opportunity to ride the ongoing trend with 1540 level remains a crucial support to watch in the near term.
We had also covered this stock previously in our “Vayu Research Report” dated on 24th August 2026.
If you have any questions, comment below!
No posts
Comments
Nothing yet. Say the first thing.
Sign in to join the conversation.