
This essay compares the lifetime costs of EVs and petrol cars driven in the UK if we strip out all taxes and subsidies.
On this basis, the lifetime costs of an EV manufactured in Europe and driven in the UK are higher today than those of an equivalent petrol car.
However within a few years they will likely be lower under a range of plausible assumptions about manufacturing costs, electricity prices and vehicle longevity.
A Chinese manufactured EV is already cheaper than a petrol car manufactured in Europe on a lifetime basis for most consumers even without the help of tax benefits – and will in the long term be much cheaper.
The UK public wants action on climate change but does not want to incur much cost in doing this.
This evidence suggests that the decarbonisation of domestic road transport is a good way for any government to fulfil this difficult mandate (less emissions, no higher cost). Retaining this as a direction of travel would therefore seem a logical point of consensus across the political spectrum. Though detailed prescriptions as to how this is to be achieved and with how much urgency will differ depending on political parties’ wider views about climate change mitigation.
My starting point for this essay is the following chart from the CCC’s 7th Carbon budget.
Here the CCC estimates of the cost to the UK economy of saving each tonne of CO2 that is required if the UK is to achieve its legislated goal of net zero by 2050. On the left of the chart – representing the best option for decarbonisation in economic terms - is a purple rectangle corresponding to the replacement of petrol and diesel cars and vans by electric vehicles. This block is below the line which indicates that the CCC expects there to be substantial economic savings from this part of a transition to net zero

On this basis the switch to electric vehicles appears to make economic as well as environmental sense. Is this true?
Analysis of the current lifetime costs to consumers of ownership for EV’s compared to the costs of petrol cars tells us something about the likely rate of adoption of the product, but very little about the long term economics;
· The tax treatments are different – mostly in favour of electric vehicles. In particular, fuel duty and VAT more than double the cost of petrol, and various subsidies and corporate tax allowances reduce the capital cost of EV’s.
· The manufacture of EV’s is still relatively new – and has not achieved the scale economies and efficiencies European manufacturers enjoy with petrol cars. Battery technology is developing fast and it is reasonable to expect significant further savings.
The current pricing of EV’s relative to petrol cars is based on demand curves distorted by taxes and subsidies and on an immature supply curve, and contains little information about the long term competitive advantage of either technology[2].
We have to dig deeper.
The CCC’s cost analysis in the 7th Carbon Budget strips out the effect of taxes and looks forward to a more mature EV industry. It estimates that total savings of £360bn over 25 years will arise from the decarbonisation of car transport[3]. The CCC expects £110bn of savings in ‘capex’ – because the cost of manufacturing electric vehicles will be lower than that for petrol and diesel cars - and £250bn savings in ‘opex’ – mainly because it will be cheaper to fuel cars with electricity rather than petrol. The average capital saving per car appears to be approximately £2000 per new car purchased from 2030 onwards[4]. The total £360bn saving is around 14% of the total we will spend on buying, fuelling and maintaining cars in the fleet over this period if the substantial taxation of motoring is ignored[5].
It is difficult to probe this analysis further because:
1) The operating savings presented by the CCC also include savings from reduced usage of cars due to other policies – eg improved public transport - and as far as I can see there is not enough information in the data provided by the CCC to disentangle this effect[6]
2) The electricity cost forecasts used by the CCC appear unreasonably optimistic in the light of more recent data – see https://kevinlangford1.substack.com/p/the-cost-of-net-zero-the-ccc-vs-the for analysis on this point.
3) The CCC estimates of manufacturing costs are mostly driven by a forecast from BNEF which is proprietary data
So I have looked mainly to other sources. I have taken the following approach.
1) I have used IEA data to estimate the costs of manufacturing a petrol car and an equivalent EV both now and as EV production and battery technology come to maturity.
2) I have divided these manufacturing costs by the respective average lifetime mileages of petrol cars – which we can observe – and of EV’s – where we have to make estimates given that the technology is both new and developing.
3) I have compared the fuel costs.
4) I have compared other operating and recurring costs; maintenance and insurance are the most significant if we exclude taxes.
5) I have considered other infrastructure costs to the extent to which these are not already internalised in the fuel costs. In practice this comes down to the cost of installing domestic charging equipment for those who have that option. The cost of the public charging infrastructure is internalised in the price of public charging in the same way that the cost of the network of filling stations is internalised in the ex-tax retail cost of fuel.
Manufacturing costs are commercially sensitive information and not widely available. This is a limitation of this part of the analysis.
I have based this section mainly on the IEA’s November 2025 analysis of the automotive market which pulls together information from the main proprietary and public sources of automative cost information[7]. The IEA compares the manufacturing costs of Chinese, European and US EV’s and petrol cars. The most useful information for my purposes is a comparison of the direct manufacturing costs of similar types of car[8] for petrol and EV’s across different geographies[9].
Key outputs are shown below.
IEA estimates of direct manufacturing costs for similar cars in China and in Europe[10]
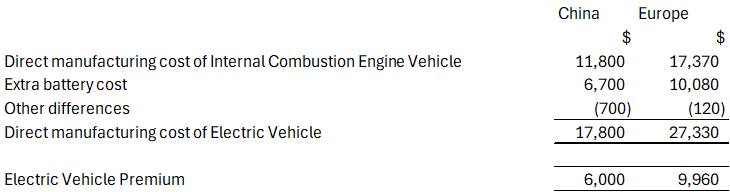
In each geography, EV’s are more expensive to build than the equivalent petrol engine car. The battery is a significant additional cost. There are savings of around $2000 on the electric drive train compared to a petrol model, but these are partly offset by higher costs across the rest of the car so the other differences in cost are currently quite small. Extra costs of electric compared to petrol are estimated at $6,000 (£4,600) per vehicle for vehicles manufactured in China, and nearly $10,000 (£7,700) for those manufactured in Europe. The cost of an EV manufactured in China is roughly the same as an equivalent petrol vehicle manufactured in Europe.
These estimates are for direct manufacturing costs and exclude the costs of administration, marketing, distribution, R&D, capital expenditure. The IEA cites no detailed data on these costs but estimates they contribute to a 50% uplift on manufacturing costs. For two competing mature car technologies one would expect most of these costs to be largely independent of whether a car is powered by petrol or electricity – eg there is no intrinsic reason why marketing an electric car should cost either more or less than a petrol one. As a practical matter – the lack of available data – I have ignored indirect costs for this analysis, and this also appears to be reasonable in the long term.
Western manufacturers have stated that they expect the costs of manufacturing EV’s to match those of petrol cars in the medium term[11] and the proprietary BNEF data used by the CCC and widely quoted elsewhere forecasts that it will in future be cheaper to manufacture an EV.
I have taken manufacturing cost parity as the central assumption for forecast EV costs in this paper, because I am not sure that this analysis provides enough evidence to challenge what the industry and other experts have been saying. However, at face value this IEA based analysis suggests that achieving parity will be quite difficult.
Significant further savings are widely expected on batteries – though no-one really knows how much. While technology is one driver, so too are both commodity prices and the balance of supply and demand across Chinese battery manufacturing. It is difficult to forecast both of these. Financial analysts’ reports suggest a further 30% saving on Chinese batteries is already in the pipeline for 2 years hence[12] but even a 50% reduction would not of itself close the current cost gap. European manufacturers expect to make savings from assembly once they are building in larger quantities and have gone through their own learning and may move to Chinese rather than more expensive Korean/ Japanese batteries[13] , but it is less clear what the opportunities for savings (other than for batteries) are in China where EV manufacturers are already operating at scale.. A 50% reduction in battery costs for European manufacturers and parity for non drive train elements between petrol and EV cars would still leave the manufacturing costs for EV’s approximately £2,000 higher than that for petrol cars in Europe.
Once taxes (particularly on fuel) are removed, the cost of manufacture is around 50% of the full life cost of a petrol car built in Europe and driven in the UK[14]; for an EV the proportion of capital cost is even higher. So the number of miles over which we can spread this manufacturing cost is an important variable.
A recent report from the Centre for Economic Performance[15] based on the full set of MOT data for cars registered between 2005 and 2017 estimates that the average petrol car driven in the UK completes 116,000 miles[16] . We can be less sure about EV’s because the technology is newer, and still developing. We don’t have empirical evidence as to how long today’s batteries will last under real road conditions.
There is evidence that batteries in cars produced in the 2000’s were lasting around 8-10 years[17], which would be considerably shorter than the average operating life of a petrol car. Manufacturer warranties on batteries are typically for 8 years and 100,000 miles – which sets a lower bound on their expected life, as manufacturers have obvious incentives to set standard warranty timeframes well within expected operating lives. 100,000 miles is not that much less than the average lifetime milage of a petrol car. Recent analysis of operational data from a large sample of EV’s estimates that EV batteries that are 8-12 years old are retaining 85% of their capacity[18] – so still operating effectively and showing a significant improvement on earlier models.
The Centre for Economic Performance analysis estimates that the lifetime milage from recently manufactured EV’s is likely to be similar – or maybe even higher - than petrol cars. The research is based on comparing a complete set of UK MOT data for different drive trains, and the point at which this shows cars to be taken off road or otherwise disposed of. The data includes cars registered between 2005 and 2017, and is based on MOT results up to 2022. It shows a steady increase in the average milage of BEV’s from around 85,000 miles (74% of average petrol milage) for vehicles registered in 2011 to parity with petrol vehicles for BEV’s registered in 2015 and 7% higher than petrol vehicles for the 2017 cohort. While these increases are likely to relate to improved battery ilves over time, the more recent figures – of necessity – require a higher degree of extrapolation from the rate of scrappage early in a cohort’s life cycle and therefore may be less reliable.
In summary;
· Older EV’s had somewhat shorter lives than petrol cars.
· More recent evidence suggests that the lives of EV’s being built now should be similar to petrol cars.
· But we do not know this for certain[19].
The average price of petrol over the last 30 months in the UK is £1.40[20] per litre. Exclude VAT (20%), and Road Fuel Duty (52.95p / litre) and the ex-tax cost is 64p/litre – or £2.90 per gallon. With petrol consumption of 44miles per gallon[21] this is a fuel cost per mile (excluding all taxes) of 6.6p. Taking average pre-tax petrol costs over the last 10 years (and adjusting prices for inflation) would give us 63p per litre and 6.5p per mile.
Estimating the cost per mile for an electric vehicle is much harder because:
· The network economics for electricity are more complicated than for petrol. The petrol supply network is largely dedicated to cars and the input cost of fuel is a high proportion of the cost. The electricity network supports multiple products and the input cost of generation is a smaller proportion of cost. So understanding when EV owners charge and how this relates to peak usage across different sections of the network is important.
· Both the components of the electricity network and the number of EV’s in use are changing much more quickly than the network for the supply and distribution of petrol.
· EV users charge in several different types of places – at home, at work, at the kerb, on motorways – all of which have different economics. And whether or not a car owner is able to charge at home has a much more significant impact on the cost of ownership than the location of the nearest convenient filling station.
The cost of supplying electricity for charging EV’s at home is lower than the average cost of electricity across the network. EV batteries can be charged off peak, and so may add relatively little to network costs and may also be able to utilise surplus output at times when lack of demand means renewables are not generating at full capacity. The benefits will be even greater for cars which are able to store electricity and supply it back to the grid when required (though this is not happening at any scale yet). But quantifying these benefits now (let alone as the system evolves) is difficult – and not something for which I can find good evidence[22]. The best assumption we can make for now is that tariffs aimed at EV users (such as Octopus Intelligent Go) are broadly cost reflective, and to base our analysis on these.
I have made a similar assumption in relation to on-the-go fast charging. Charging on a motorway or trunk road involves substantial additional costs due to the need to construct and maintain this network. I have assumed that current tariffs (once taxes are stripped out) reasonably reflect these costs.
The costs of street charging are worth studying in a bit more detail because inevitably, with relatively few EV’s in use, utilisation of this network is low. Excluding VAT (which is higher for street charging than it is for domestic) the current average cost is 25p/kwh higher than the blended rate that can be achieved through charging an EV mainly at home. I estimate that 20p/kwh is due to the capital costs of installing public chargepoints[23] with the remainder of the difference due to the costs of maintenance and administration partly offset by the ability of chargepoint operators to achieve lower commercial rates for electricity supply.
The utilisation of the UK network of street chargers was around 6%[24] in 2025 according to Zapmap. In the Netherlands – where 70% of car owners depend on public parking or public garages - there is a more heavily utilised network of street charging, and prices (ex tax) are approx. £0.07/kwh cheaper. With a 20p/kwh fixed capital cost, a 50% increase in UK utilisation would deliver something similar and I have used this as an estimate for a projected reduction in costs once the network is more mature and EV’s are much more widely owned[25].
The table below estimates the costs of fuelling a small electric SUV with real world performance of 4 miles per kwh based on current utilisation of infrastructure and estimated charging patterns for both those with access to domestic charging infrastructure and those without.
Assumptions in relation to current unit cost of electricity and cost per mile[26]
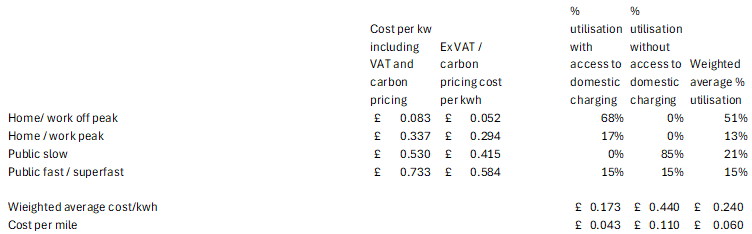
This gives an estimated fuel cost of 4.3p / mile for those with access to charging at home and 11p a mile for the 25% of cars that the RAC estimates are parked on the street overnight[27]. The weighted average cost is 6p – only a little cheaper than the cost per mile for petrol vehicles if taxes are excluded.
These costs are based on current electricity prices. There is considerable debate about the future trajectory of electricity costs. Both those who favour more decarbonisation, and those who want to stop this argue that their policy prescriptions would lead to cheaper electricity, while those of their opponents would increase it.
For the analysis of future costs of electric vehicles I have shown sensitivities for electricity prices both increasing and decreasing by 20%.
The other main operating costs for a car are servicing, insurance/repairs, and road tax (which, consistent with our approach, we will ignore).
The CCC uses survey data from service records to estimate the annual saving due to the simpler mechanics of an electric vehicle at about 30% - equivalent to just over £100 a year.
This probably does not include the costs of replacement of major parts for either petrol or electric vehicles[28]. Insurance analysts report that repairs of EV’s are typically more expensive than those of petrol and diesel cars – though the differential is reducing[29]. Current (July 2026) estimates of the insurance premium of EV’s over petrol vehicles range from £52(11% )(Money Supermarket) to £149 (27%) (HonestJohn) – though these figures will also reflect differentials in replacement cost (EV’s are currently mostly more expensive), and in product and driver mix across the universe of owners covered by each of these sources. The CCC assumes a small premium (around 1%) for the cost of insuring an EV[30] – though this seems very low in the context of this information; it seems more likely that the lower servicing cost that the CCC reports is currently offset by the higher cost of major repairs and therefore insurance. In the future this insurance differential should be expected to get smaller given the falling cost of batteries (see above) and improvements in battery reliability (see eg https://www.recurrentauto.com/research/how-long-do-ev-batteries-last).
One additional cost that does need to be taken into account is the cost of installing domestic chargepoints. As of 2026, the average cost (excluding any government grants and VAT) of installing an EV chargepoint is £920 – and, unlike the cost of the infrastructure for petrol refuelling or out of home charging, this is not captured in the cost of electricity. Owners who do not have access to offstreet parking do not have to bear this cost, but it is very quickly recovered through lower costs of charging.
The results of combining the cost estimates in the above text are summarised below
The first table shows my best estimates of the relative lifetime costs of a similar sized petrol and electric powered vehicle when all taxes are excluded today. Results are shown separately for cars which can be charged at home and those which do not have this facility available. I have compared the costs for Chinese manufactured EV’s to both Chinese manufactured petrol cars and European manufactured petrol cars, and have compared European manufactured EV’s to European manufactured petrol cars.
I have assumed for this table that the lifetime milage for an EV is the same as one for a petrol car – as this seems to be the best read of the evidence – but have looked at alternative views when I consider sensitivities below.

If taxes and subsidies are excluded, the lifetime cost of operating an EV manufactured in Europe is still significantly higher than the cost of an equivalent petrol car. I estimate that it is 14% higher for those who can charge at home and 31% for those who cannot.
The lifetime cost of owning and operating an EV manufactured in China is also higher than the cost of owning and operating a petrol car manufactured in China.
However, for those who can charge at home, Chinese EV’s already have a lifetime cost lower than European petrol cars, even if we remove from the calculation the substantial taxes on motoring fuel in the UK.
There is good evidence that the cost of manufacturing EV’s will come down. The next table shows projected costs of an EV compared to a petrol car assuming that future manufacturing costs are equal and so differences are entirely driven by operating costs (including where relevant the cost of installing a home charger). It also assumes a halving of the current insurance cost differential and that a more mature network of kerbside charging has greater utilisation leading to a reduction in kerbside charging costs to Dutch levels.

On this basis the majority of car owners who have access to domestic charging will see reductions in the lifetime cost of operating cars – ranging from 6% if we compare European EV’s to petrol cars also manufactured in Europe to 16% if we are comparing a Chinese EV to a European petrol car. But an EV may still be a more expensive option if one is dependent on public charging.
The following table shows how the comparison between EV’s and petrol cars manufactured in Europe changes as we vary some of the forward looking assumptions.
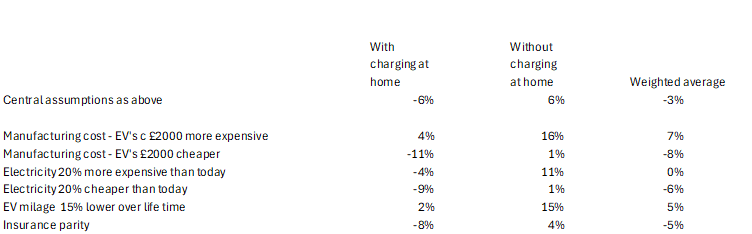
This gives us a range of a 11% saving to a 3% increase for those charging at home and a 1% increase to a 16% increase for those who do not have this facility.
The choice of variables within the range of reasonable assumptions across manufacturing costs and EV lifetime has a bigger impact on the outcome than the choice of variables in relation to ongoing operating costs.
Applying the same sensitivities to the comparison between Chinese EV’s and European petrol cars suggests a saving of 10% to 21% on the lifetime cost for those who can charge at home and a range between a 2% increase and a 10% saving for those who cannot.
The focus of this essay has been on the UK. In many other countries the relative economics of EV’s are likely to be better. Electricity in the UK is expensive in global terms[31]. And the bigger scope for ‘sunbelt’ countries to reduce costs through wider adoption of solar plus short term batteries means that this differential is unlikely to reduce substantially.
So the relative economics of EV’s compared to combustion vehicles are likely to be better in many places than in the UK and, if anything, to further improve. A 20% reduction in car owners’ electricity prices improves the economics of an EV by around 4% over its lifetime across the mix of users.
This does not matter directly to UK consumers but is one reason why the UK’s export oriented motoring industry has been keen on tooling up to produce EV’s.
This essay focuses on the ex-tax costs of EV’s compared to petrol cars now and in the future.
It focuses on one particular type of car – a small SUV - though it is reasonable to think that this is representative. It uses only publicly available information – so will be inferior to any analysis by those with detailed access to the cost structures of major manufacturers.
It does not consider several other questions which are important to policy choices in relation to the strategy for private motoring in the UK:
· Do EV’s reduce emissions once the manufacturing process is taken into account? [Yes, substantially[32]].
· How do policy decisions in relation to what cars people drive in the UK affect the UK’s manufacturing industry? [The industry supports a transition to EV’s, but doesn’t want to have to subsidise it, and cares most about what its export customers do and how tariff barriers affect its supply chains[33]] .
· How do EV’s compare to petrol cars as a consumer proposition given their lower range and longer recharging times? [Depends on how the car is used, but still inferior for many users, particularly those who cannot charge at home. But improving quite rapidly].
· Do EV’s benefit urban air quality? [Yes – substantial evidence for this, notwithstanding some remaining particulate pollution].
At present, the life time cost of EV’s manufactured in Europe is only competitive with petrol vehicles because of various tax advantages; strip these out and EV’s are still significantly more expensive. Chinese EV’s are already competitive even without tax advantages.
We can reasonably expect this to change, and while it is hard to be completely certain, European EV’s will likely have a lower lifetime cost than European petrol cars in the long run.
A transition to EV’s in the UK probably makes sense economically as well as environmentally; indeed, if we refer back to the CCC’s own analysis of the costs of decarbonisation sector by sector, it has by far the best economics of any major sector for decarbonisation[34].
This is important if we look at what polling evidence tells us about the public’s view on mitigating climate change (our government should be doing something about it) and paying for it (we shouldn’t be paying very much).
So while there is obviously room for debate about how quickly the UK should electrify its domestic car fleet, and what measures should be taken to promote this, it would seem logical that there was a policy consensus about the overall goal of replacing petrol and diesel cars with electric vehicles.
[1] In the interest of brevity I have restricted this essay to cars (rather than vans, trucks, 2 wheelers etc) and to a comparison between pure battery vehicles and petrol cars (thus ignoring both diesels and hybrids). The numerical analysis is based on a small SUV, following the analysis of manufacturing costs from the IEA which is a key source.
[2] In case you are nonetheless interested in this statistic, BNEF estimates that in the UK in 2025, the EV premia vs petrol cars for small, medium, large cars and SUVS were respectively 18%, 20% minus 2% and 18%
[3] 7th Carbon budget table 7.1.5
[4] Around 2.5m new cars purchased a year from 2030, £109bn saving. My calculation assumes that the CCC sees no difference in the average life of an electric vehicle compared to a petrol/diesel vehicle; I cannot find any information from the CCC on this point, but it seems reasonable to assume that they would have said if this was a factor in their calculation
[5] Estimated lifetime cost of purchase, fuel, maintenance and insurance of a petrol car – excluding taxes – of £41,000. (It would be much higher if one included fuel duty and VAT). Approx 61m new cars 2026-2030 assuming as the CCC does, that the market recovers to pre-pandemic levels. £360bn saving per CCC.
[6] This is not intended as a criticism. The CCC is not purporting to evaluate the savings specifically from replacing petrol cars by electric cars. This is just one set of detailed data within its analysis of the overall costs of decarbonising the UK economy. While there are several parts of the CCC’s analysis which I disagree with, I am not intending to criticise it for something it is not trying to do
[7] IEA What next for the Global Car Industry, updated November 2025 – mainly chapter 4. The principal sources for their cost analysis are ICCT, BNEF, UBS and S&P Global Mobility. The more important charts from the analysis are available online and the relevant figures can be read directly off these. However for some of the information I have used I have had to estimate figures from charts in the pdf version.
[8] The IEA compares a small petrol SUV with 80kw output to a small electric SUV with a 75kwh battery and 150kw drivetrain. It does not specify exactly which cars it is comparing and nothing seems to fit their description exactly; we might be looking at a Skoda Kamiq, a Peugeot 2008, a VW ID4 or a Kia Niro.
[9] The IEA report also compares the average cost of all EV’s produced in to the average cost of all EV’s produced in China but this is less helpful because the European EV’s on average have higher specifications. Other parts of the report cover the average prices of EV’s sold rather than costs.
[10] Total direct manufacturing costs are derived from online version of Figure 4.4 in the report, and crosschecked to the commentary in the text. Components of the differential are based on figure 4.3 and again cross checked to the text.
[11] E.g https://insideevs.com/news/670052/ev-price-parity-after-2030-ford-ceo-jim-farley/ from Ford, https://www.drive-electric.co.uk/news/renault-aims-to-reach-price-parity/ from Renault
[12] Eg https://marketintelo.com/report/affordable-sub-30k-mass-market-battery-electric-vehicles-market#collapse_2688374 downloaded 14 July 2026
[13] There are many factors here – as the choice is between different battery technologies as well as source of supply
[14] This may surprise many UK motorists. This is (1) because fuel duty and vehicle excise duty significantly increase operating costs and (2) because most motorists use second hand cars and so incur a much lower capital cost
[15] Centre for Economic Performance Jan 2024 Estimating the longevity of electric vehicles; what do 300 million MOT test results tell us? V Nguyen-Tien, R J R Elliott, E Strobl, Chengyu Zang
[16] This is also consistent with other reports eg https://www.car.co.uk/scrap-car-report estimates 118,000 miles, though this also includes diesels which tend to last longer
[17] Skeete, Jean-Paul, Peter Wells, Xue Dong, Oliver Heidrich, and Gavin Harper. 2020. Beyond the EVent horizon: Battery waste, recycling, and sustainability in the United Kingdom electric vehicle transition. Energy Research & Social Science 69: 101581 includes reference to a range of pre 2020 articles that come to this conclusion. Though the estimates it quotes are only for calender lives rather than for mileages.
[18] 2026 data from Generational, a battery diagnostics specialist from 8000 vehicles
[19] I have also considered evidence in relation to the rate at which EV’s are currently depreciating. At present EV’s lose their value more rapidly than petrol cars in the early part of their lives. Arguably this provides some market based information about longevity. However obsolescence in a technology which is still developing rapidly is such a big factor that it is hard to draw firm conclusions here. Big swings in the prices of 2nd hand Tesla’s are driven by decisions made about the pricing and specs of new ones. Second hand markets for are also less well developed than those for petrol vehicles.
[20] Source. 2024 £1.42, 2025, £1.35, 2026 to end June, £1.45
[21] Based on real world MPG for small petrol SUV’s from Honest John Database.
[22] It is particularly hard to evaluate the impact of EV’s on network and distribution costs. Some parts of the network will become cheaper on a unit basis as under-utilised assets are spread over more output. In other areas, the requirement will trigger significant capital spend.
[23] Frontier Economics/ Systra’s evaluation of tranche 1 of the Local Electric Vehicle Infrastructure (LEVI) fund in March 2025 states that the fund contributed £3,523 per public chargepoint and that this comprised 31%of the funding, suggesting a private sector contribution of £7,841 per chargepoint. This includes a small number (2% of the base) of very expensive rapid charge points, and the figures are probably also skewed upwards by the subsidy being more focussed on more difficult to access projects. Other bottom up estimates from a range of sources pulled together through Chat GPT gave an estimated capital cost of £5,800 / chargepoint. Some of the cost (civils, permitting) relates to assets which will have a very long life, but some items (eg electronics) might be expected to require more frequent replacement, particularly given that they are in a public rather than private environment. Using a 30 year life for the longer components, an 8 year life for shorter life components, an effective output of 6kw per hour and current average utilisations per Green Finance Institute / Zapmap (Demystifying utilisation May 2026 update) this gives a capital cost of 14p /kwh before taking account of a return on capital. Adding a cost of capital of (say) 6% real and assuming that income is phased regularly over the average lifetime, we get to an estimate of 20p/kwh for the capital elements at current utilisation.
[24] Green Finance Institute / Zapmap Demystifying Utilisation May 2026 update. I have used the figures for when 3-7.9kw chargers are actually providing energy over the course of 2025 – though if all public AC charging is included, the utilisation is reduced to around 4%. If one includes all time when the chargers are plugged in (as opposed to charging the utilisation) utilisation figures are 9% and 7% respectively.
[25] Urban utilisation of street charging in Netherlands appears to be around twice current utilisation in the UK based on statistics from ElaadNl. Doubling the amount of electricity across which the 20p capital and (say) 5p fixed costs is spread would actually lead to a cost reduction of 13p compared to the 7p ex tax difference. There will be many other factors affecting the pricing in both jurisdictions and there may be other reasons why the Dutch density is not fully achievable here.
[26] Prices based on Zapmap data from June 2025 to June 2026. In this period, VAT is charged at 5% on domestic electricity and 20% on public charging. Impact of carbon pricing estimated at 2.7p/kwh over this period. Mix of utilisation from Zapmap and Roland Berger. The split of the mix between those with and without charging is inevitably very stylised
[27] https://www.racfoundation.org/motoring-faqs/mobility#a5 Qn6. Some cars which are parked on the street may have access to offstreet parking, and some cars which use offstreet parking may nonetheless not be able to access overnight domestic charging. But this seems a reasonable proxy for the split.
[28] The CCC has not provided any further details of its source – so I cannot be completely sure of this
[29] Eg Thatcham Research submission to Transport Select Committee January 2026. https://committees.parliament.uk/writtenevidence/162156/pdf/ This reports that EV repair costs were 25% more expensive than battery repairs in 2023 though also cites another source that since 2023, EV repair costs have fallen 11% - on which basis the premium would have reduced to 13% if the costs of petrol repairs have not changed.
[30] 7th Carbon Budget methodology report p163
[31] UK ex tax petrol prices are very similar to other members of the G7 apart from the US and Canada. Compared to the US and Canada UK petrol is more expensive, but the difference between UK/US ex tax petrol prices is smaller than the ex-tax electricity price differential.
[32] I estimate that given the current emissions intensity of UK electricity, around 75% of current territorial emissions from cars (c60MTCO2e per year) would be saved by full electrification of the car fleet. Outside the UK there would be a much smaller increase in the emissions due to the manufacture of batteries, but this is more than offset by the emissions saved from parts of the oil supply chain which fall outside UK territory and emissions statistics. See ICCT (2025) Life-cycle greenhouse gas emissions from passenger cars in the European Union. I have adjusted the ICCT figures to reflect the actual intensity of UK emissions from electricity rather than the forecast emissions from EU electricity that are used in the ICCT analysis.
[33] See eg EG https://smmtweb.lon1.cdn.digitaloceanspaces.com/wp-content/uploads/2026/03/Same-Destination-Smarter-Route-SMMT-Electrified-report.pdf for recent lobbying material setting out the industry’s position. Note (a) that less than a quarter of cars manufactured in the UK are sold in the UK, and (b) how intertwined the UK manufacturing supply chain is with Europe
[34] The other two significant sectors where the CCC’s chart suggests there are significant savings from decarbonisation are aviation and electricity; see https://kevinlangford1.substack.com/p/the-cost-of-net-zero-the-ccc-vs-the for why this seems unlikely to be true for either sector.
No posts
Comments
Nothing yet. Say the first thing.
Sign in to join the conversation.