
I recently took on an exciting challenge from Succinct Labs to optimize their RISC-V emulator. What started as a simple performance improvement task turned into a deep dive into systems optimization, profiling, and understanding the subtle art of making code run fast.
§ The Challenge
Succinct Labs created a challenge to improve their RISC-V emulator performance. Their emulator processes about 2 million instructions per second, and they wanted it faster. Much faster.
The setup is straightforward:
[Input Buffer] → [RSP Program] → [RISC-V Emulator] → [Output Hash]Think of it like this:
- RSP Program: A recipe (program written for RISC-V)
- Input Buffer: The ingredients (data the program needs)
- RISC-V Emulator: A kitchen that follows RISC-V recipes
The benchmark runs the emulator 5 times, measures performance in MHz MHz here means millions of RISC-V instructions per second, not the CPU clock rate (millions of operations per second), and verifies correctness by checking output hashes.
§ My Starting Point
On my modest setup, I was getting pretty poor performance:
===== BENCHMARK RESULTS =====
Runs: 5
Average elapsed: 25.2662 seconds
Average MHz: 2.22
My setup:
- OS: Pop!_OS 22.04 LTS
- CPU: Intel i5-3210M (4 cores)
- Memory: ~5.8 GB RAM
For comparison, Succinct’s AWS m7i.8xlarge instance achieved 9.35 MHz, which became my target to beat.
§ Finding the Bottlenecks
Instead of blindly optimizing, I profiled the code using cargo instruments to understand where the time was actually going.
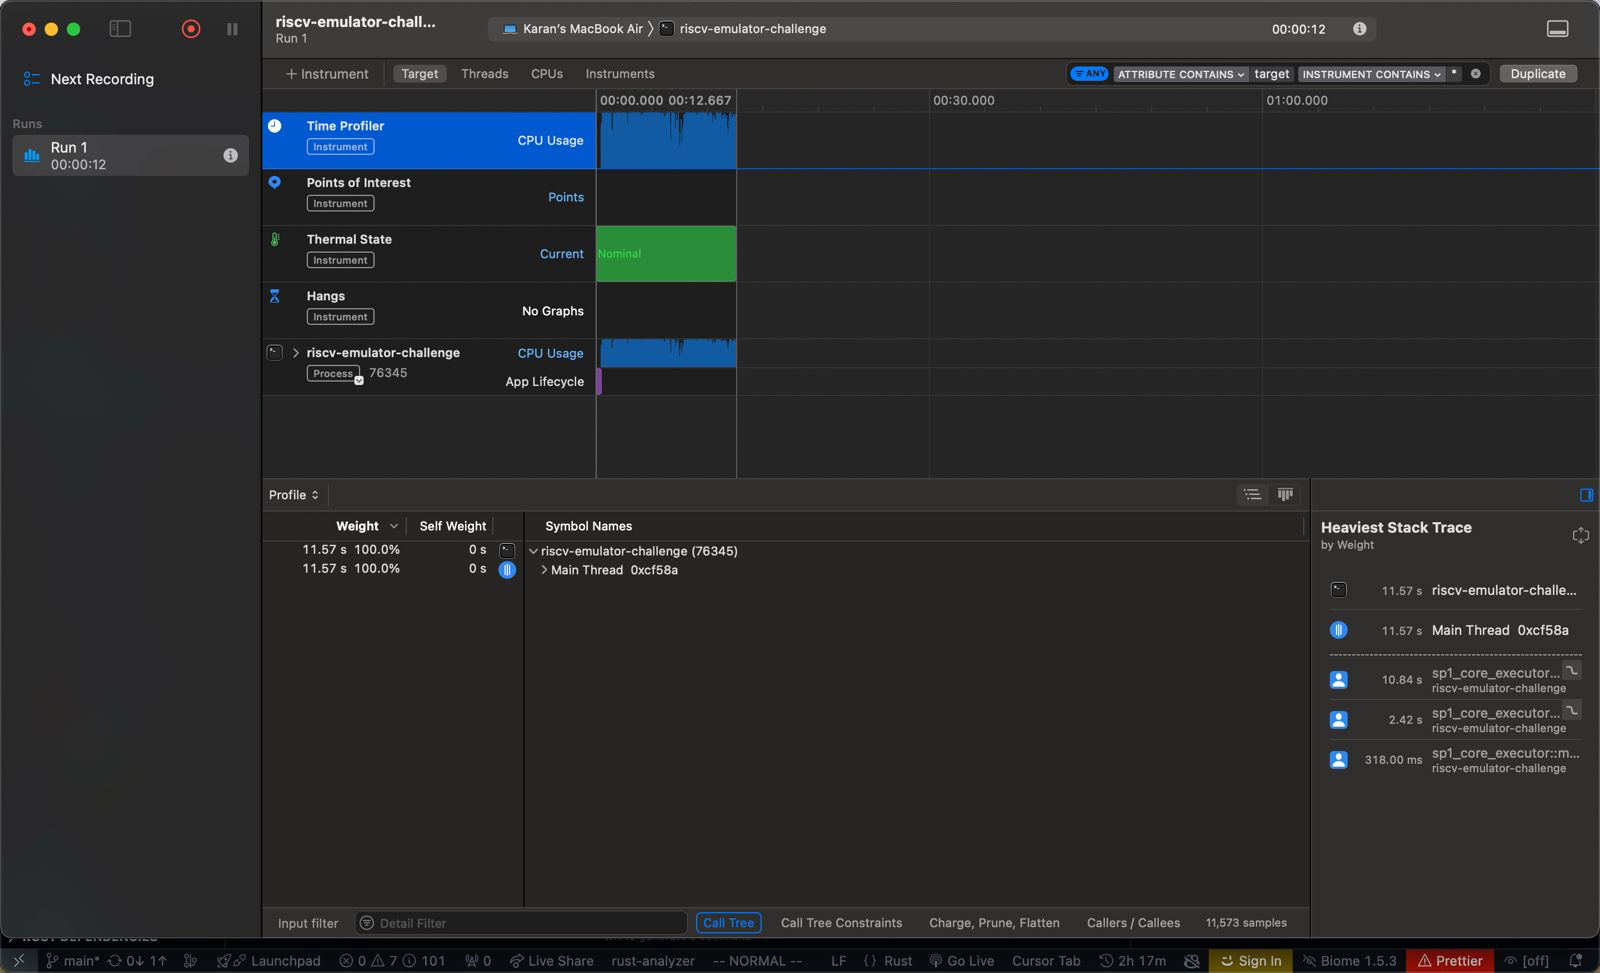
The profiler revealed the real culprits:
Time    % of Total   Function
2.42 s   21.2%      Memory write operations (mw)
1.65 s   14.4%      Load register-register (load_rr)
1.39 s   12.2%      ALU register-register (alu_rr)
1.34 s   11.8%      Store register-register (store_rr)
Nearly 60% of execution time was spent on these four operations, with memory writes being the biggest bottleneck. Now I had clear targets for optimization.
§ Optimization #1: Faster Address Translation
The original address translation function was checking an assertion on every memory access:
fn translate_addr(addr: u32) -> u32 {
    assert!(addr >= 0x10000);  // This runs every single time!
    (addr - 0x10000) >> 2
}
In a tight loop processing millions of instructions, this assertion was expensive. Here’s my optimized version:
#[inline(always)]
fn translate_addr(addr: u32) -> u32 {
    // Fast path for registers
    if addr < 32 {
        return addr;
    }
    // Only check assertion in debug builds
    #[cfg(debug_assertions)]
    assert!(addr >= 0x10000);
    (addr - 0x10000) >> 2
}
Key improvements:
- Added fast path for register addresses
- Moved assertion behind debug flag
- Inlined the function to eliminate call overhead
§ Optimization #2: Smarter Register Access
The register access code had redundant array indexing:
// Before: accessing the same array index multiple times
if self.registers[addr as usize].is_some() {
    return MemEntry::Occupied(MemOccupied::Register(
        self.registers[addr as usize].as_mut().unwrap(),
    ));
}
return MemEntry::Vacant(MemVacant::Register(&mut self.registers[addr as usize]));
I simplified this to cache the reference:
// After: get the reference once, use it multiple times
if addr < 32 {
    let reg = &mut self.registers[addr as usize];
    return if reg.is_some() {
        MemEntry::Occupied(MemOccupied::Register(reg.as_mut().unwrap()))
    } else {
        MemEntry::Vacant(MemVacant::Register(reg))
    };
}
This reduces redundant array accesses and is more branch-predictor friendly.
§ Optimization #3: The HashMap Problem
With memory writes taking 21.2% of execution time, I suspected the HashMap was the bottleneck. I tried several approaches:
§ Custom Hasher (Didn’t Use)
I wrote a custom MurmurHash-based hasher to replace the default SipHash:
struct MemoryHasher { state: u64 }

impl std::hash::Hasher for MemoryHasher {
    fn finish(&self) -> u64 { self.state }
    fn write(&mut self, bytes: &[u8]) {
        let key = u32::from_ne_bytes(bytes.try_into().expect("u32 keys only"));
        let mut h = key as u64;
        h ^= h >> 33;
        h *= 0xff51afd7ed558ccd; // MurmurHash magic numbers
        h ^= h >> 33;
        h *= 0xc4ceb9fe1a85ec53;
        h ^= h >> 33;
        self.state = h;
    }
}
While faster than SipHash (10-15 cycles vs 50-100), it was still slower than no hashing at all. This led me to a better idea.
§ No-Hash Hasher (Epic Fail)
I tried BuildNoHashHasher thinking sequential addresses would work well:
type MemoryHasher = BuildNoHashHasher<u32>;Results: 13x slower! Hash collisions were destroying performance.
§ Optimization #4: Vec-Based Memory (The Winner!)
Instead of optimizing the HashMap, I replaced it entirely with a Vec:
// Before: HashMap with hashing overhead
pub struct MemoryMap<V> {
    pub registers: [Option<V>; 32],
    memory: HashMap<u32, V, BuildMemoryHasher>,
}

// After: Direct indexing with Vec
pub struct MemoryMap<V: Clone> {
    pub registers: [Option<V>; 32],
    memory: Vec<Option<V>>,
}
Why this works for RISC-V:
- Memory addresses translate to perfect sequential indices
- Pre-allocate 4MiB (matches typical program needs)
- Zero hashing overhead
- Better cache locality
- Direct O(1) array access
pub fn new() -> Self {
    Self::with_capacity(1 << 20) // 1,048,576 entries = 4MiB
}
The Vec automatically resizes for larger programs while maintaining performance for typical cases.
§ Optimization #5: Register Caching
Register access was still taking 14.4% of execution time. I added a register cache:
pub struct Executor<'a> {
    // ... other fields ...
    register_cache: [Option<u32>; 32],
    register_dirty: [bool; 32],
}
§ Fast Register Reads
#[inline(always)]
pub fn rr(&mut self, register: Register, position: MemoryAccessPosition) -> u32 {
    let reg_idx = register as usize;

    // Fast path: check cache first
    if let Some(value) = self.register_cache[reg_idx] {
        return value;
    }

    // Slow path: load from memory map
    // ... fallback code ...
}
§ Smart Register Writes
#[inline(always)]
pub fn rw(&mut self, register: Register, value: u32) {
    // Fast path for x0 (always zero in RISC-V)
    if register == Register::X0 {
        return;
    }

    let reg_idx = register as usize;
    self.register_cache[reg_idx] = Some(value);
    self.register_dirty[reg_idx] = true;

    // Defer memory map updates until checkpoint
    if self.executor_mode == ExecutorMode::Checkpoint {
        self.flush_register(register);
    } else {
        self.mw_cpu(register as u32, value, MemoryAccessPosition::A);
    }
}
Benefits:
- Most register reads become simple array access
- Deferred writes reduce memory map operations
- Special handling for x0 register
- Dirty tracking for selective flushing
§ The Results
These optimizations transformed the emulator’s performance by targeting the actual bottlenecks rather than guessing. The combination of:
- Eliminating hashing overhead (Vec instead of HashMap)
- Caching frequent operations (register cache)
- Reducing function call overhead (inlining)
- Optimizing hot paths (fast register access)
Created a significantly faster emulator while maintaining correctness.
§ Future Ideas
For even more performance, I considered:
Inter-Shard Caching: Cache hot instruction metadata across the 2M-cycle shards that make up a full program execution.
Global Caching: Store compiled instruction blocks across multiple benchmark runs, essentially JIT compilation for repeated programs.
These optimizations show overhead might not pay off for single runs, but could provide 20-30% improvements for repeated execution of the same programs.
§ Key Lessons
- Profile first: Don’t guess where the bottlenecks are
- Question assumptions: Sometimes the best optimization is avoiding work entirely (Vec vs HashMap)
- Understand your data: RISC-V’s sequential memory access patterns made Vec perfect
- Cache hot paths: Register access is frequent enough to justify caching
- Measure everything: Even “obvious” optimizations can backfire
The most important lesson? When every cycle counts, sometimes the best hash function is no hash function at all.
Subscribe for future posts
Comments
Nothing yet. Say the first thing.
Sign in to join the conversation.