
The DoD is in charge of the DMED (Defense Medical Epidemiology Database) data
The DMED data is analyzed and published every year in the MSMR (Medical Surveillance Monthly Report) journal
Comparing historical DMED numbers against different MSMR publications, clearly show the historical numbers have been revised multiple times across several publications, namely, in the 2020, 2021 and 2022 editions
The magnitude of the revisions are significant and unprecedented (and are made without any explanation, which is extremely troubling for such important data)
These revisions affect the validity of the numbers presented by Teresa Long and Thomas Renz at the first “Senator Johnson” hearing (24th of January 2022)
Even though these numbers are exaggerated, there is still a clear signal the vaccines have had a negative impact on ambulatory visits
It is hard to establish the precise magnitude of this signal because the DMED data has been tampered with repeatedly
Mathew Crawford’s (who has extensively studied and covered this topic in depth) contentions are:
The importance of being precise and accurate
Truth over sensationalism
The role of the DoD in the whole vaccination development, campaign, propaganda and manipulation of data, is much bigger than any DMED vaccine injury signal (!)
No one was interested in helping Mathew write FOIAs to investigate this matter further and get to the truth. (To make matters worse, Mathew has been let down and mislead by several people who told him they would help.)
No one seems interested in investigating Unissant, who are responsible for administering and managing the database.
No one seems interested in “setting the record straight” concerning the erroneous percentages used at the first “Senator Johnson” hearing.
Point 3) about the DoD’s involvement in manipulating the data is the crux.
As Dennis pointed out:
The real point here is the fact the DMED data cannot be trusted is a scandal on its own. Full stop. It's like we're going after Capone for tax fraud and we're stepping over dead bodies to get to his receipts.
Back in March of 2022, when Mathew started publishing his findings, no one was talking about the the DoD’s involvement in both the vaccine development and the vaccine rollout.
Back then, this was a major breakthrough… but it got no traction.
Since then, Dr. Peter McCullough, and Sacha Latypova have also come to similar independent conclusions concerning the DoD’s involvement:
The Covid Jabs are a US Military Operation Using Big Pharma as Marketing Shield
INTENT TO HARM - EVIDENCE OF THE CONSPIRACY TO COMMIT MASS MURDER BY THE US DOD, HHS, PHARMA CARTEL
The role of the US DoD (and their co-investors) in "covid countermeasures" enterprise
RTE Discussions #16: Examining DoD Involvement in the Pandemic (w/ Sasha Latypova) (Mathew Crawford interviews Sasha)
Breaking! New documents show the cover-up is even WORSE than we thought | Redacted News Live (Start at 38:20 onwards)
Here is an excellent 13 min clip that captures Sacha’s most salient points
"The Pentagon controlled the COVID-19 program from the very beginning and everything we were told was political theater to cover it up right down to the FDA vaccine approval"
Here are the links to all the official MSMR publications.
We will compare the “Ambulatory Visits” numbers between different publication years. Namely:
May 2018
May 2019
May 2020
May 2021
June 2022
The “Ambulatory Visits” report typically contains a table as well as plot, which provides some context for the current year’s number with respect to previous years.
For example, this is the table found in the May 2018 report:

(Notice: The May 2018 publication officially reports on the new 2017 numbers, and also contains historical numbers for 2015 and 2013.)
The plot found in the May 2018 publication looks like this:
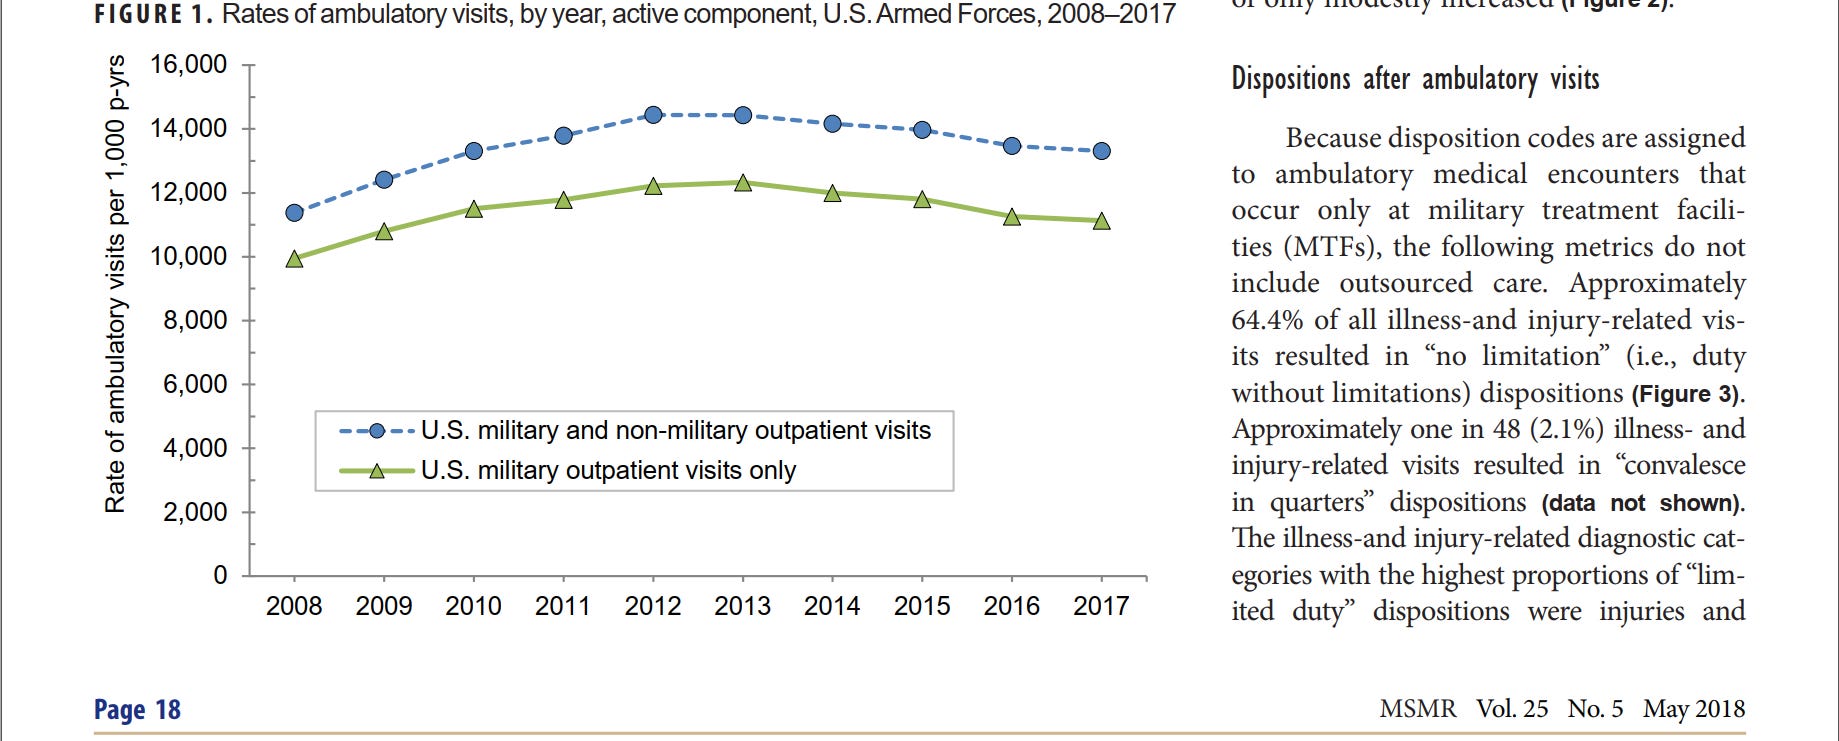
(Notice: Unlike the table, the plot contains all the historical data for the previous 10 years. Numbers can be deduced from these figures if needed.)
We will now publish the “Ambulatory Visits” plot for each publication from 2019 to 2022.
(Note: We will include a page footer in every screenshot in order to identify the MSMR edition.)
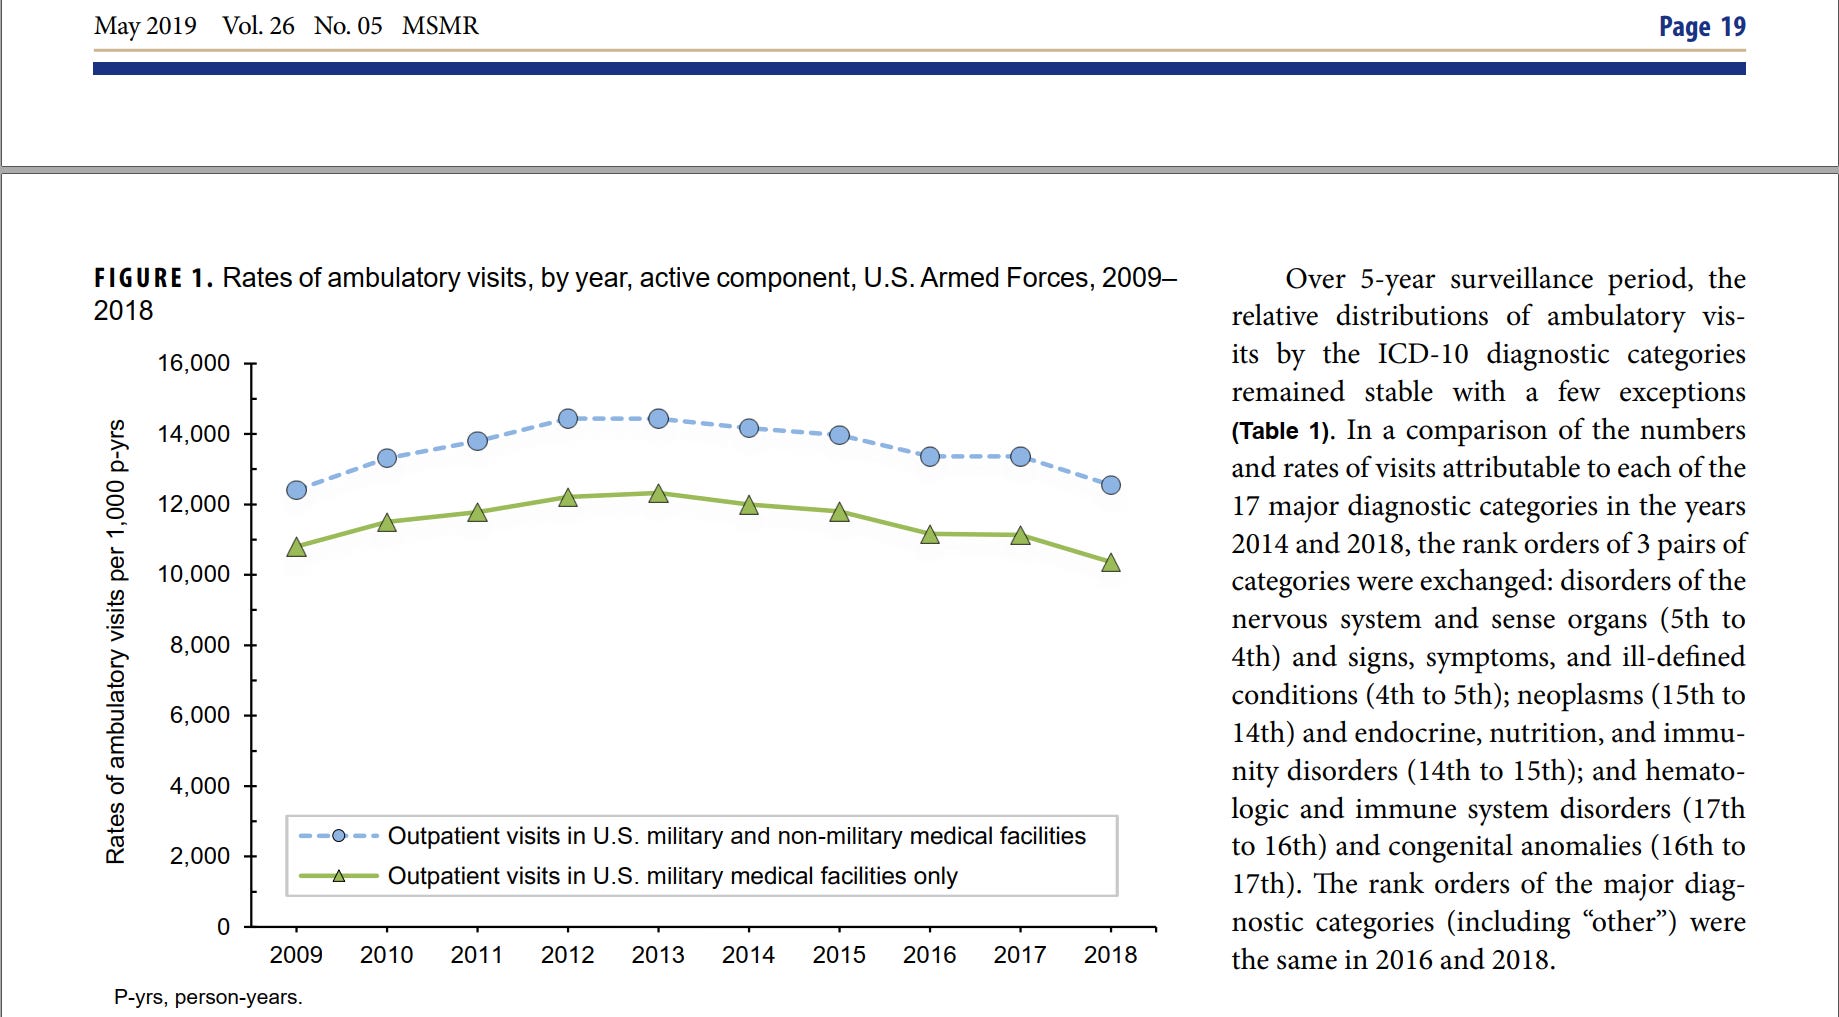
Notice: Prior to 2019, the historical numbers used in the “Ambulatory Visits” plots, hardly changed between publications.
In 2019, the number used for 2016 changed from 14,867 to 13,366. (It is hard to tell from the screenshot, but it will be more obvious in the summary plot found at the end of this section.)
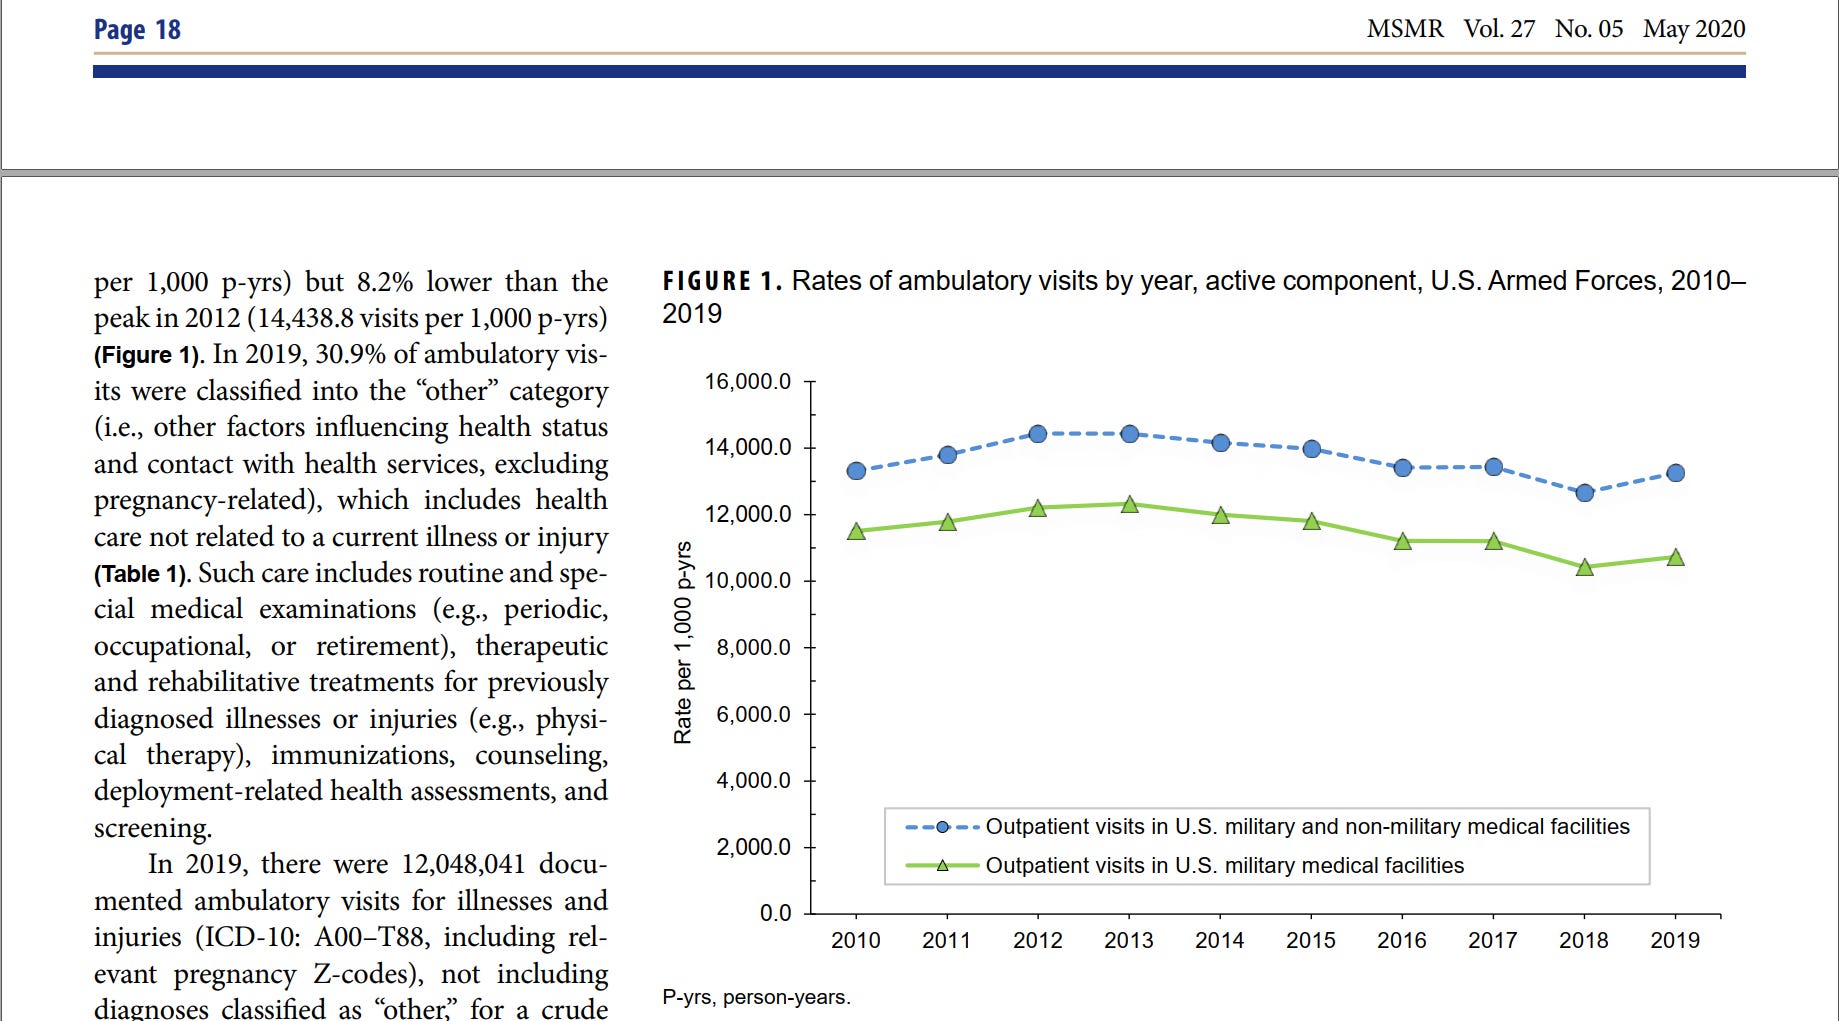
In 2020, the historical numbers hardly changed from the previous 2019 report.
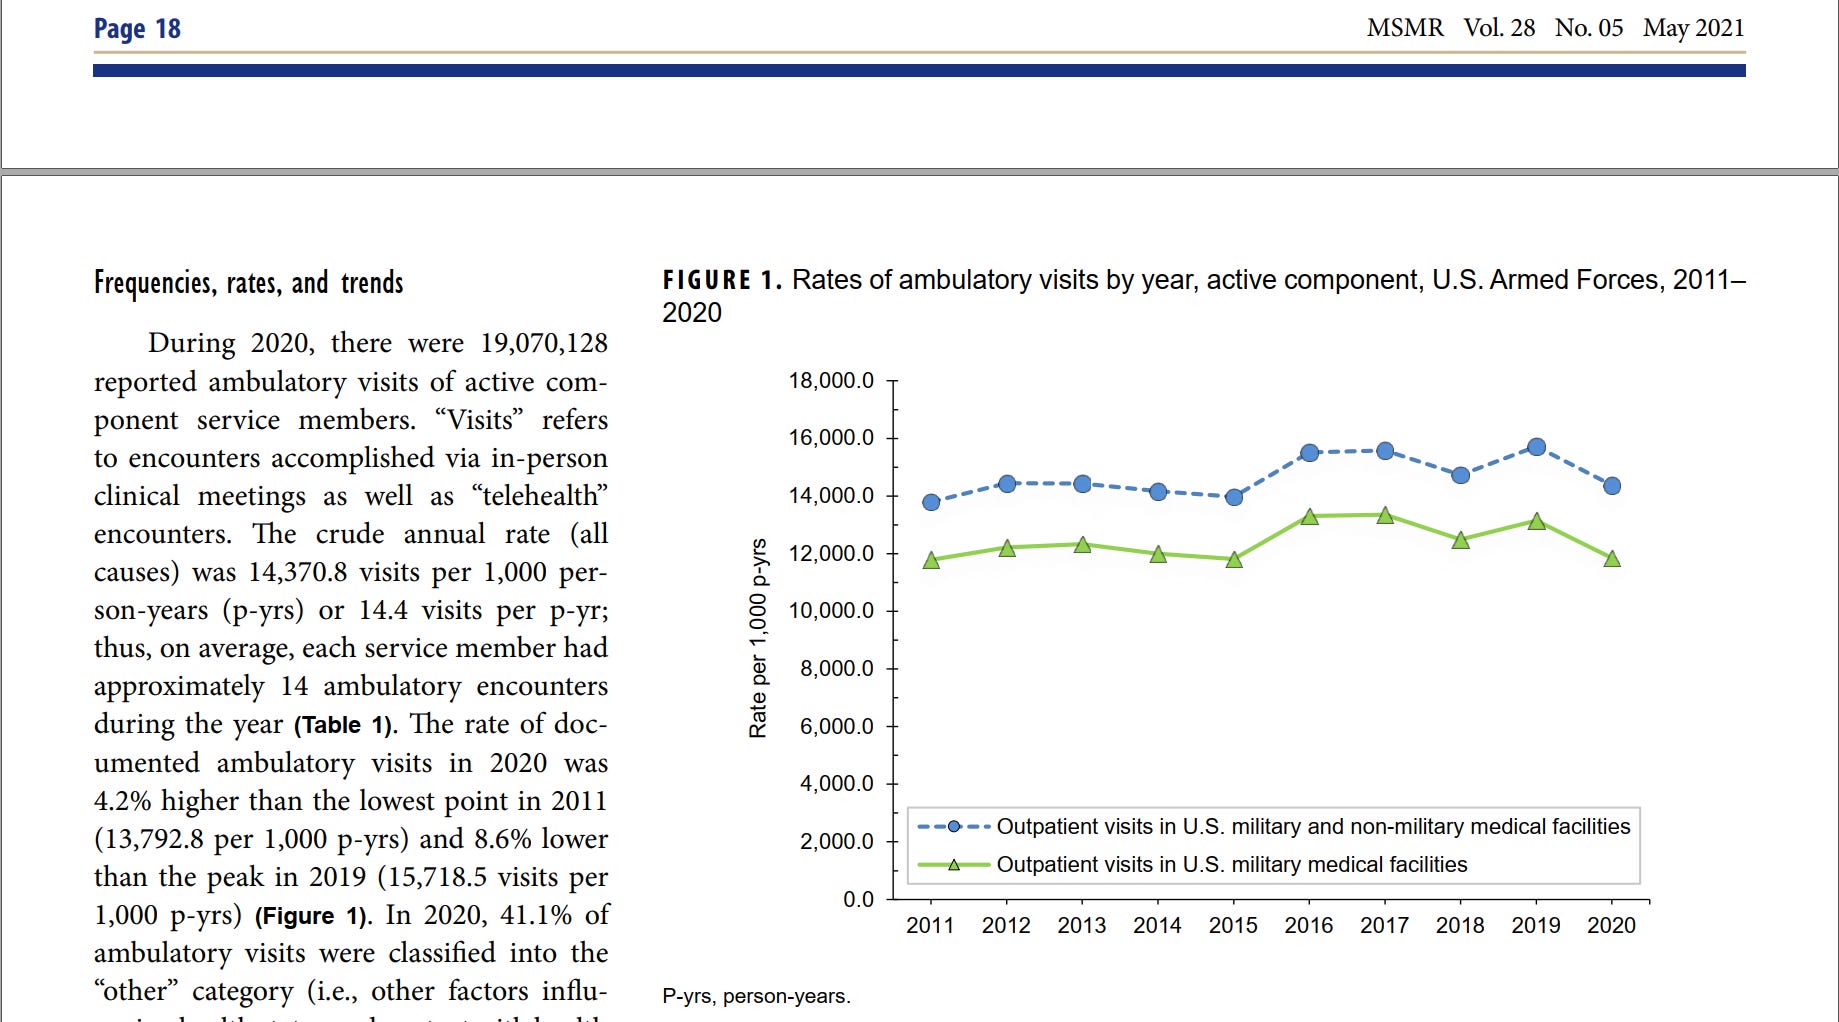
The historical numbers from 2016 onwards were significantly altered.
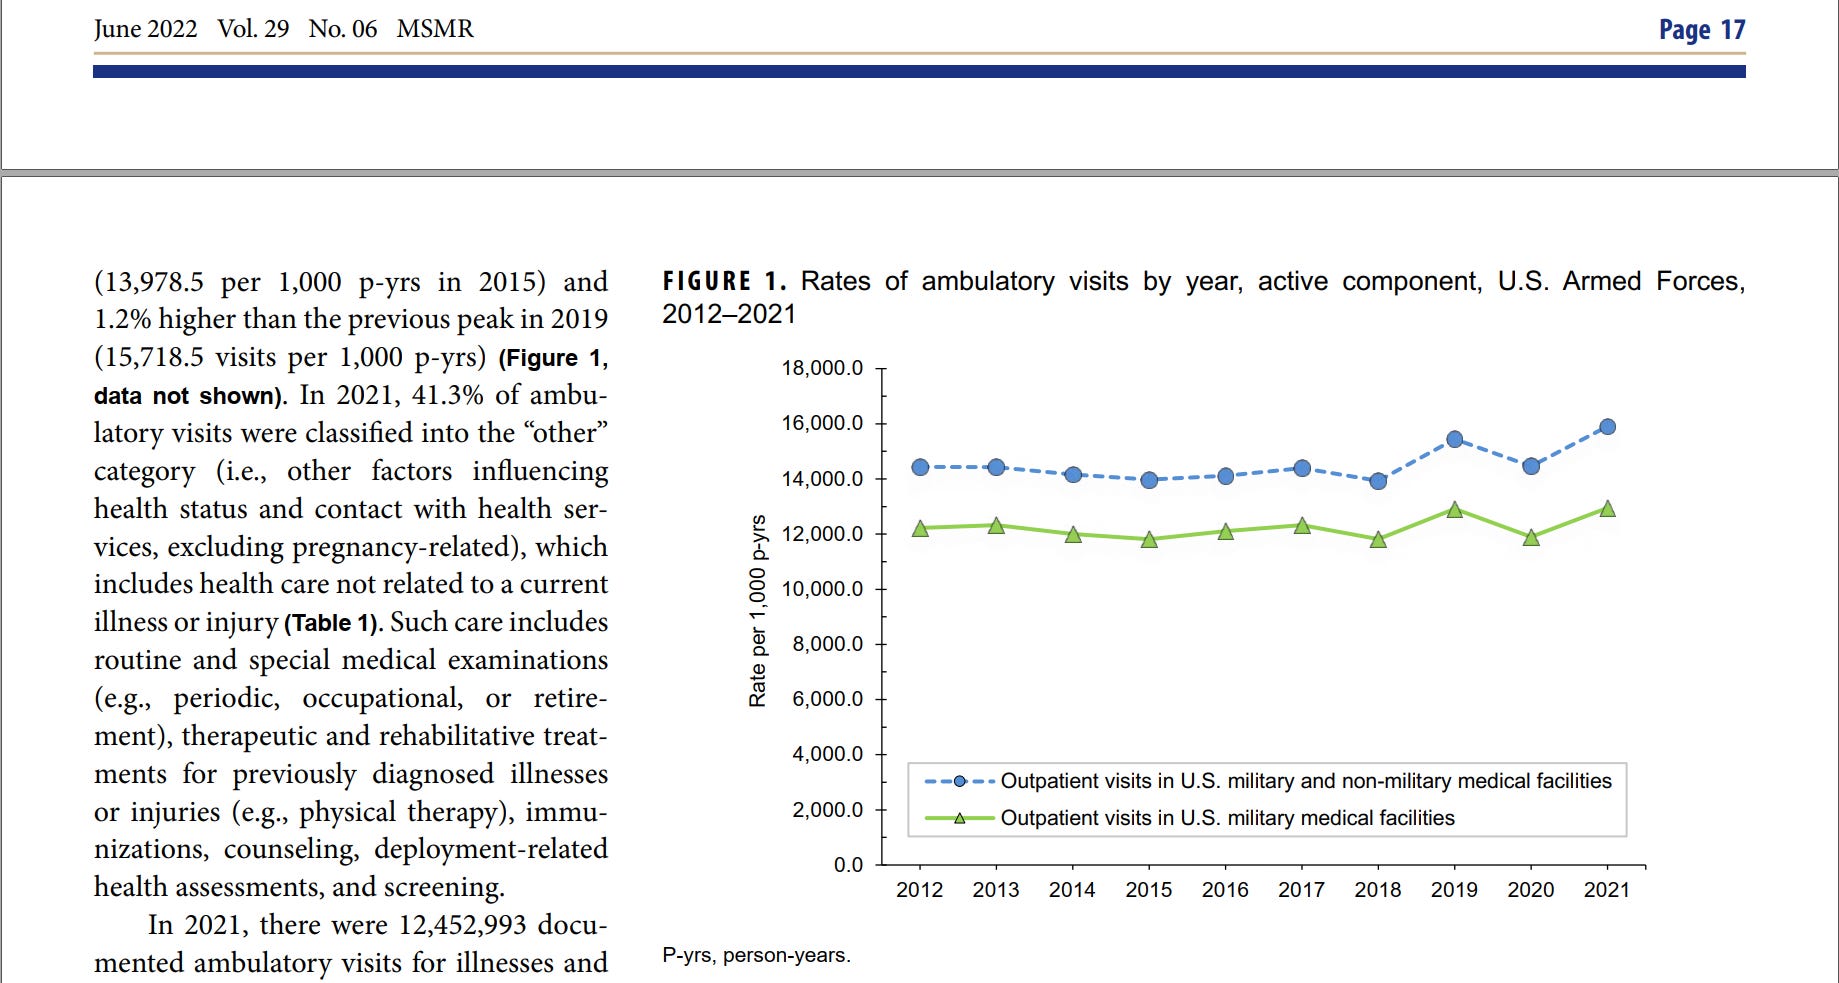
The historical numbers from 2016 onwards were again significantly altered.
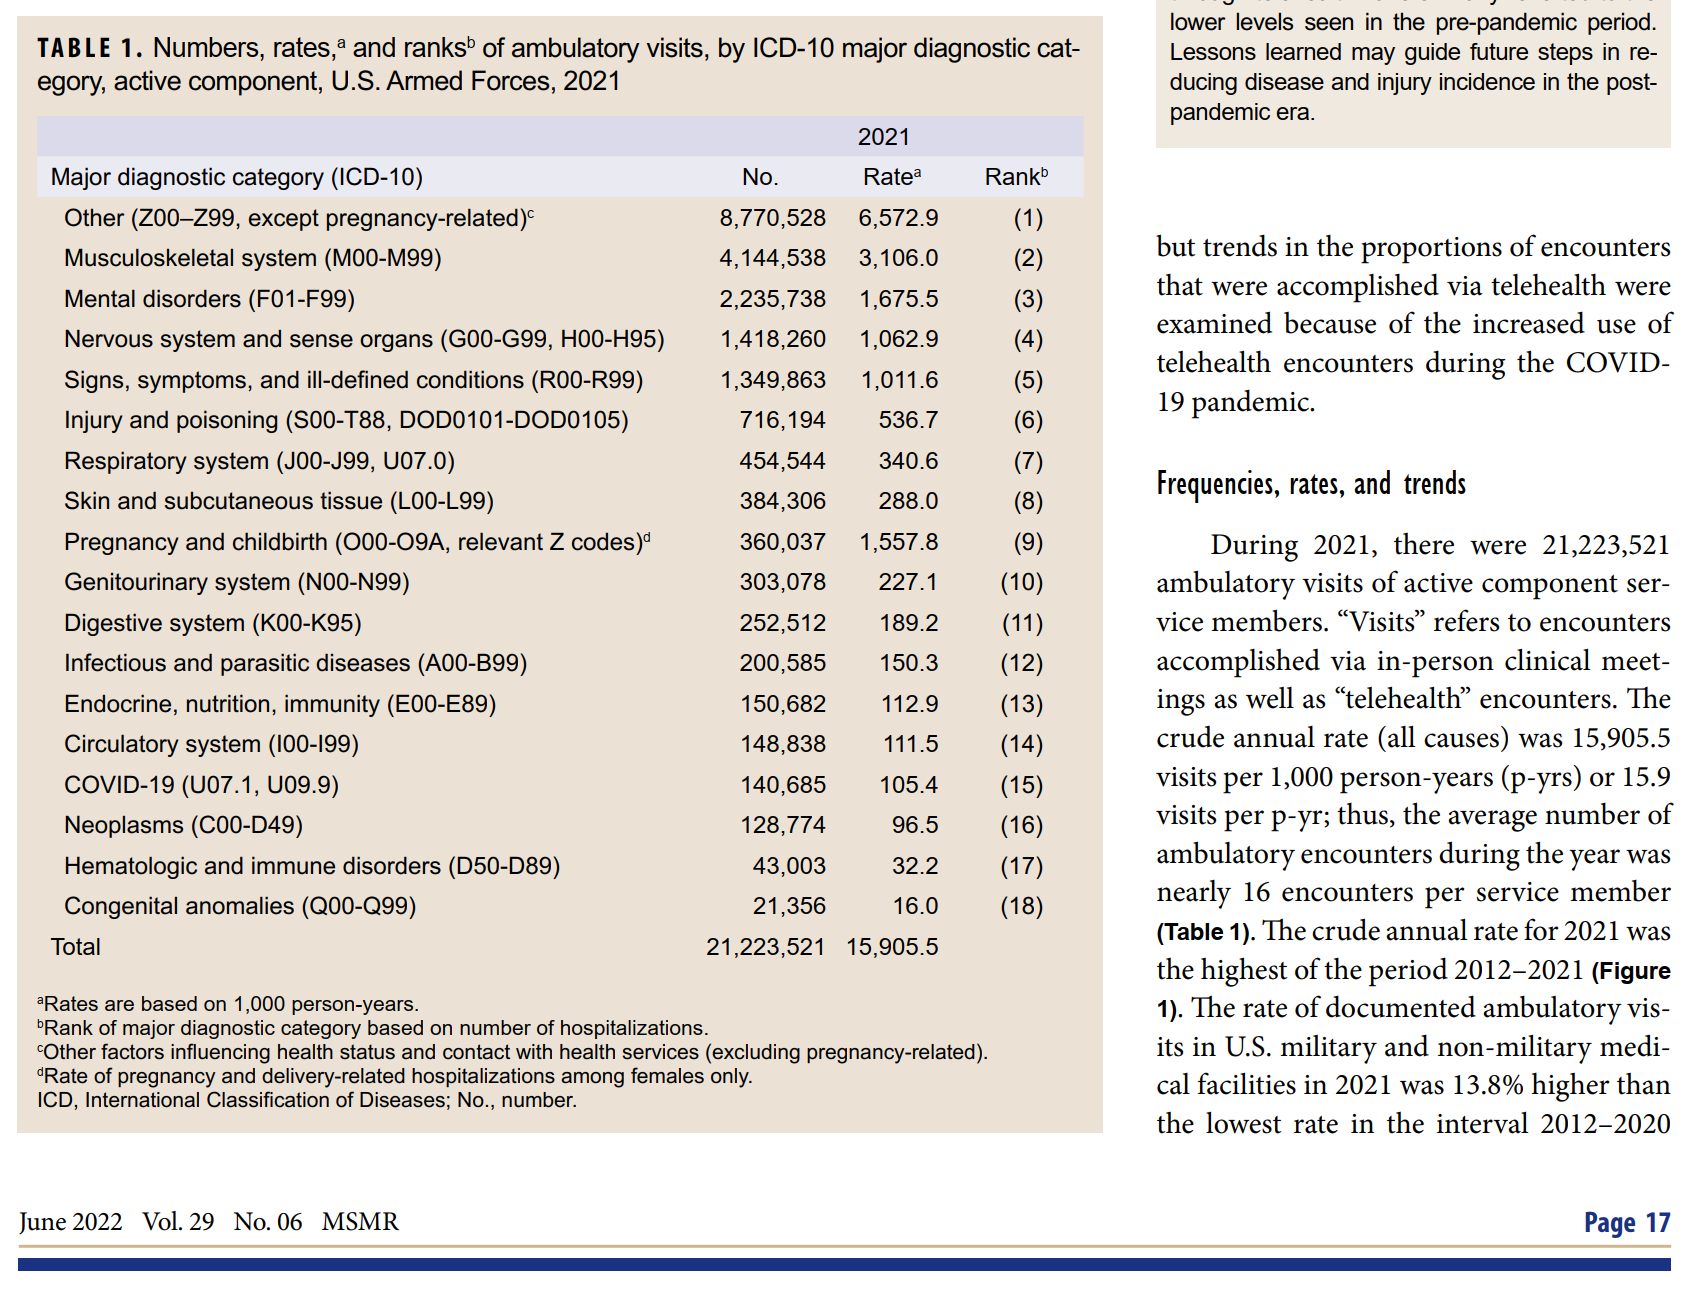
Notice: The “Ambulatory Visits” report was published in the 2022 “June” edition. Historically speaking this report is published in the “May” edition. (Why did they need an extra month to finalize their data?)
Also, the table data found on page 17, typically contained 2 previous years worth of numbers, however the 2022 table (conveniently) only contains the 2021 numbers, and no previous years, so we can’t compare the numbers in this table with previous publications… (however, we were able to “estimate” the values from the figure.)
The following plot makes it more obvious what changed between publications. (Prior to 2019 the historical numbers hardly changed between publications.)
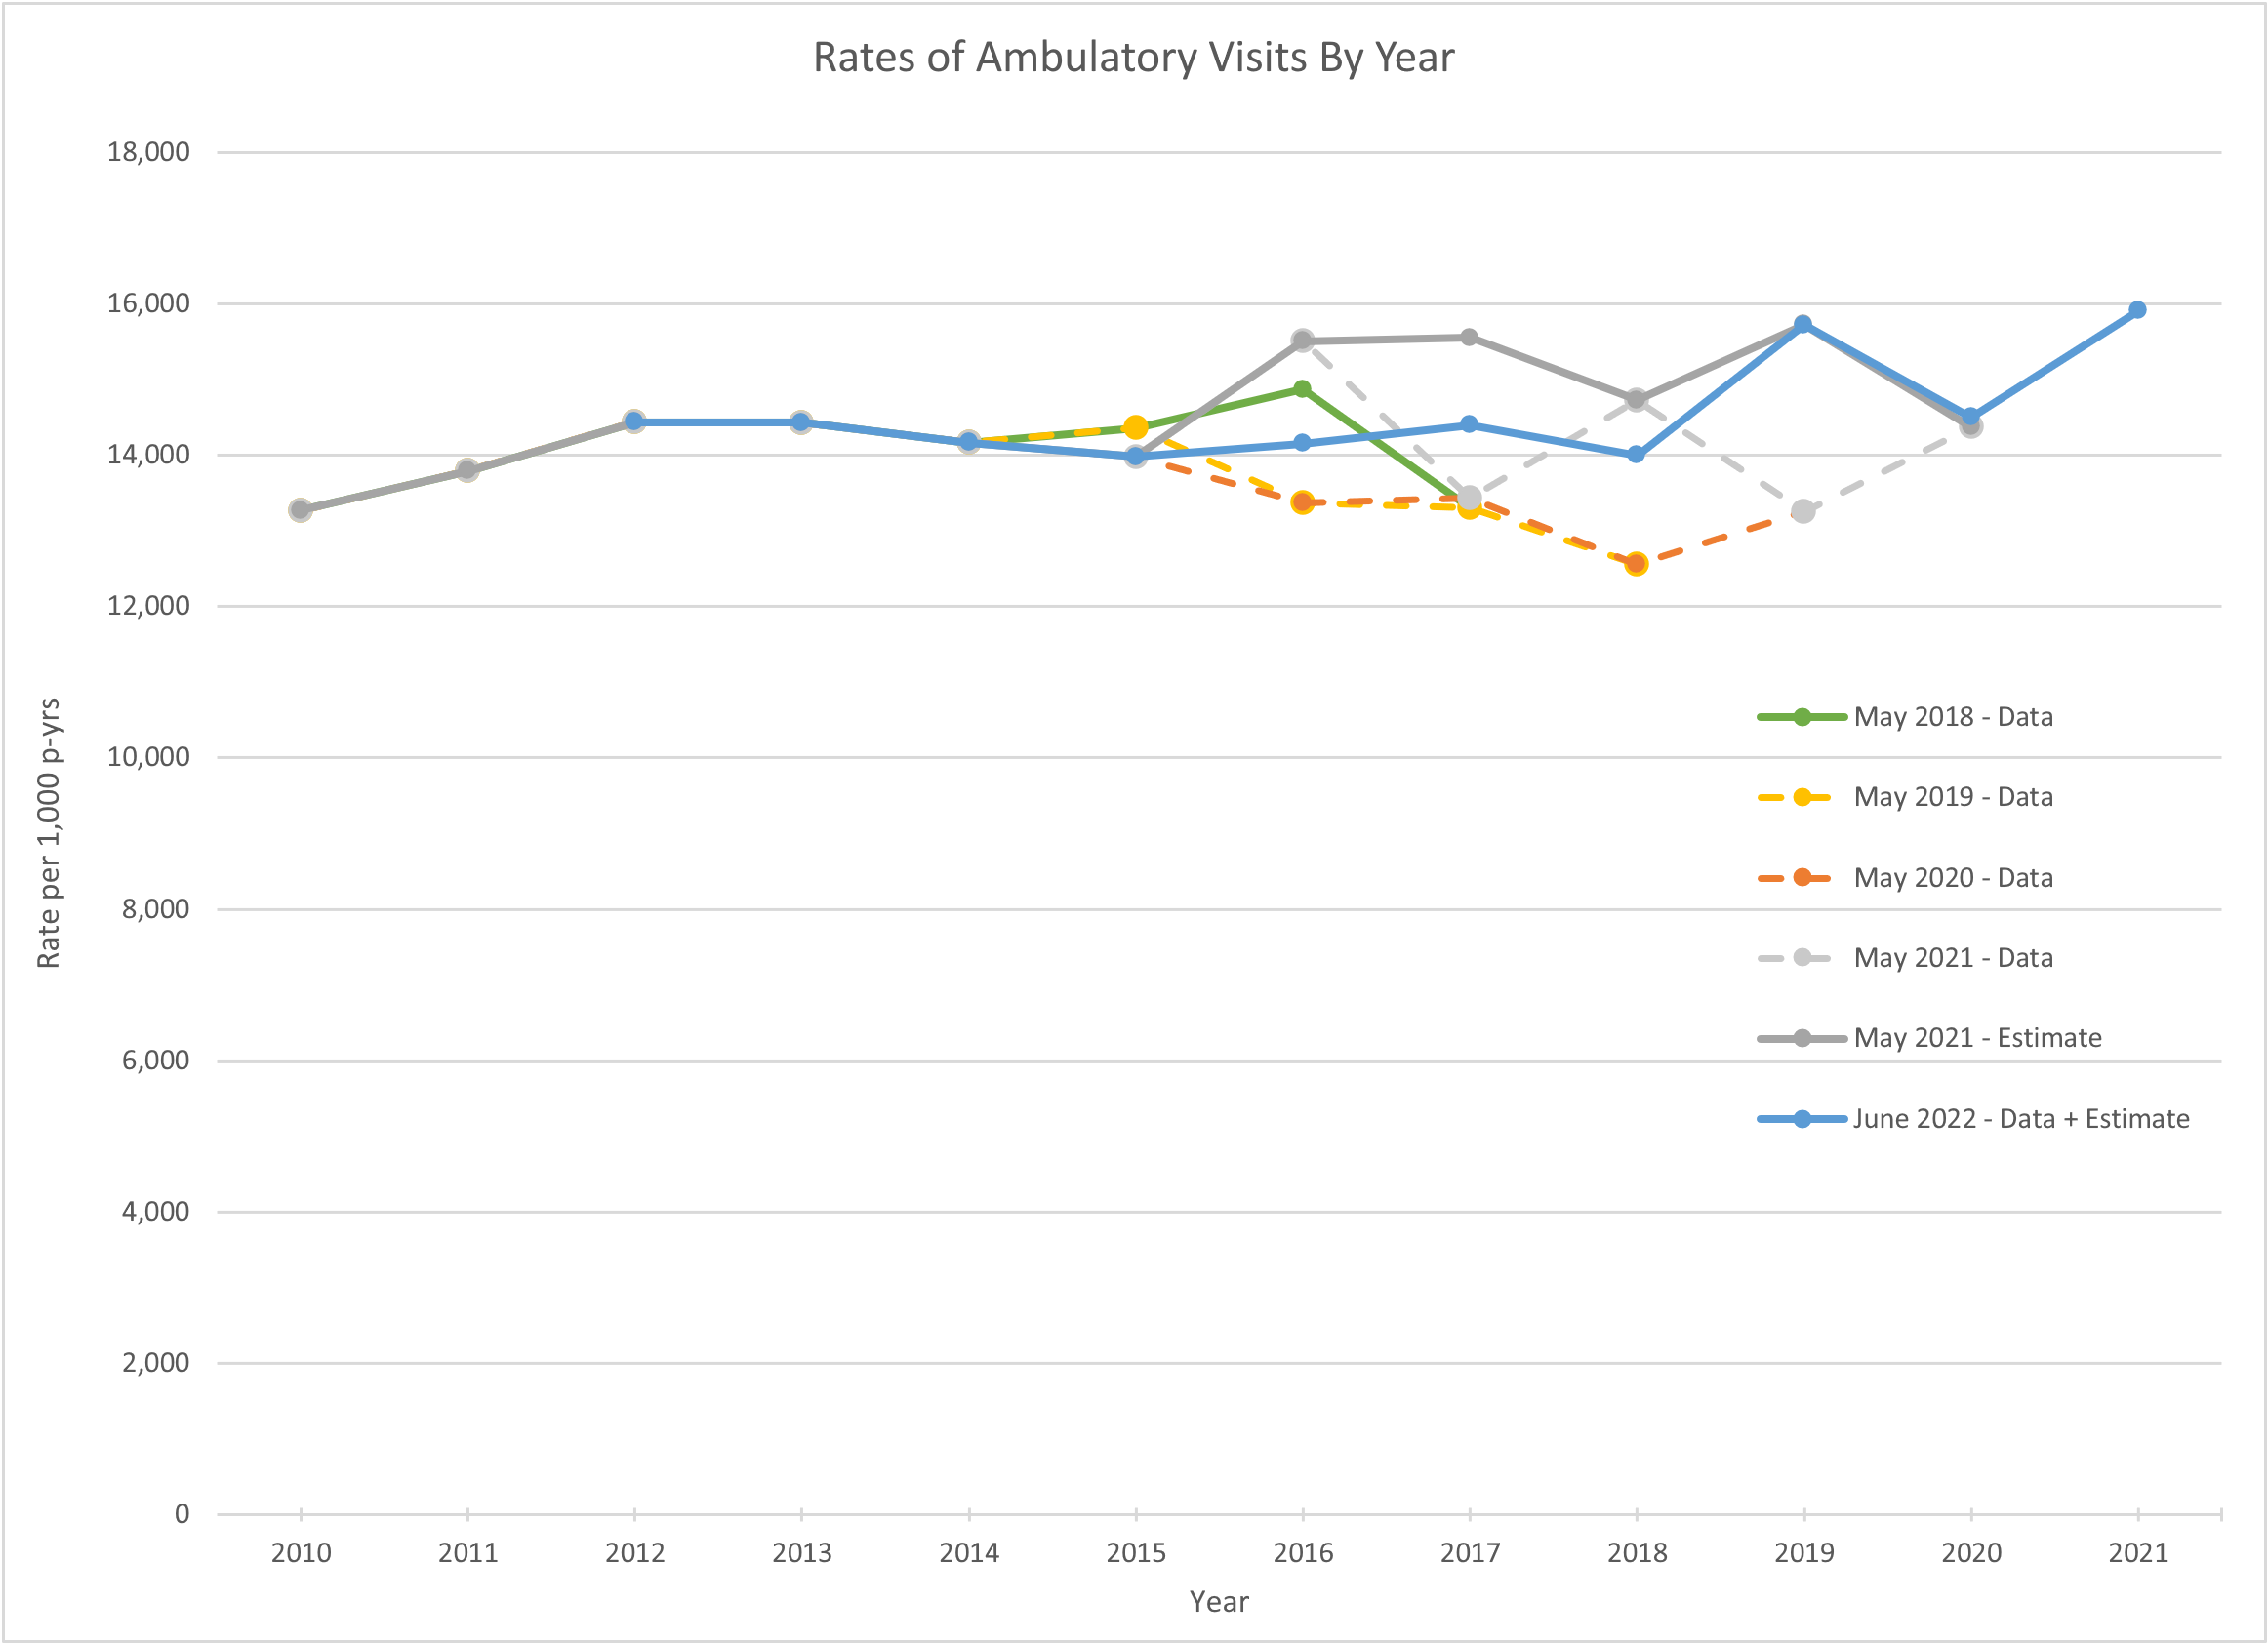
All the data points for the May 2018 plot were taken from the data tables published in previous MSRM editions. Up until 2019 the historical values never changed much between publications. We went all the way back to 2011
The historical numbers for 2016, 2017, 2018 and 2019 have been dramatically revised between publications after 2019
Some of the values for the “Estimate” plots (i.e. May 2021 and June 2022) are derived from the MSMR figures. (i.e. The associated table has missing years, which we deduced from the figures)
Apart from the “database glitch”, telemedicine has also been put forward as an explanation for the recent increase in visits. This does not explain why the historical numbers for 2016, 2017, 2018 and 2019 have been altered uniformly. The values have also risen and then fallen between publications. The latest values for 2016, 2017 and 2018 for the “June 2022” values, are now in the middle of the previous extremes. (??)
All the values for 2016 through to 2019 for the “May 2021 - Estimate” were revised downwards in the “June 2022” publication… except for 2019. Why?
What happened in 2019? (If the data has any meaning at all.)
A database glitch, which really doesn’t make a whole lot of sense
Regardless, it has been announced that the whole DMED database will soon be disbanded and will be replaced with a whole new system… (Again, this is very convenient).
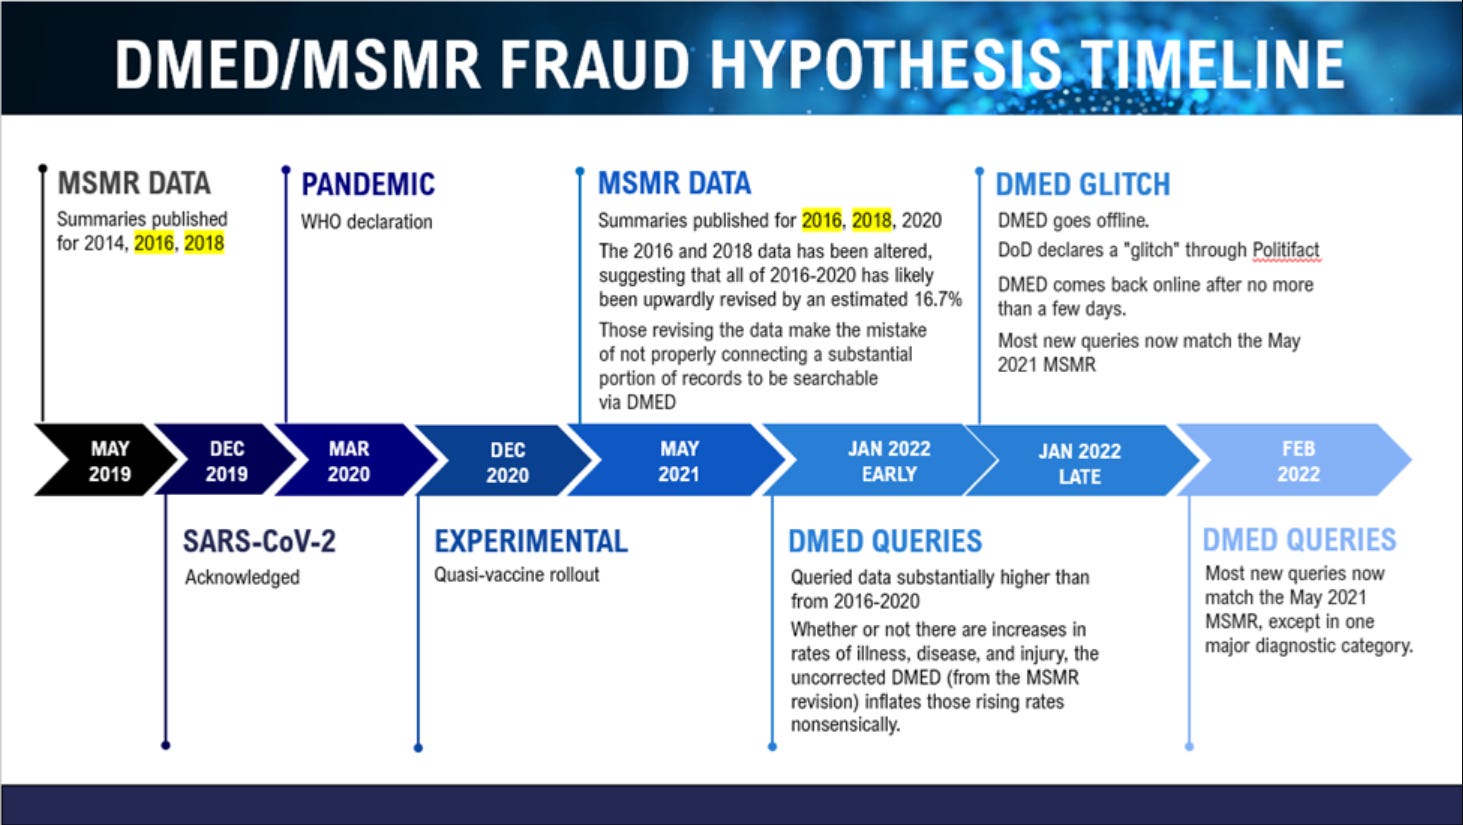
This timeline is taken from one of Mathew’s DMED articles, and is very useful to position the major events.
This article in only an introduction into the unexplained data alteration for “ambulatory visits” within the DMED database, that have occurred since 2019.
It clearly shows the historical numbers for ambulatory visits have been dramatically altered in every publication since 2019, with no acknowledgement or explanation.
It also confirms the DMED data is unreliable, which is a huge problem in and of itself.
This is extremely troubling considering the DMED data is critical in monitoring and assessing the overall health and “readiness to deploy” for the US military.
For those who are interested in finding out more, Mathew Crawford’s DMED articles cover this topic in great detail.
Check the May publication for 2018 to 2021
Check the June publication for 2022
No posts
Comments
Nothing yet. Say the first thing.
Sign in to join the conversation.