
By Dean Rovang
Staying Curious · justdean.substack.com · ORCID 0009-0006-1351-5320
Since May I have been posting figures that put deep time, the modern record, and the projections on one pair of axes. They have lived here, which is fine for reading and useless for citing. So I wrote the whole thing up properly and put it on the ESS Open Archive, where it now has a DOI and can be referenced like any other paper.
The modern departure from Earth’s temperature–CO₂ relationship
It is technical. Six figures, six tables, and the fits documented in a way I have not done here: the three regressions with their standard errors, a robustness test that splits each ice-age record in half to check that the slope does not depend on which part you use, and an honest accounting of what the numbers do and do not constrain.
The projections are in it. Four published runs — two from CLIMBER-X to the year 3000, two from the CMIP7 scenario set to 2500 — plotted on the same axes as the paleoclimate record and the observations. They are the only model output in the paper, and the paper says so plainly. Where each one turns is set mainly by the emissions it assumes — though not entirely. The two CLIMBER-X runs use the same scenario and differ only in climate sensitivity, and the more sensitive one still peaks 29 ppm higher and fourteen years later, because a warmer ocean and biosphere hold less carbon and the same emissions leave more of it in the air. Sensitivity moves the trajectory sideways as well as up.
What is not in it is my own emulator. The return legs I have shown here, the ones that carry the trajectory past 2500 and back toward the band, come from a simple carbon-cycle and energy-balance model I built to answer a question the published runs stop short of. It is the weakest thing I have made. Nothing in this paper depends on it, so I left it out entirely rather than have the one unpublished component draw attention away from four published ones. It will get its own write-up, with its limitations set out properly, or it will not get one at all.
Two things in it will be new even if you have followed every essay.
The first is the log axes. Every figure appears twice, once against CO₂ and once against log CO₂. On the log version the paleoclimate relationship is a straight line, because that is the variable it was fitted against, and the modern record’s departure becomes a change of slope rather than a departure from a curve. Both presentations are in the paper because the two source literatures use different conventions — paleoclimate work plots against log CO₂, Berkeley Earth plots against linear — and a figure that combines them should be readable to both.
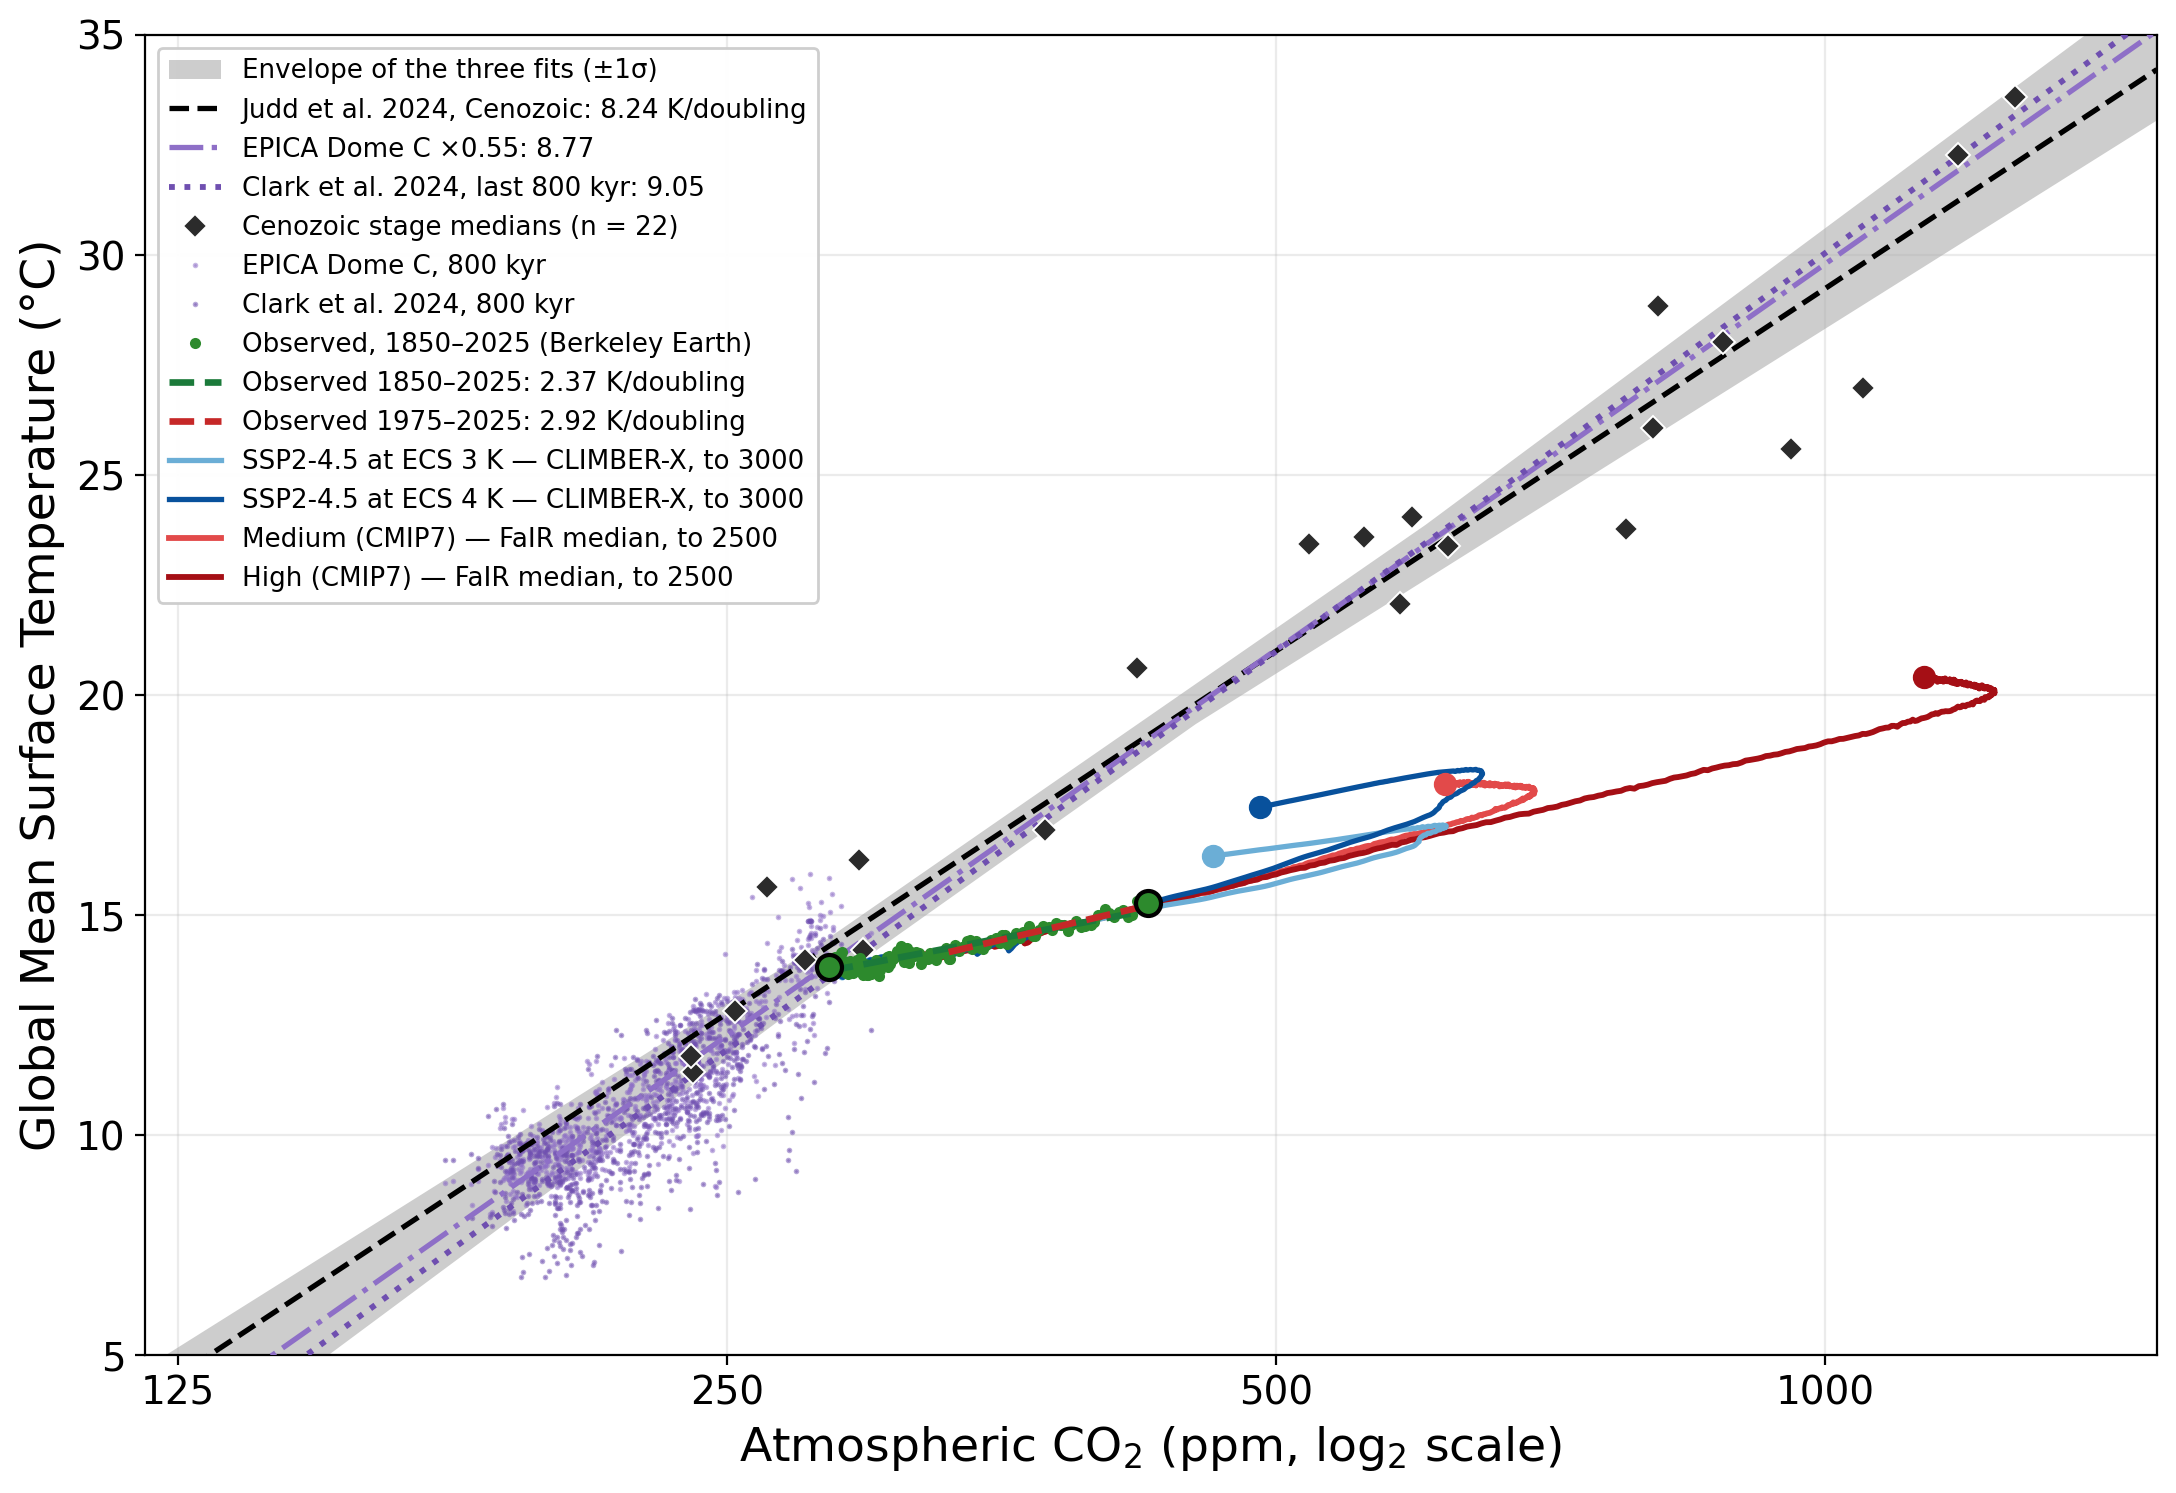
Figure 6 from the paper. The same data as always, on a log₂ CO₂ axis. The gray band is straight here; on the linear axis it curves.
The second is what the paper does not claim. The vertical distance between the modern trajectory and the paleoclimate relationship is not warming we are owed. It is a measure of how far a fast-forced system lags the relationship it would occupy under slow forcing. I have said versions of this in comment threads for months. It is now written down once, properly, in a place I can point to.
The code and data are deposited separately and will reproduce every figure and every number in the paper.
Comments
Nothing yet. Say the first thing.
Sign in to join the conversation.