
Staying Curious · justdean.substack.com · ORCID 0009-0006-1351-5320
The companion piece to this one showed a loop and said how long it takes to close. This one shows where that number came from.
I did not build this alone. I am a retired research engineer, not a climate modeler, and the model behind the dashed lines was put together with AI assistance over a number of sessions. What I brought to it is what I brought to thirty-four years of experimental work at Sandia: a habit of not believing an instrument until I have tried to break it. So this is less a description than a test record.
Why anything is needed at all
The published ScenarioMIP projections run to the year 2500 and stop. That is deliberate rather than an oversight. The scenarios are constructed so that emissions reach net zero and temperature levels off, and the whole point of the exercise is to arrive at that stable state and characterize it. By 2500 their job is done.
The carbon’s job is not. Atmospheric carbon dioxide has no single lifetime. It drains through several processes at once, on timescales from a few years to a hundred thousand, and at 2500 the slow ones have barely begun. What happens afterward is a carbon-cycle question, and nobody inside the scenario framework asks it, because that is not what the framework is for. To ask it you need something that starts where they stop.
What the model has to do
It has to start here.

The published ScenarioMIP FaIR-ensemble median at 2500 — the last year of the published run, and the first year of everything that follows. Preindustrial is the 1850–1900 mean, 13.86 °C.
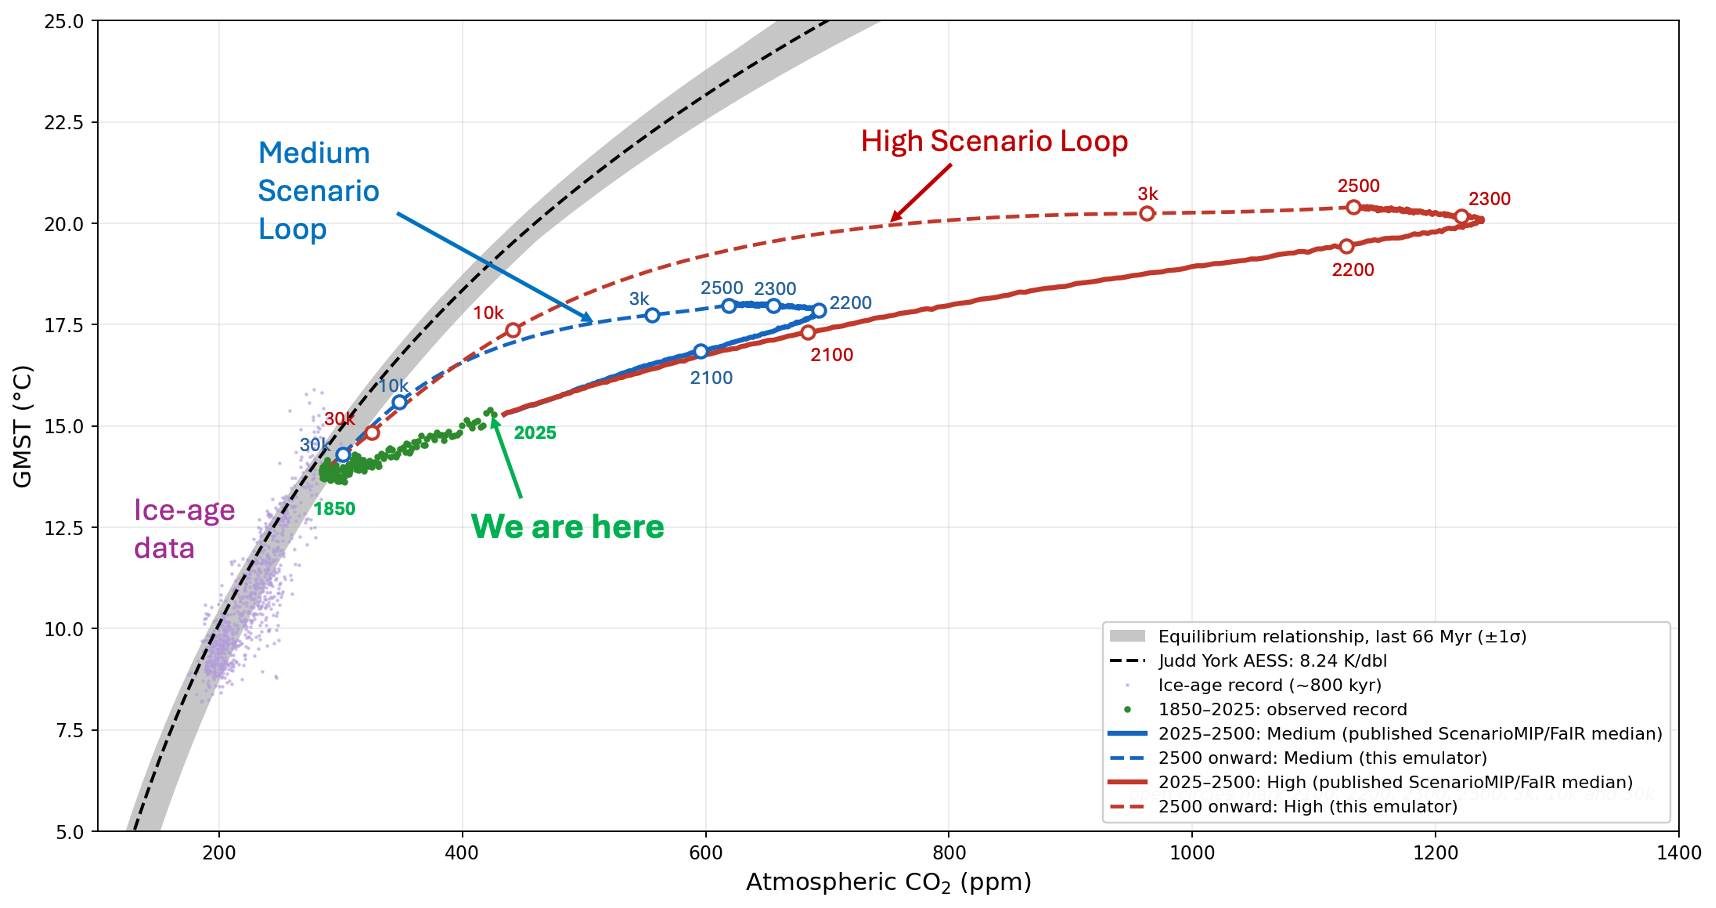
The loop, for reference. Solid lines are the observed record and the published ScenarioMIP median; dashed lines are the return computed by the model described here. This is the figure the companion piece argues from.
And it has to satisfy five requirements. I wrote these down before building anything, because a model with no stated constraints cannot fail, and a model that cannot fail cannot be trusted.
One. It must arrive at those two coordinates carrying the right amount of carbon — not merely showing the right concentration, but holding it in the right reservoirs.
Two. It must carry carbon-cycle physics across the whole range of timescales, from decades to a hundred thousand years, because the answer lives at the slow end.
Three. It must not claim committed warming. After net zero, temperature is roughly flat. The loop is a return, not a further rise, and any version that manufactures additional warming is wrong by construction.
Four. The return it computes must be physically possible. A trajectory relaxing toward the 66-million-year equilibrium relationship cannot descend more steeply than that relationship itself. If it does, the model is broken — and this is a check with a number attached, not a matter of judgement.
Five. It must be reproducible. Every input published, every step in a script, the whole folder available to anyone who asks.
The physics
The carbon cycle here is an impulse response. A pulse of carbon dioxide released into the air does not decay with a single half-life; it drains through several reservoirs simultaneously. Some is taken up by the surface ocean within a few years. More enters the thermocline over decades and the deep ocean over centuries. A slower fraction is neutralized against seafloor carbonate over several thousand years. The last of it is removed by silicate weathering, which runs on the order of a hundred thousand years.
This model carries six such modes, with timescales of 2.5, 18, 170, 2,000, 6,500 and 90,000 years, holding fractions of 0.14, 0.16, 0.24, 0.26, 0.175 and 0.025. The fast end follows the multi-model impulse response the field uses for this purpose; the slow end follows the geological work on carbonate compensation and weathering.
Those fractions sum to exactly one, and that is the most important sentence in this essay. It means the model cannot fail to return to baseline. Complete removal is not a finding; it is an assumption, welded into the arithmetic. What the model computes is the path and the timing — not whether the carbon leaves, but how long it takes and what the temperature does meanwhile.
Temperature responds through a two-box energy balance: a fast box standing for the ocean mixed layer and the fast feedbacks, a slow box for the deep ocean, responding over roughly seventeen years and 2,500 years respectively. That lag is what gives the loop its width. Temperature does not fall as quickly as carbon dioxide does, so the return traces a different path than the way out.
The process
Running it takes three steps, and the first is the one that took longest to get right.
The model runs continuously from 1750 — not from 2500. At the handoff it needs to know not just how much excess carbon is in the air but how it is divided among those six reservoirs: which are nearly drained, which have barely started. A concentration reached quickly and recently behaves quite differently afterward from the same concentration reached slowly and long ago. An early version started at 2500 from a bare number with no history, and produced a return that fell more steeply than the equilibrium it was relaxing toward — a violation of requirement four, which is how I knew it was wrong rather than merely surprising.
Second, the future emissions are scaled. Coded exactly as the published narratives specify, the model arrives at 2500 about 140 parts per million short for High and 40 short for Medium. So the narrative is multiplied — by 1.400 for Medium, 1.304 for High — until the concentration at 2500 matches the published value exactly. This is a calibration, and it is one of only two numbers in the whole model that are fitted rather than chosen.
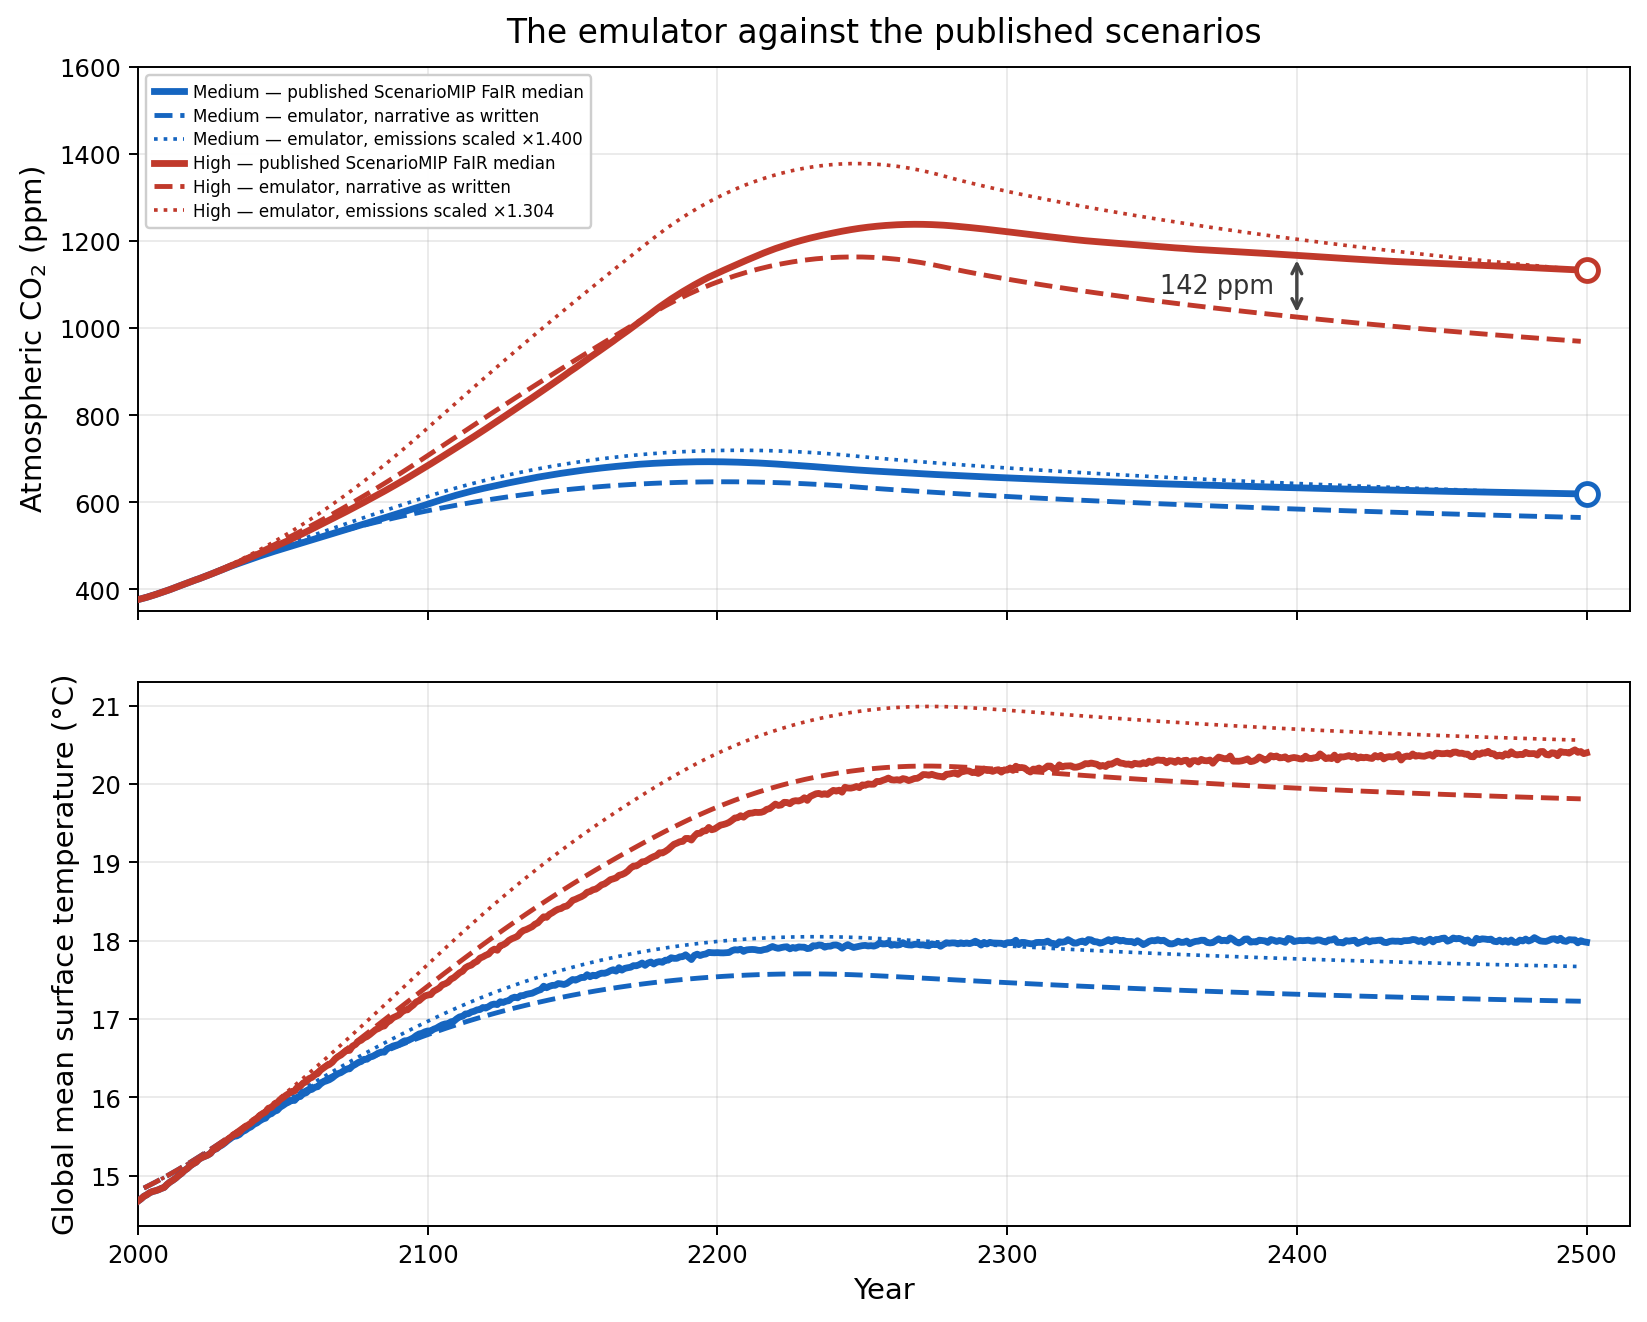
This model against the scenario projections of van Vuuren et al. 2026 (ScenarioMIP-CMIP7, GMD 19:2627; figure data MIT-licensed). Solid: the published FaIR-ensemble median. Dashed: this model run on van Vuuren’s Table-3 emission narrative exactly as written, with nothing tuned — it undershoots, by 143 parts per million for High at 2400 and 43 for Medium at 2300. Dotted: the same run with future emissions scaled 1.400× (Medium) and 1.304× (High). That scaling forces the concentration to match the published value at 2500 (open circles) and nowhere else — through the twenty-third century the scaled run overshoots instead, by up to 175 parts per million for High. The agreement is at one point, not along the path. Everything shown here is discarded before the loop is drawn; it exists only to load the carbon cycle.
The second fitted number is a temperature offset at the splice — plus 0.31 °C for Medium, minus 0.16 for High — aligning the baseline where the model’s return meets the published projection. It is tapered to zero as the excess carbon clears, so that both scenarios close on a single preindustrial temperature. An earlier version applied it rigidly and the two closed at different values, which is impossible: one baseline cannot have two.
Third, everything before 2500 is discarded. It was never the output. It was the loading.
The checks
Three, and the second is the one that matters.
Does it regenerate? Running the chain from source reproduces the trajectory file bitwise — 457 rows, five columns, maximum difference zero, identical checksum. That is the weakest of the three claims, and it is the one that lets anyone else make the other two.
Is the return physically possible? The steepest local slope anywhere along it is 6.18 degrees per doubling of carbon dioxide for Medium and 6.01 for High, against the 8.24 of the equilibrium relationship it is relaxing toward. Below, as requirement four demands. The broken early version came out well above the band, which is what told me to throw it away.
Does the scaffolding contaminate the result? Everything before 2500 is discarded, but it sets the reservoir state that the return inherits. So the fair question is not whether that pre-2500 path is right — it is not, in both directions, as the figure shows — but whether it matters. That is testable.
So I built three deliberately different emission narratives for each scenario: the published one, one front-loaded so most of the carbon arrives early, one back-loaded so most arrives late. Each was scaled independently so that all three reach exactly the same concentration in 2500, and each was run out to four hundred thousand years. Before the handoff they differ substantially — High’s peak concentration ranges from 1,260 to 1,557 parts per million across the three, the scaling factors span a factor of three, and cumulative emissions differ by twelve per cent.
After the handoff they very nearly coincide. Medium’s three returns agree to within 6 parts per million and 0.065 °C at their widest separation; High’s to within 41 parts per million and 0.25 °C. A three-hundred part per million difference in the path collapses to about forty in the return. What survives to 2500 is how much carbon there is and roughly when it arrived. The route is forgotten.
One quantity is not forgotten, and it is the one the companion piece quotes. The year the return re-enters the equilibrium band moves further than the trajectory does, because the return crosses the band at a shallow angle, so a small offset slides the crossing a long way along the time axis. Across the three histories Medium re-enters between 17,450 and 18,213 — sixteen thousand years from now, good to about eight hundred. High re-enters between 63,309 and 73,354. So when the companion piece says roughly sixty-eight thousand years, the roughly is carrying some five thousand from this source alone. Medium’s number is much firmer, which is one more reason the argument rests better there.
Does it agree with anyone else? Here is the thing I would most like to fix. Clark and colleagues — the paper I point to in the companion piece for ice-sheet timescales — report that sixty to seventy per cent of the maximum temperature anomaly remains after ten thousand years. Mine retains thirty-three per cent on Medium and forty-four on High, against scenarios carrying a comparable amount of carbon. My return is roughly twice as fast as the published multi-millennial literature.
That is one number from one paper, and it is the only external check on the tail I have found. But it is the right kind of number — it is what the model is for — and being out by a factor of two is not a rounding difference. The likeliest culprit is the weighting between the two-thousand and six-and-a-half-thousand year modes in the carbon kernel rather than anything in the energy balance.
I have not changed it. The trajectory took five attempts to arrive at something internally consistent, and I would rather publish the discrepancy than introduce a fresh defect chasing it. The direction is the conservative one in any case: a slower return means the heat lasts longer, which is the companion piece’s argument rather than an objection to it.
What it cannot do
The closure is imposed, as above. There is no permafrost carbon and no forest dieback. There are no thresholds of any kind: this is a reduced-complexity model, and ice sheets, ocean circulation and the rest of the slow machinery are not in it. The carbon-cycle response follows the previous generation of climate models rather than the spread of the current ones. And the trajectory is a single median line — no ensemble, no confidence interval. Every one of those omissions runs in the same direction.
One more, and a reader found it before I did. The energy balance relaxes toward five degrees per doubling — three fast, two slow — while the equilibrium band on the companion piece’s figure is eight and a quarter. So the model does not carry enough slow feedback to reach that band, and it has no explicit ice-sheet or vegetation response at all. Its return is very likely cooler than the truth.
I have left it, because the obvious repair is worse. Raise the sensitivity to match the band and temperature climbs after the handoff before turning over, which is committed warming, and this project does not claim committed warming. The repair that would not break that is a slower carbon kernel: hold the carbon dioxide up longer and the warmth persists without temperature ever rising after the peak.
What I would still like
That is everything I know about this model, including the parts I cannot defend. Which brings me to what I actually want, and it is not agreement.
This is a simple model. Two boxes for temperature, six exponentials for carbon, no ice sheets, no vegetation, no thresholds of any kind. I have pushed it about as far as it will go, and the places where it is weakest — the shape of the return, the missing slow feedback — are not things I can fix by being more careful. They would need a model with the machinery in it. What would a full Earth system model, or an intermediate-complexity model run long, say about the same question? I do not know, and I would like to.
There is a fair objection to the whole exercise, and I want to state it rather than wait for it. What is the point of projecting ten or twenty thousand years out? Nobody is making decisions on that horizon. No policy runs that long. The honest answer is that I am not projecting in order to plan — I am projecting in order to size the thing. A disturbance that resolves in a century is one kind of event and a disturbance that resolves in twenty thousand years is another, and you cannot tell which one you are living through by looking at a chart that stops in 2100. The number does not need to be precise to settle that question. It needs to be right about which order of magnitude we are in, and every check in this essay says it is.
The package
The chain runs in one direction: the emulator module holds the physics, a build script runs it and writes the trajectory file, and the figure script draws from that file without regenerating it. One warning for anyone running it — the build script is the entry point, not the module’s own main block, which ships with different defaults and will silently produce a different model. The manifest says so, and says what else to watch.
The scenario data is the published figure data from van Vuuren and colleagues, MIT-licensed, and the paper is open access. The separate harmonized emissions release is restricted and is not used here.
The whole folder — data, scripts, manifest — goes to anyone who asks, as it has for every figure in this series. That buys the only thing worth buying: you do not have to believe me. You can run it, and if it is wrong, you can show me where.
Comments
Nothing yet. Say the first thing.
Sign in to join the conversation.