
I recently returned home from leading a workshop on decentralized water treatment with biochar in Puerto Rico. It was my first trip to the island, organized by the gracious and talented directors of the Caribbean Agroforestry Institute, Steph and Dan, and their hotshot team. The workshop kicked off what we hope to be a long and fruitful ongoing collaboration.
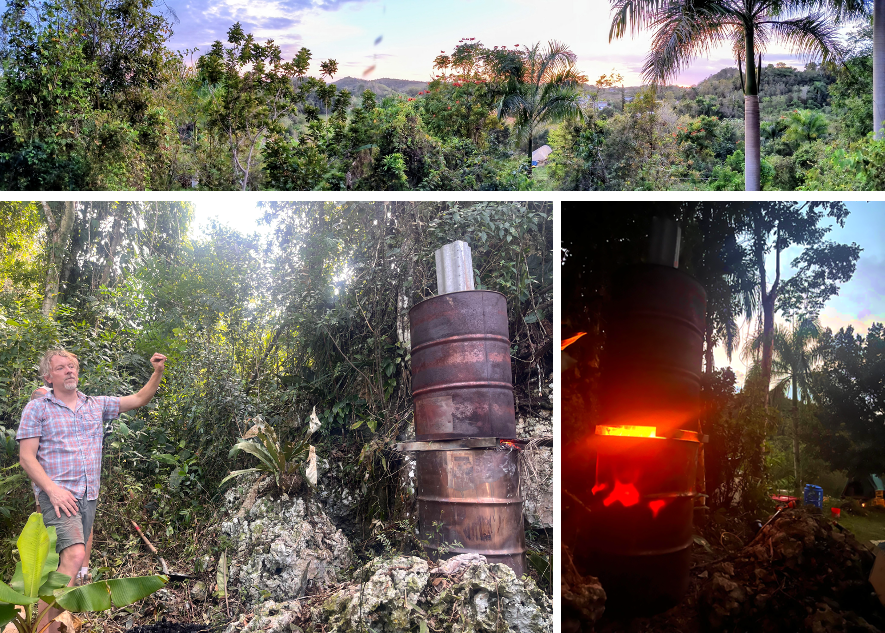
The north-central region of Puerto Rico, where the workshop took place, is a fascinating and tragic case study in environmental geology and chemical water pollution.
See the end of this article for a bibliography of geology, water, and public health studies conducted in the region, from which the following summary is drawn.
A vast karst aquifer system underlies 19% of the island’s land area, in a region that is home to over 10% of the population. Karst is comprised of highly fractured and weathered rock – typically limestone and dolomite. Karst subsurface topography has very high porosity and permeability, allowing karst aquifers to capture, store, and transmit enormous quantities of water. While hydraulic conductivities in most subsurface systems and porous media (e.g., sand filters) are 1 m/day, karst systems exhibit conductivities of tens to hundreds of m/day. Karst aquifer systems readily interact with overlying surface water systems through recharge zones, springs that emerge from the subsurface, streams that disappear underground and re-emerge downgradient, and sinkholes. Groundwater from karst aquifer systems provides 20-25% of water use globally and over 40% of the drinking water in the US.
The high porosity and permeability that make karst aquifer systems so productive and valuable also make them highly vulnerable to contamination, allowing pollutants to be stored and transported over large distances with potential for exposure to humans, wildlife, and ecosystems.
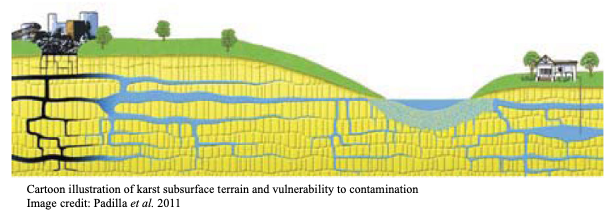
The abundant freshwater resource of Puerto Rico’s north coast karst aquifer system is a factor that propelled the development of pharmaceutical, chemical, agricultural, and manufacturing industries in the region along with associated urban development and the proliferation of landfills and waste disposal sites. Accidental spills, clandestine disposal, and even intentional injections of wastes into the aquifer (a practice discontinued after the 1970s) has led to widespread contamination of northern Puerto Rico’s water supply. Sinkholes were often used as informal/clandestine dump sites, leading to direct and heavy contamination of the underlying aquifer.
Accordingly, Puerto Rico and the north coast karst aquifer region in particular has the highest density of Superfund and RCRA (Resource Conservation and Recovery Act) Corrective Action sites in the US and its territories. As of 2025 Puerto Rico hosts a total of 25 Superfund sites, with 12 of those Superfund Sites along with 15 RCRA Corrective Action sites located within the north coast karst aquifer region.
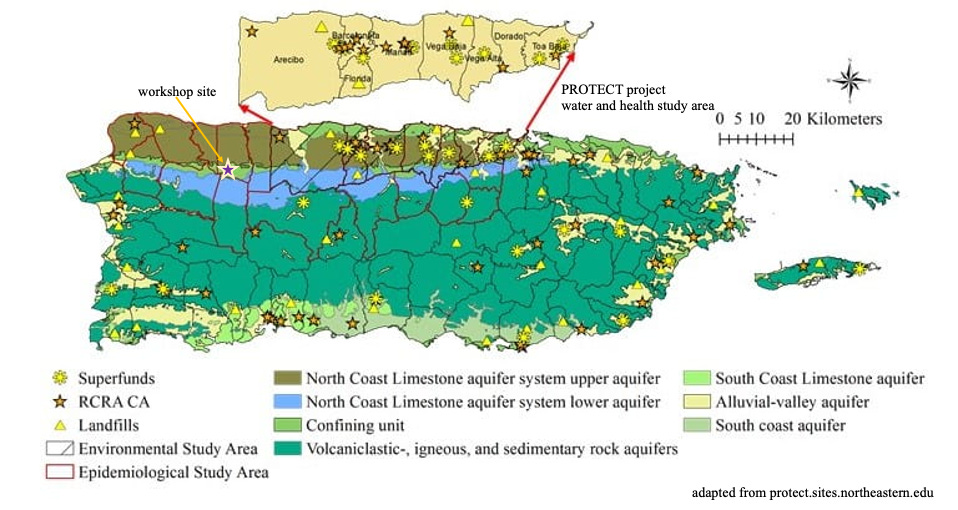
The US EPA estimated that pharmaceutical manufacturers associated with just one of the north coast Superfund sites discharged approximately 60 metric tons of waste material during the 1980s. At another Superfund site US EPA documented releases of 5,000 kg per year of just one compound – trichloroethylene (TCE) – during the 1980s, and 1,600 kg per year during the 1990s.
A multitude of deleterious health effects can arise from exposure to this environmental and groundwater pollution. For example, rates of preterm birth, infant mortality, spontaneous abortion, and premature thelarche (breast development) in Puerto Rico are also the highest or among the highest in the US and its territories.
Two classes of widely detected contaminants in the north coast karst aquifer system are chlorinated volatile organic compounds (CVOCs) and phthalates. Exposure to CVOCs and phthalates has been associated with endocrine disruption, developmental impairment, reproductive dysfunction, neurological damage, cancer, organ damage (e.g., liver, heart, kidneys), and immunological effects.
Phthalate contamination of the north coast karst aquifer system
Phthalates are widely used as plasticizers to impart flexibility and durability to plastics, and as solvents and manufacturing additives in a wide array of pharmaceuticals and personal care products and in disposable food packaging. Because of their toxicity, prevalence in the environment, wide- spread use, and potential human exposure, phthalates are of particular concern. The US EPA includes six phthalates as priority pollutants:
DEHP – di-(2-ethyl hexyl) phthalate
BBP – butyl benzyl phthalate
DBP – di-n-butyl phthalate
DnOP – di-n-octyl phthalate
DEP – diethyl phthalate
DMP – dimethyl phthalate
A water quality survey (Torres et al. 2018) found extensive contamination of the north coast karst aquifer by DEHP, DNOP, DBP, and DEP. In 197 sampling sites at least one phthalate was detected in 92% of sites. The most detected phthalate was DEHP in 89% of sites. The least detected was DEP, in 29% of sites. Total phthalate concentrations averaged around 5 ug/L and ranged up to 58 ug/L. These are among the highest phthalate concentrations reported even for sites impacted by landfills and urban development.
A study of urinary phthalate biomarkers (Cantonwine et al. 2014) found evidence for widespread exposure to phthalates among pregnant women living on the Northern coast of Puerto Rico. Phthalate metabolites were detected in nearly 100% of the urine samples, and at higher concentrations (in some cases up to twice as high) compared to women in the mainland US population.
CVOC contamination of the north coast karst aquifer system
CVOCs are used in large quantities as industrial solvents and degreasers, as well as in an array of consumer products and textile cleaning (e.g., dry cleaning). In the north coast karst aquifer region, CVOC contamination has been associated with pharmaceutical and electronics manufacturing companies as well as landfills and informal disposal sites. CVOCs are volatile, sparingly soluble in water, and are resistant to degradation in the environment. Therefore, CVOCs typically are projected to have long residence times in aquifers of hundreds to thousands of years.
A water quality survey (Torres et al. 2019) found extensive contamination of the north coast karst aquifer by CVOCs with at least one type of CVOC present in 64% of groundwater samples collected from throughout the region. 53% of samples contained two or more CVOC compounds. CVOCs are present in half of the Superfund designated sites in the north coast karst aquifer region. The seven most frequently detected CVOCs in the region are:
CCl4 – carbon tetrachloride
TCM – trichloromethane
DCM – dichloromethane
PCE – perchloroethylene
TCE – trichloroethylene
1,1-DCE – 1,1-dichloroethylene
cis-1,2-DCE – cis-1,2-dichloroethylene
CVOCs were detected at very high concentrations in many water samples – total (sum of) CVOCs averaged 54 ug/L (ppb), and ranged as high as 16.4 mg/L (ppm…!!!). An earlier survey (Yu et al. 2015) had found lower average levels (ppt to ppb range) of 17 CVOCs present in sampling sites throughout the region. Another study (River et al. 2018) revealed CVOCs in 62% of groundwater samples and 58% of tap water samples in the north coast aquifer region, including CCl4, PCE, TCE, and TCM frequently detected.
Persistent presence of CVOCs in the karst aquifer system, even after contaminated sites have been subjected to remediation efforts, is attributed the high capacity of the aquifer to store, transport, and slowly release contaminants over long periods of time.
There is an extensive literature on removal of phthalates and CVOCs from drinking water using activated carbon. We don’t have empirical laboratory or field data on treatment of phthalates or CVOCs using biochar within our research consortium. There are a couple of tools we can use, however, to explore the potential applicability of biochar adsorbent for removing these pollutants.
Adsorbate comparison tool
One tool described here previous, is the adsorbate comparison tool. This tool uses a modeling approach to compare the adsorbability of a compound of interest to dozens of other water pollutants belonging to several chemical classes (e.g., agrichemicals, PFAS, pharmaceuticals and personal care products, industrial compounds, etc.).
The adsorbate comparison tool includes references to the adsorbability of Sentinel Chemicals – selected common water pollutants for which we have the largest datasets and that we rely on most heavily in the design and operation of biochar water treatment systems.
A first step is to run the phthalate and CVOC compounds identified in the research summarized above through our adsorbate comparison model to get a sense of how difficult to remove by adsorption they are compared with Sentinel Chemicals and other water contaminants of concern.
Remember: “All models are wrong; some models are useful.” Whenever you run a model you will always get an answer. However, the relationship between that answer and the on-the-ground reality is often tenuous and uncertain. Validation of model predictions, whenever possible, is critical! As a first step in design and decision support, we find it helpful to have a sense of the predicted adsorbability of contaminants for which we don’t have hard data.
Human health / environmental health risk index tool
Another decision support tool that can help us prioritize and focus our efforts is to gauge the severity of environmental/ecological and human health impacts of different contaminants of concern. It might well be the case that in our treatment system design we want to prioritize the removal of compounds associated with the more negatively consequential ecological and human health effects.
Described here is an admittedly rough approach to comparing the risk of negative ecological and human health effects of compounds. Though the method is a little crude, it can serve as a first-cut, “quick-and-dirty” decision support tool for prioritizing treatment objectives.
Our human health / environmental health (HH EH) risk index ranks chemical compounds by the number of human health and environmental health warnings listed in the US NIH’s PubChem database. As an example of how we tabulate the HH EH risk index, we’ll use the CVOC perchloroethylene identified in the research summarized above.
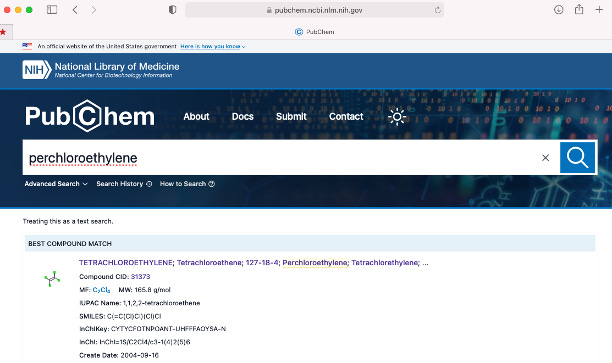
Put “perchloroethylene” into the search bar and inspect the best match result.
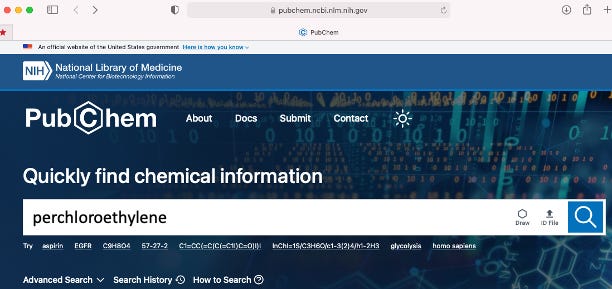
It will list other compound names, formula, molecular weight, SMILES code, etc. (For example, “tetrachloroethylene” is a synonym for “perchloroethylene.) FYI, this is the same process used to obtain inputs for the adsorbate comparison tool. Make sure these identifiers match the compound you’re looking up.
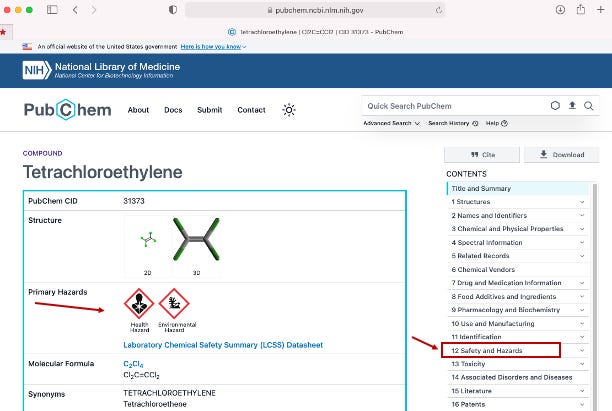
The entry will list primary hazards as well as “Safety and Hazards” section on the menu bar to the right – click on this.
The Safety and Hazards section will typically provide one entry of several. Click “View All.” This will list several “Safety and Hazards” entries from different databases.
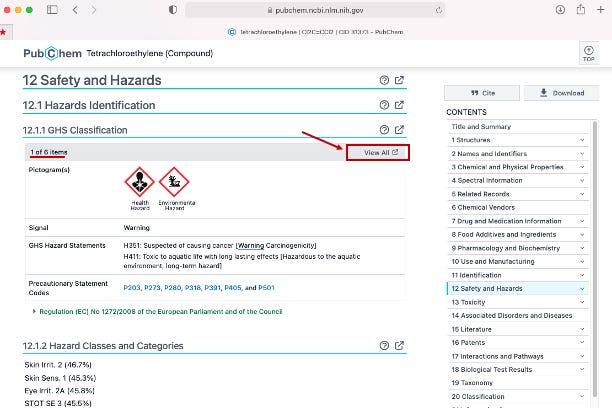
For our example compound perchloroethylene, we see six reports from different Safety and Hazards databases. The “GHS Hazard Statements” list one or more ecological and/or human health warnings. Our “quick-and-dirty” HH EH risk index method is to total up the number of GHS hazard listings and divide by the number of databases. So it’s just a kind-of average HH EH risk based on how many times a warning is listed for the compound.
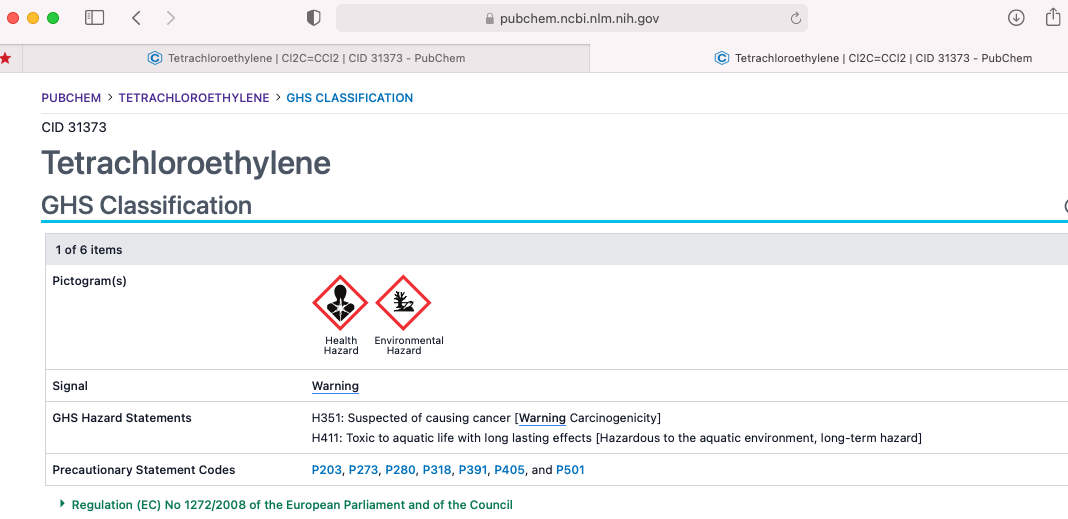
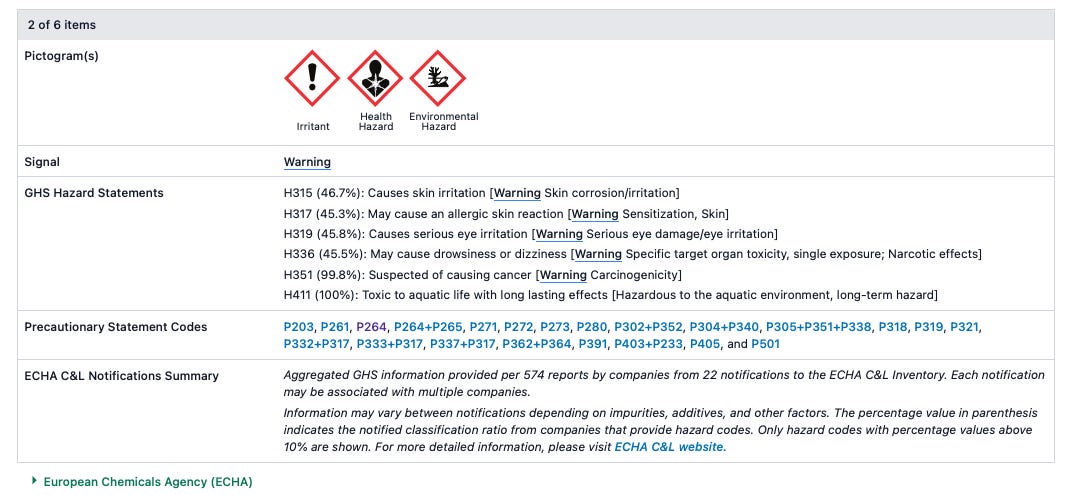
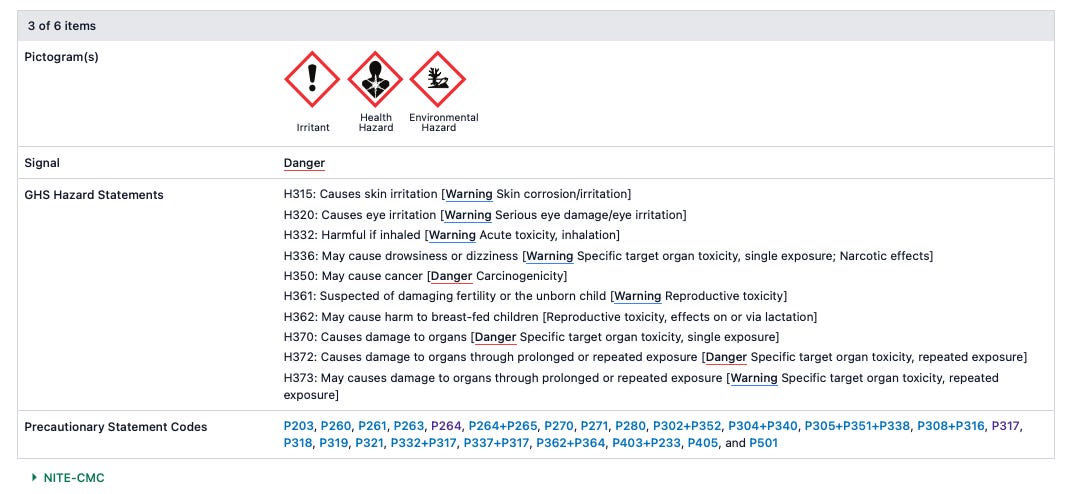
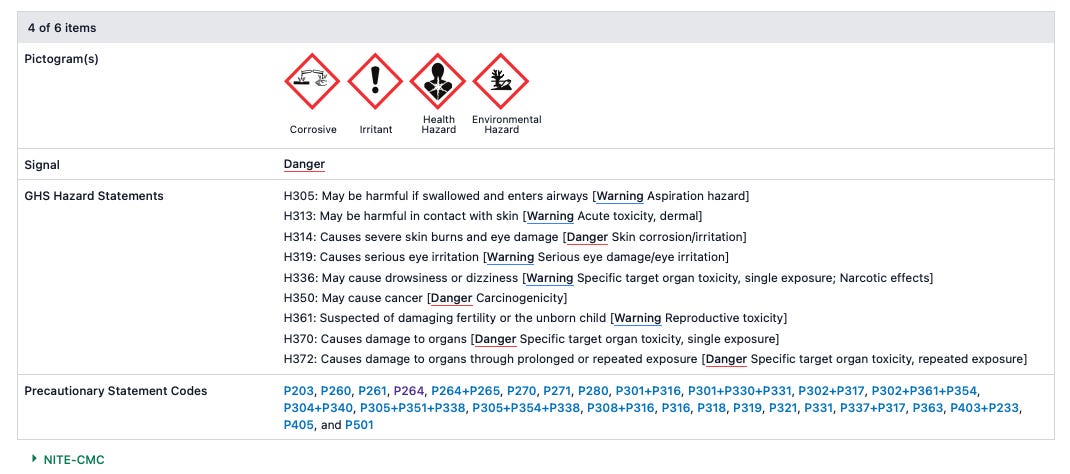
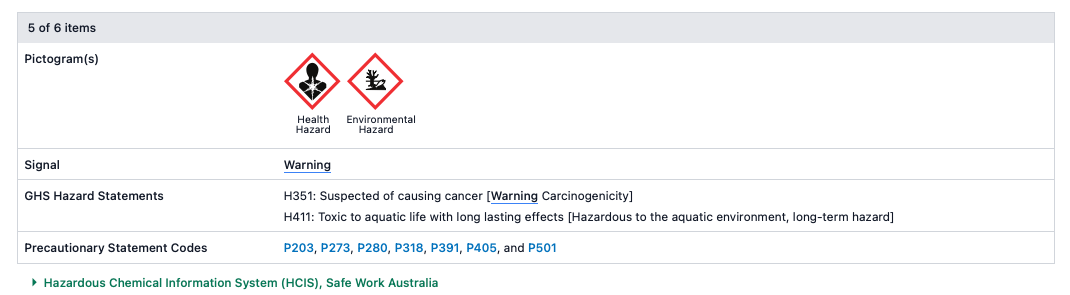
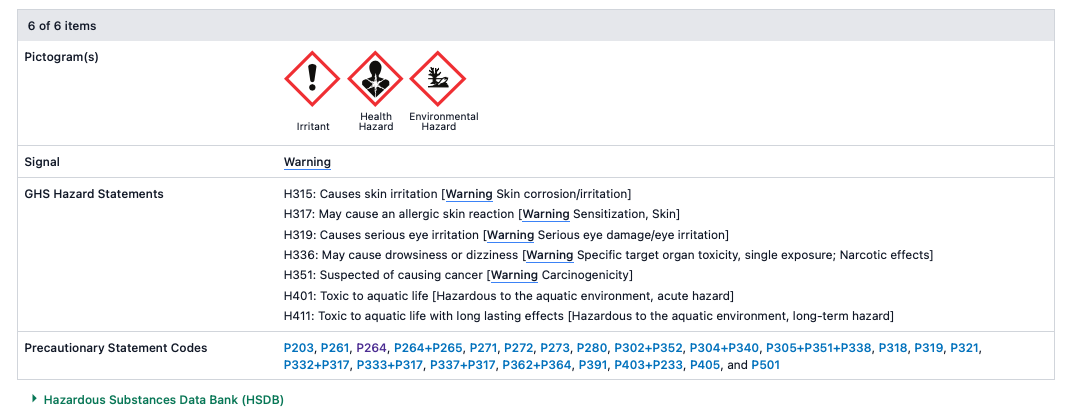
In the case of perchloroethylene, the GHS hazard listing counts are 2, 6, 10, 9, 2, and 7, for a total of 36 listings across six databases and an average of 6 HH EH warnings across all the databases returned in the PubChem search. So perchloroethylene has an HH EH risk index of 6, according to our crude method. The idea is simply that the more times a compound is listed in these hazard databases, the greater the HH and/or EH risk it represents.
Visualizing health risk and treatability for water contaminants of concern
Using this method we tabulated HH EH risk indices for the phthalate and CVOCs identified in the research summary above, as well as the chemicals used in our contextualized analysis of comparative adsorbability. A two-dimensional plot of health risk versus biochar treatability looks like this:
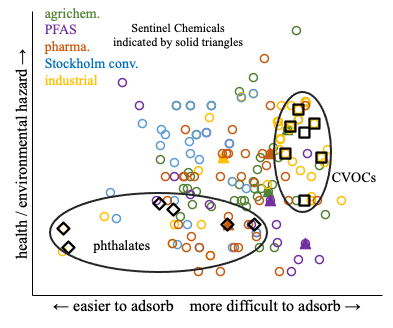
The further up you go on the plot, the higher the HH EH risk index. The further right you go on the plot, the more difficult to adsorb by biochar (according to the model prediction, with all the necessary caveats, disclaimers, etc…).
This rough analysis suggests that, of the two main classes of north coast karst aquifer water pollutants identified by environmental health researchers in Puerto Rico, CVOCs tend to represent the great health hazard as well as the more difficult treatment challenge compared with phthalates. The CVOCs are small, polar molecules, and are very environmentally persistent due to their strong carbon-chlorine bonds. So it’s not entirely surprising they are more difficult to adsorb and represent a somewhat greater HH EH risk than phthalates as a chemical class.
The model predicts that the CVOCs are similar to or even slightly more difficult to remove by biochar adsorption than many of our Sentinel Chemicals. So one way we might use this information is to design biochar treatment systems on a very conservative basis – in other words, to a high level of confidence that even the most difficult-to-adsorb compounds would be expected to be substantially removed. Qualitatively, that probably would translate to larger biochar contactor units and more frequent adsorbent refurbishment.
Of course, when implementing treatment systems we will need to put quantitative specifics on that. But for now this analysis provides a “good enough” starting place to deepen our conversation with local partners about the potential for decentralized water treatment with biochar in Puerto Rico!
As this project develops I will post updates here. And as always, thank you for your enthusiasm and support for our work!
Cantonwine, D. E., J. F. Cordero, L. O. Rivera-González, L. V. Anzalota Del Toro, K. K. Ferguson, B. Mukherjee, A. M. Calafat, N. Crespo, B. Jiménez-Vélez, I. Y. Padilla, A. N. Alshawabkeh and J. D. Meeker (2014). “Urinary phthalate metabolite concentrations among pregnant women in Northern Puerto Rico: Distribution, temporal variability, and predictors.” Environment International 62: 1-11.
Cordero José, F., D. Meeker John, T. Sheahan, I. Padilla, R. Giese, B. Silevitch Michael, R. Loch-Caruso, D. Kaeli and N. Alshawabkeh Akram (2012). Case Study?Puerto Rico Test Site for Exploring Contamination Threats. GeoCongress 2012: 3553-3562.
Padilla, I., C. Irizarry and K. Steele (2011). “HISTORICAL CONTAMINATION OF GROUNDWATER RESOURCES IN THE NORTH COAST KARST AQUIFERS OF PUERTO RICO.” Rev Dimens 3: 7-12.
Rivera, V. L., I. Y. Padilla and N. I. Torres (2018). Spatiotemporal Assessment of CVOC Contamination in Karst Groundwater Sources and Exposure at Tap Water Point of Use. Karst Groundwater Contamination and Public Health, Cham, Springer International Publishing.
Torres, N. I., V. L. Rivera, I. Y. Padilla, R. E. Macchiavelli, D. Kaeli and A. N. Alshawabkeh (2019). “Effect of hydrogeological and anthropogenic factors on the spatial and temporal distribution of CVOCs in the karst system of northern Puerto Rico.” Environ Earth Sci 78(20).
Torres, N. I., X. Yu, I. Y. Padilla, R. E. Macchiavelli, R. Ghasemizadeh, D. Kaeli, J. F. Cordero, J. D. Meeker and A. N. Alshawabkeh (2018). “The influence of hydrogeological and anthropogenic variables on phthalate contamination in eogenetic karst groundwater systems.” Environmental Pollution 237: 298-307.
Yu, X., R. Ghasemizadeh, I. Padilla, C. Irizarry, D. Kaeli and A. Alshawabkeh (2015). “Spatiotemporal changes of CVOC concentrations in karst aquifers: Analysis of three decades of data from Puerto Rico.” Science of The Total Environment 511: 1-10.
No posts
Comments
Nothing yet. Say the first thing.
Sign in to join the conversation.