
To briefly recap from the introduction to this R&D project:
In the field-lab setting and when monitoring decentralized biochar water treatment systems “in the wild” we generally cannot measure specific pollutants of concern (e.g., herbicides, PFAS, flame retardants, etc.) due to analytical, logistical, and cost limitations.
Instead we rely on proxy measurements of DOM (dissolved organic matter), since DOM fouls biochar adsorbent and reduces it’s useful life for removing pollutants of concern. And DOM can be measured in the field/field-lab using UV and fluorescence spectrometry. Monitoring DOM this way provides a conservative indicator of bicohar adsorption efficacy.
This approach has worked well for us over the years. But what if we could improve on it?
Enter the search for a “Miracle Molecule.” What if we could find a compound that
behaves like a (micro)pollutant of concern (e.g., PFAS) from an adsorption standpoint,
but is itself benign from an ecological and human health standpoint,
and is also detectable down to low-parts-per-billion (ppb) levels using inexpensive field instruments,
and can be readily obtained at low or modest cost?
Such a compound could be spiked into water samples and used in a field lab to evaluate different source water / biochar adsorbent combinations. It wouldn’t pose a health risk to staff or the local environment or generate a waste stream that’s difficult or impossible to dispose of. But it would give us additional quantitative information guiding the design, implementation, and monitoring of biochar water treatment systems.
With this in mind we began a “unicorn hunt” to identify candidate molecules that could meet the stringent criteria laid out in the preamble to this project. The first round of selection turned up 14 compounds that might do the job.
But before I get to those, a word on the analytics we’re using to interrogate our putative unicorn molecules…
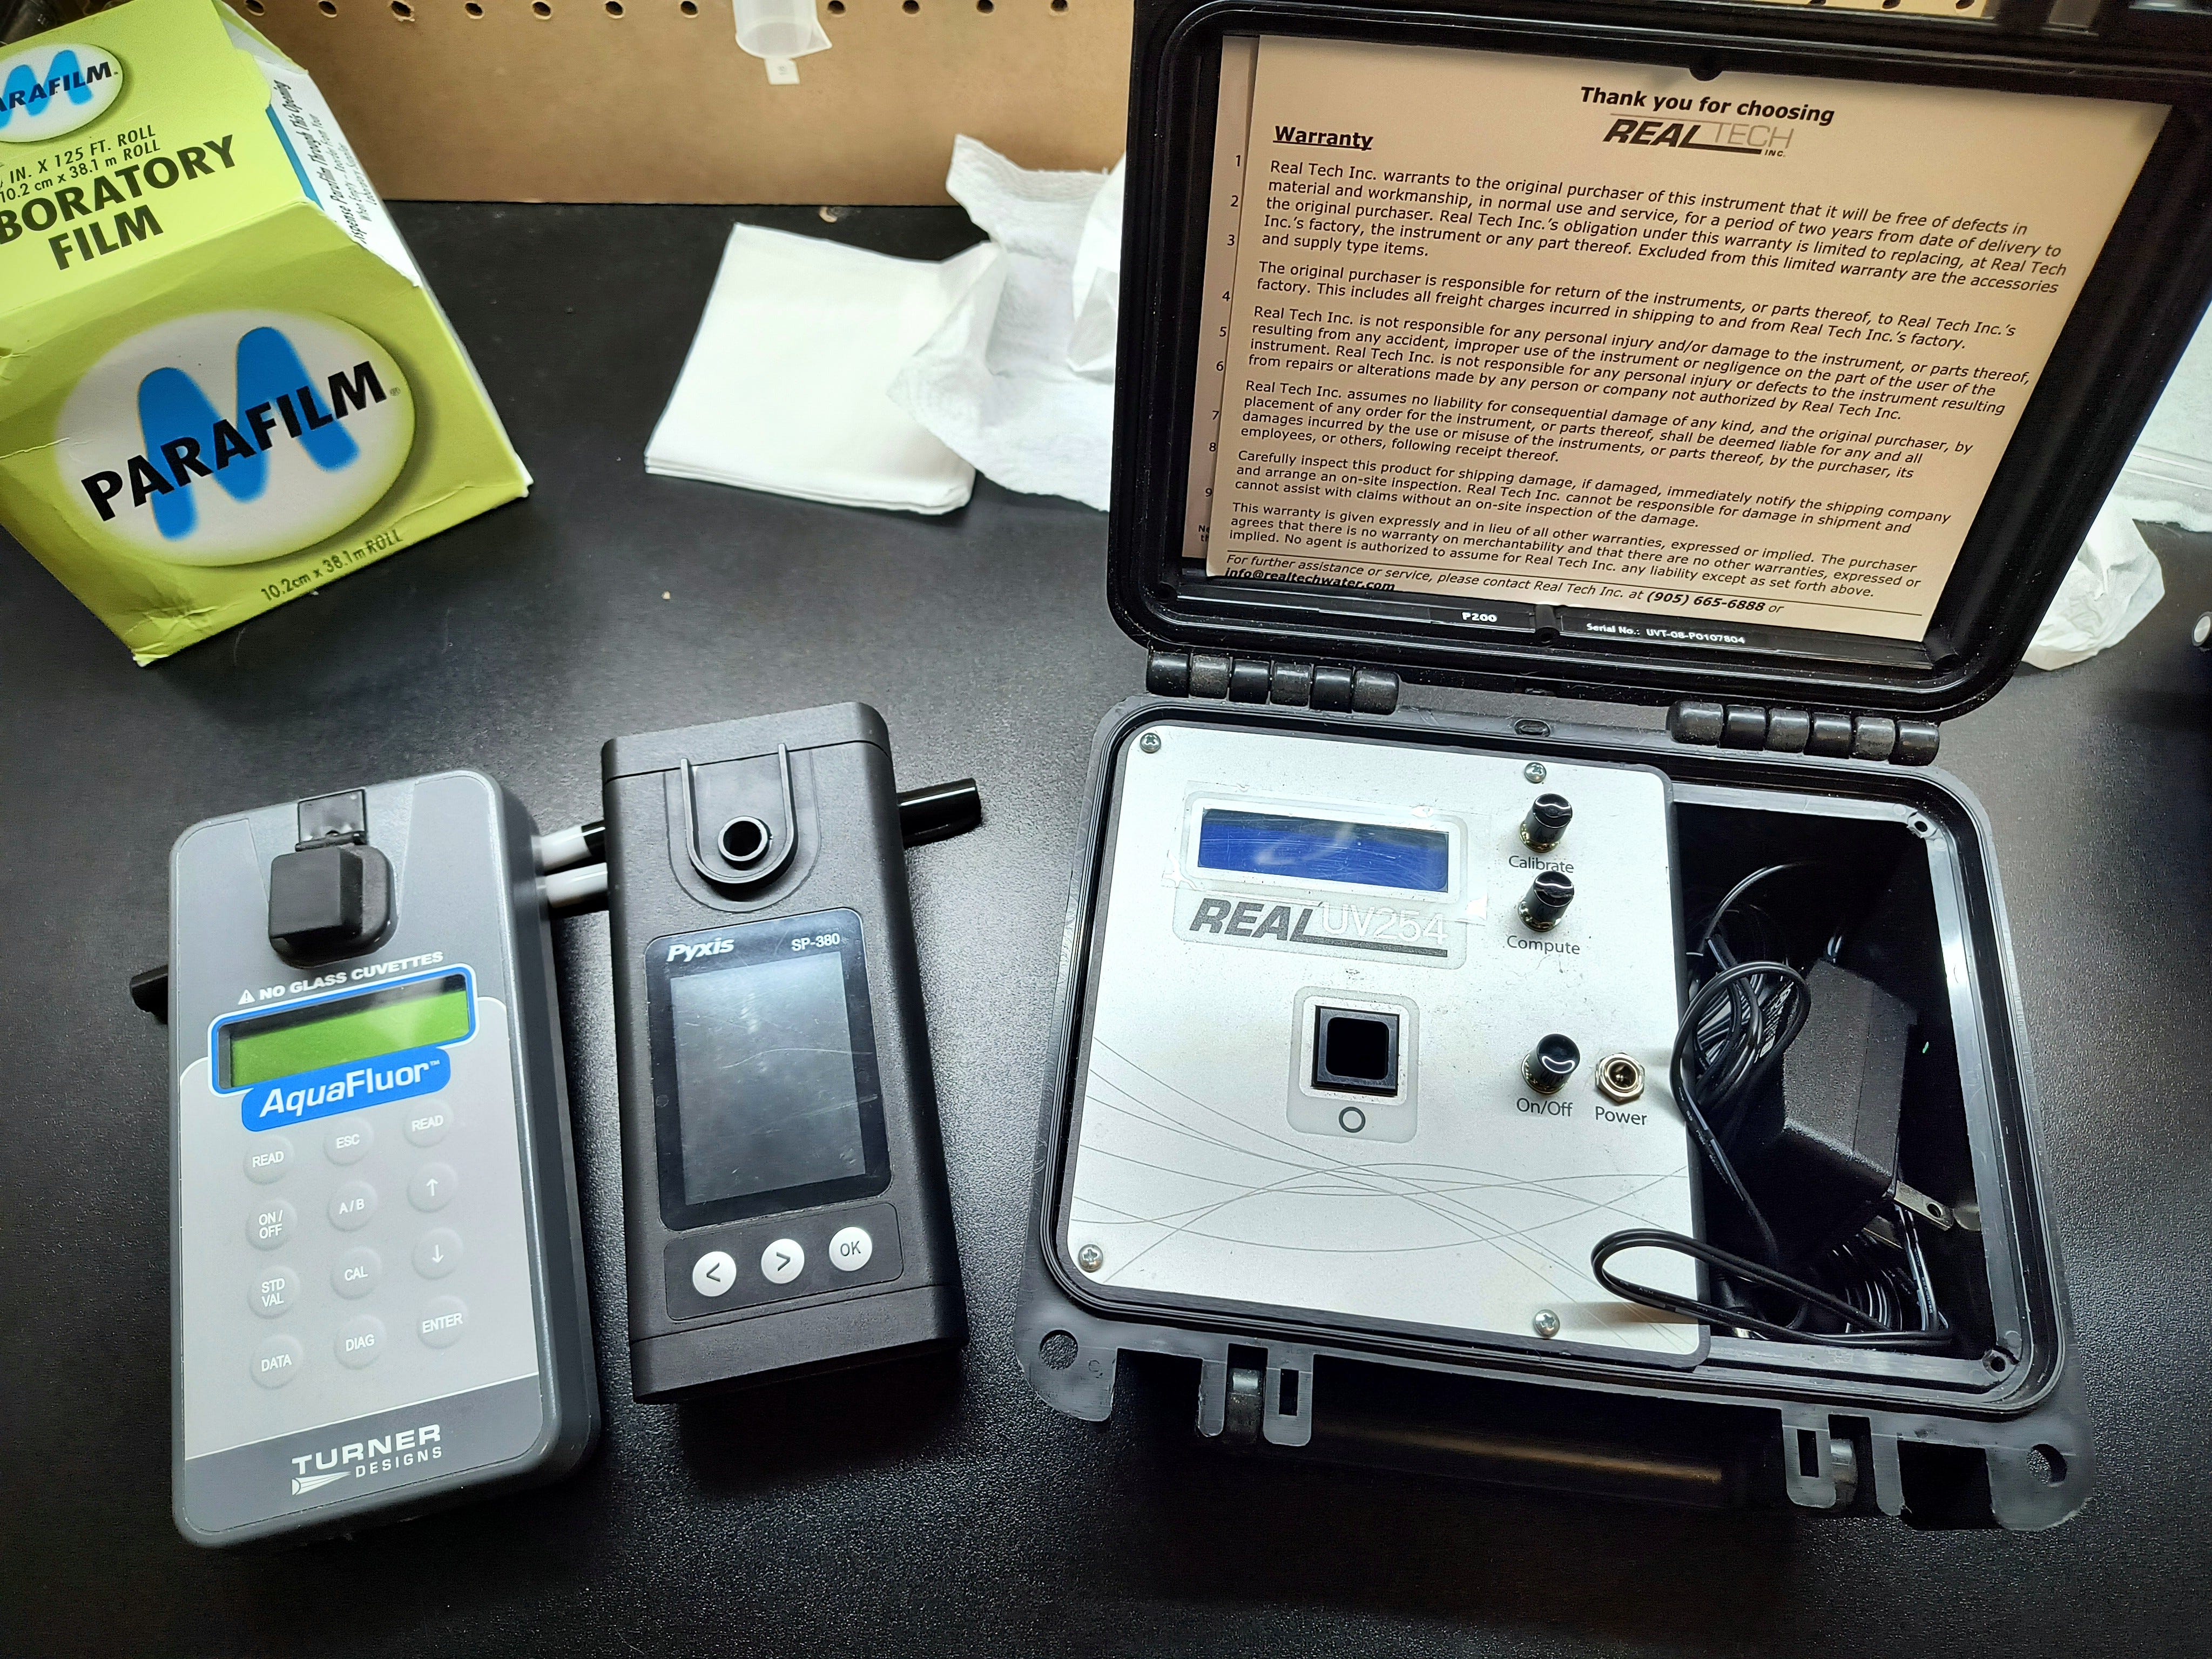
Two commercial portable fluorometers (left) and a portable UV254 meter (right).
The data discussed in this project section is collected using these three commercial instruments. They are
the AquaFluor, made by Turner Designs
the SP-380, made by Pyxis
the P200 UV254 meter, made by RealTech (RealTech was bought by ABB and now similar meters are sold as UviTech)
First I want to say - I love all of these meters. I have gotten a lot of mileage out of them and they have provided enormous benefit to our field projects and R&D program over the years. My interactions with staff at Turner, Pyxis, and RealTech (I haven’t had any interactions so far with ABB) have always been very helpful and pleasant.
The main (only, really) downside is the cost. That’s $9,000-$10,000 worth of field gadgets sitting on my lab bench. (Hence the companion project to try to build our own field spectrometers on the cheap…)
Ideally, our field labs will be equipped with some combination of UV absorbance and fluorescence instruments that are sensitive to both (1) background DOM in source waters of interest, and (2) surrogate adsorbate(s) that we spike in to simulate the removal of (micro)pollutants of concern. We need to be able to measure the background DOM, and simultaneously exclude it or minimize it as “noise” in the measurement of our surrogate adsorbate(s).
Quick review on the distinction between absorbance and fluorescence measurements:
Light of some range of wavelengths is shined on a water sample. Some wavelengths of light are absorbed by DOM in the sample and some are transmitted. The ratio of light that’s absorbed versus transmitted is related to the concentration and character of the DOM. That’s “absorbance,” in our case using a light source and detector centered on a wavelength of 254 nm. This is an industry standard method (i.e. UVA254) for measuring DOM in water samples.
In fluorescence, light of some wavelength range shines on a sample and is absorbed into the bonds of dissolved molecules; light of a different wavelength range is then re-radiated. The shift in the wavelength range and the intensity of the emitted light is related to the character and concentration of the type of organic bonds present in the dissolved molecules.
When we’re interrogating potential unicorn molecules we’re mainly concerned with fluorescence - this measurement has the potential sensitivity to detect compounds down to low-ppb levels. All along I measure UVA254 as well - ideally, unicorn molecules will have a weak or effectively zero UVA254 signal. One of the challenges of this project will be to minimize any cross-interference in UV absorbance and fluorescence measurements between DOM and target adsorbates.
Commercial fluorometers: same-same, but different
The work detailed below utilizes the Turner AquaFluor and Pyxis SP-380 instruments. I’ll cover all the details of how they are similar and different in the companion section on spectrometers. For our purposes here seeking unicorn molecules, all you need to know is:
The Turner instrument utilizes wide wavelength ranges. The light source centers on a wavelength of 375 nm, and ranges from 270 nm to 430 nm. The detector is sensitive to light at and above 420 nm.
The Pyxis instrument uses narrow wavelength ranges. The light source centers on 365 nm, and the detector on 410 nm. I’ve requested the exact bandwidth ranges from Pyxis and will post when they respond. Regardless, they are much narrower than the Turner instrument.
Since the Turner fluorometer uses such wide wavelength ranges more light reaches the detector and so it is inherently a more sensitive instrument than the Pyxis fluorometer. But, picking off narrow wavelength bands could be an advantage if they match well to the absorbance and fluorescence spectra of unicorn candidates while excluding background “noise.” So neither instrument is better; they’re similar tools that have different niches of applicability.
Understanding what the units mean
Both Turner and Pyxis instruments report fluorescence in units of “ppb (as PTSA)”. PTSA (pyrenetetrasulfonic acid) is a fluorescent compound that is used to calibrate the instruments. Water samples don’t typically contain PTSA. What the units signify is that a given water sample fluoresces as if it were a solution of PTSA of X-concentration. So if the meter reads 100 ppb, that means the fluorescence signature of the water sample is like that of a 100 ppb solution of PTSA. Hence “ppb (as PTSA)”.
One more important detail: the Turner has a working range of approximately 1-1,000 ppb (as PTSA), and the Pyxis has a working range of approximately 1-300 ppb (as PTSA).
Roughly, this…
Identify and obtain unicorn molecule candidates that meet our criteria in batches of 10-20 compounds.
Put them through a rapid screening procedure by determining their fluorescence response with the Turner and Pyxis instruments at a nominal concentration of 100 ppb in DI water.
For compounds with a significant fluorescence response, determine the stability of response over a ~48 hour period in DI water.
For compounds with a significant and stable fluorescence response in DI water, quantify the intensity and stability of their fluorescence response in natural water (i.e., water containing DOM).
For compounds exhibiting a strong and stable fluorescence response in natural water, determine their adsorption behavior with biochar in RSSCTs (Rapid Small Scale Column Tests) and compare with (micro)pollutants of interest.
Repeat for the next group of unicorn molecule candidates.
Select one or a few of the top performers and build methods around them for our field lab biochar water testing program.
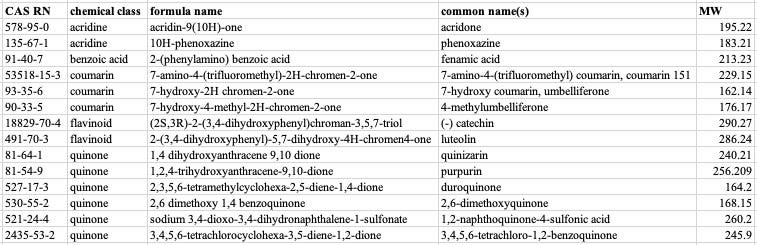
Using our search criteria I rounded up the first batch of 14 test subjects, representing five compound classes:
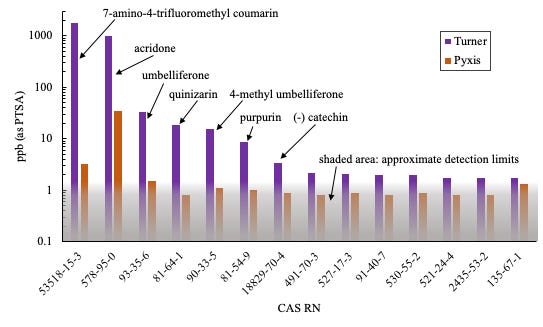
Here are the fluorescence responses of each compound at a nominal concentration of 100 ppb in DI water (note that the y-axis is a log scale):
Key observations:
7-amino-4-trifluoromethyl coumarin and acridone exhibit very strong fluorescence signals with the Turner fluorometer. Immediately it’s recognizable that these are strong candidates for unicorn molecules from a fluorescence perspective.
All compounds except for acridone exhibit a low or BDL (below detection levels) response with the Pyxis fluorometer. Acridone exhibits a modest fluorescence signal with the Pyxis instrument.
Compounds displaying a modest fluorescence signal (Turner) - umbelliferone, quinizarin, 4-methyl umbelliferone, and purpurin - can be filed under the “maybe unicorn” category. In the companion DIY spectrometers project it could be possible to adjust wavelength ranges of light sources and detectors in ways that derive stronger fluorescence signals from these compounds.
It’s fascinating that both 7-amino-4-trifluoromethyl coumarin and acridone exhibit very strong fluorescence signals with the Turner, but only acridone exhibits a signficant response with the Pyxis. Let’s look at most likely why this is the case:
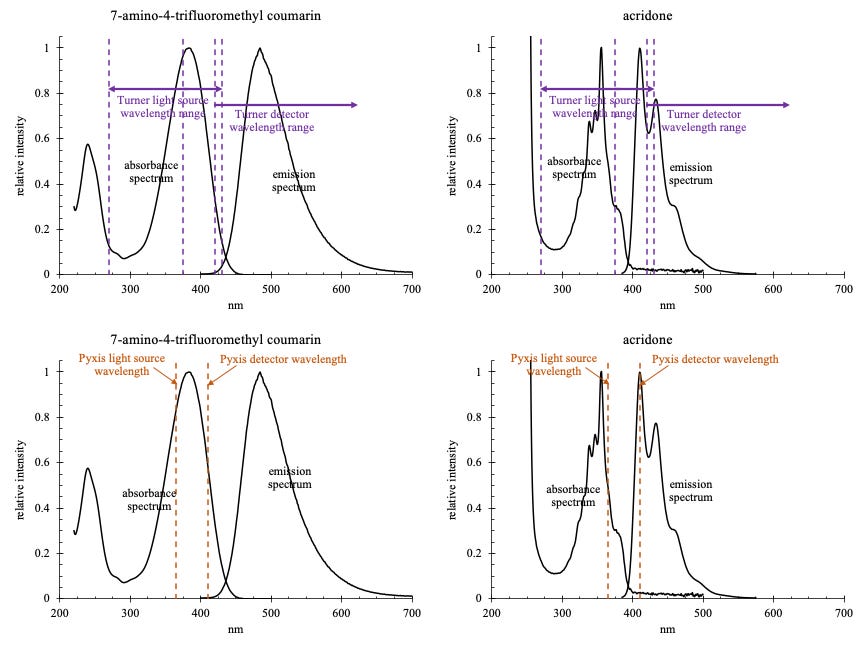
Shown here are absorbance and emission (fluorescence) spectra for 7-amino-4-trifluoromethyl coumarin (left) and acridone (right). Overlaid on the plots are the light source and detector wavelengths of the Turner (top) and Pyxis (bottom) instruments.
The absorbance and emission peaks for 7-amino-4-trifluoromethyl coumarin overlap very well with the light source and detector wavelength windows of the Turner fluorometer, accounting for the strong response. The acridone emission peak has partial but still good overlap with the Turner’s detection window.
Although the Pyxis light source wavelength aligns well with the 7-amino-4-trifluoromethyl coumarin absorbance peak, the Pyxis detector wavelength does not overlay the 7-amino-4-trifluoromethyl coumarin emission peak. In contrast, good alignment is evident for both the Pyxis light source and detector wavelengths and the acridone absorbance and emission (fluorescence) spectra. This accounts for the difference in responsiveness of the Pyxis fluorometer to 7-amino-4-trifluoromethyl coumarin compared with acridone.
This provides a good example of how spectrometers can be tuned through the use of optical filters - lenses that selectively block and transmit different wavelengths of light. We’re exploiting this in the companion project to develop tunable spectrometers for measuring background DOM as well as target adsorbates.
How strong of a fluorescence signature is “strong enough” for our purposes?
The screening test was done on each of the 14 candidate compounds at a concentration of 100 ppb (100 ug/L). That’s at the upper end of our working range for micro(pollutants). In our biochar testing method we want to observe the removal of the micro(pollutant) surrogate compound. So we need to be able to quantify the compound over at least one, and much better two, orders-of-magnitude below this. An ideal surrogate adsorbate would be detectable by fluorescence over a working range of 1-100 ppb.
Thus we need a fluorescence signature that’s strong enough at 100 pbb such that at 100x lower concentration (~1 ppb) the fluorescence signal is still strong enough to be detected reliably above the detection levels of our fluorometer(s). The (Turner) fluorescence signals with 7-amino-4-trifluoromethyl coumarin and acridone are clearly strong enough to be able to resolve two-plus orders-of-magnitude lower concentration. With umbelliferone, quinizarin, and 4-methyl umbelliferone we could probably resolve over one order-of-magnitude (10-100 ppb). Likewise, the Pyxis fluorometer could resolve acridone over one order-of-magnitude. These responses could perhaps be increased with spectrometer optimization.
Based on this screening, 7-amino-4-trifluoromethyl coumarin and acridone are graduating to the next level of testing. This will include:
Quantifying fluorometer responses over a range of concentrations down to low-ppb levels and estimation of detection limits (in DI water)
Quantifying over ~48 hours (in DI water) to determine if compounds are stable enough for the duration of biochar and water testing experiments
Determining detection levels, stability, and signal-to-noise ratios for quantifying the compounds in natural water containing DOM
RSSCTs with biochars to determine compounds’ adsorbabilities along with our analytical capabilities for resolving and distinguishing measurements of compounds and background DOM
One important criteria for a unicorn molecule is that it be conserved during the course of adsorption testing. In other words, it needs to be stable - i.e., not reacting or breaking down by physical, chemical, or biological processes - while we’re performing an RSSCT, batch tests, or other tests with biochar or other adsorbents.
To determine compound stability over about a two-day period (a typical timeframe for many adsorption tests) I prepared solutions of acridone and 7-amino-4-trifluoromethyl coumarin in DI water and natural (lake) water at the following concentrations:
acridone: 0, 8, 16, 26, 52, 80 ppb
7-amino-4-trifluoromethyl coumarin: 0, 4, 8, 13, 26, 40 ppb
I placed the solutions on a shaker table and periodically sampled them over ~ 48 hours for analysis with our commercial spectrometers (Turner, Pyxis, and RealTech)
The sample of natural (i.e., containing DOM) water was obtained from lake and diluted using DI water to the following characteristics:
Turner, cDOM parameter: 28 ppb (as PTSA)
Pyxis (PTSA channel): BDL (around or less than 1 ppb as PTSA)
RealTech UVA254: 0.041 cm-1
NOTE: We are developing a standard biochar adsorbent testing protocol that specifies the use of natural water with a Turner cDOM value of 25-30 ppb (as PTSA). For my local reservoir, this typically corresponds to a UVA254 value of around 0.040 cm-1. This accounts for the fluorescence and UV spectrometer targets used here for compound stability testing.
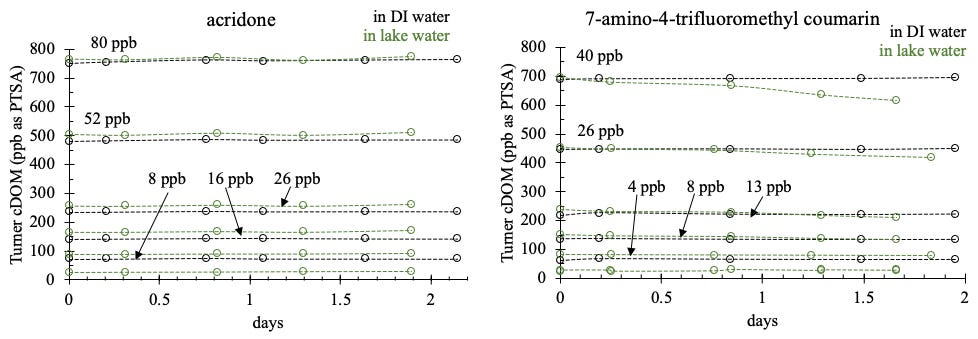
Here is a comparison of the stability of acridone (8-80 ppb) and 7-amino-4-trifluoromethyl coumarin (4-40 ppb) in DI water and lake water over about two days (quantified using the Turner cDOM parameter):
Key Observations
Both compounds are stable over two days in DI water.
Acridone appears stable over two days in lake water.
7-amino-4-trifluoromethyl coumarin concentration declines over two days, and the decline appears to be proportional to concentration.
This could possibly indicate biodegradation taking place. The lake water sample was filtered to remove particulates (which cause light scattering and interfere with spectrometer measurements) but was not sterilized so biological activity is possibly if not likely. I plan to repeat the experiment with an additive that stops microbial activity.
The decline in concentration over the first 24 hours is fairly small. Many adsorption tests (e.g., RSSCTs) can complete within one day, so the effects removal of 7-amino-4-trifluoromethyl coumarin by reaction and/or biodegradation might be negligible compared with adsorption process over short experiments (e.g., RSSCTs).
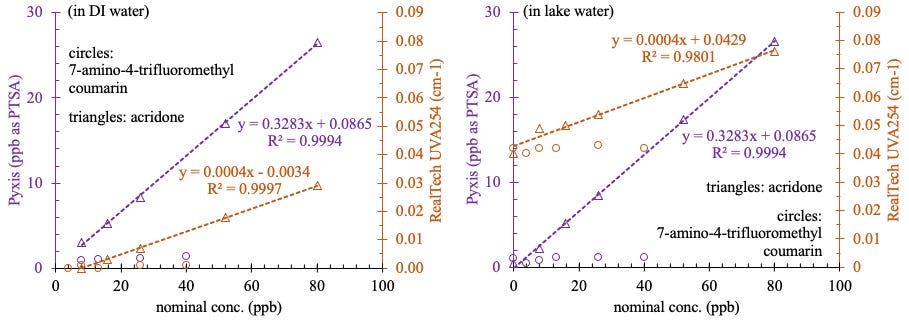
Here are the fluorescence (left-hand scale, purple) and UV absorbance at 254 nm (right-hand scale, orange) measurements for DI water (left) and lake water (right) solutions of acridone (triangles) and 7-amino-4-trifluormethyl coumarin (circles):
Key Observations
7-amino-4-trifluoromethyl coumarin does not appear to contribute fluorescence measurable by the Pyxis fluorometer (PTSA channel) or UVA254 in either DI water or lake water.
acridone appears to contribute to both the Pyxis-quantifiable fluorescence as well as UVA254 in both DI water and lake water.
Acridone fluorescence detectable by the Pyxis fluorometer is explained above. Acridone’s UVA254 signature (and the absence of a 7-amino-4-trifluoromethyl coumarin UVA254 signature) can be explained by comparing their respective absorbance spectra:
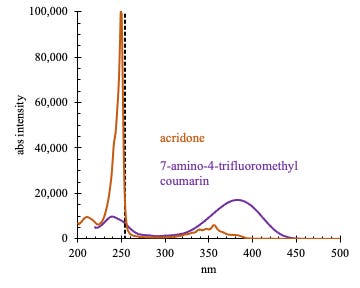
Acridone has a giant absorbance peak very near 254 nm. Comparatively, 7-amino-4-trifluoromethyl coumarin is insensitive to light at 254 nm.
Observations such as these inform our strategic choices in method development - since an important goal is to be able to distinguish between spectroscopic signals from DOM versus target surrogate adsorbates.
Repeat 7-amino-4-trifluoromethyl coumarin stability test in natural water, with sodium azide added to arrest microbial activity.
Repeat test solution preparation protocol, substituting ethanol for methanol as the initial solute.1
Conduct RSSCTs using natural (lake) water, biochar, and our two (so far) candidate unicorn fluorophores. Compare the results to our database of column studies using biochar and target pollutants of concern such as PFAS and herbicides.
From above…
Repeat 7-amino-4-trifluoromethyl coumarin stability test in natural water, with sodium azide added to arrest microbial activity.
My sodium azide supplier fell through so I have not been able to do this yet. However, I thought of a work around that’s possibly or probably better.
Since 7-amino-4-trifluoromethyl coumarin seems to be “stable enough” over a period of up to 12-16 hours, fresh solutions could be prepared during experiments to offset the apparent degradation.
Also, sodium azide is fairly hazardous. I’ve often used it in the lab but would most likely want to avoid its use in field lab protocols if at all possible.
Repeat test solution preparation protocol, substituting ethanol for methanol as the initial solute.
I did a quick check on this, and yes, ethanol will work. The initial dissolution to form a concentrated solution of 7-amino-4-trifluoromethyl coumarin in ethanol seemed to have more undissolved solid material than in methanol. So methanol is the better choice, but ethanol will work if that’s what is available.
Conduct RSSCTs using natural (lake) water, biochar, and our two (so far) candidate unicorn fluorophores. Compare the results to our database of column studies using biochar and target pollutants of concern such as PFAS and herbicides.
I started this with 7-amino-4-trifluoromethyl coumarin in lake water (twice), but had column overpressure issues that forced me to shut down before completing the tests. No worries, I have a fix for this problem and will repeat in Ecuador in a few days’ time. (Gearing up to travel now…)
I tested two new promising “unicorn” molecules for their fluorescence signal strength and stability in natural water. One is a close cousin of the fluorophore described above, 7-amino-4-methyl coumarin. The other is a laser dye used in peptide analysis called coumarin 7.
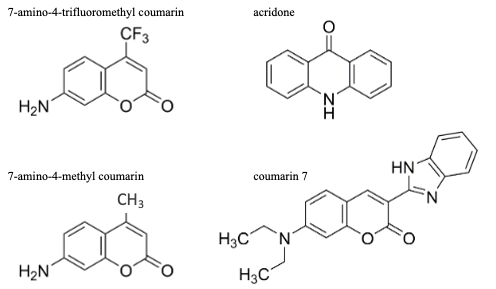
Top four candidate unicorn fluorophore adsorbates, so far.
The two new compounds show good stability in natural water over two days.
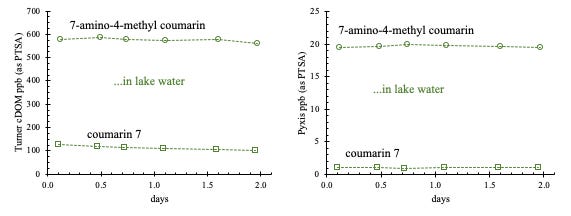
Candidate fluorophores at 70 ppb in lake water (UVA254 0.040 cm-1).
Interestingly, 7-amino-4-methyl coumarin is picked up with a moderately strong fluorescence signal by the Pyxis (narrow bandwidth) fluorometer. That might turn out to be a useful feature…
Neither fluorophore contributed UVA254 at these concentrations. That could help to distinguish them spectroscopically from the DOM background.
If travel goes OK I will be on the ground in Ecuador soon. We will get up and running right away running RSSCTs with these fluorophores in local surface waters. I will report out our findings here. Also, check in on our DIY spectrometers project as we will also be doing head-to-head performance tests between commercial and DIY units.
Thanks for following along with this project! Feel free to share it with anyone you think might be interested…
Background: Most of the candidate unicorn compounds are sparingly soluble in water. To generate test solutions ranging in concentration from approximately 1-100 ppb (ug/L) it is first necessary to prepare high concentration (100-1,000 mg/L) from which to make dilutions. For these initial high concentration solutions I have been using methanol since the test compounds have a higher solubility in partially-nonpolar solvents compared with water. My colleagues in Ecuador can obtain high purity food-grade ethanol (which they use for tinctures in their medicinal herb program). In Ecuador methanol is a controlled substance, perhaps because it is used in coca leaf processing. So I just need to verify that I can reproduce my results using ethanol as the initial solvent in place of methanol.
No posts
Comments
Nothing yet. Say the first thing.
Sign in to join the conversation.