
This article is dedicated to my subscribers who have graciously purchased subscriptions in support of my efforts to educate. Thank you all!
In my latest lecture on the Tom Nelson podcast (June 15th), I expanded on the themes introducted in my January 4th, 2026 article titled Beyond Milankovitch: Solar-Driven Atmospheric Dynamics in Neoglacial Evolution. The link to this podcast is included at the end of this article.
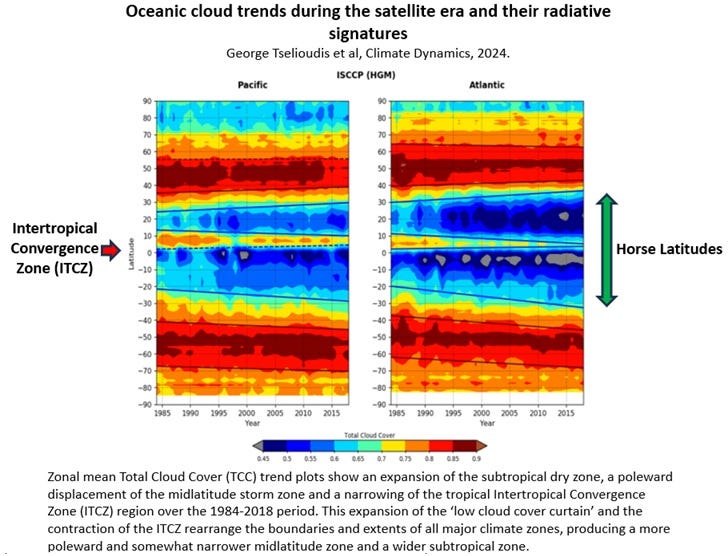
Here in this end of June article, I will include elements from my June 15th presentation and specifically will focus on the idea that changes in solar activity indirectly acts on the lower troposphere through a coupling with the Stratospheric Polar Vortext (SPV). The select body of evidence that I will present begins with the zonal mean cloud cover time series for the Atlantic and Pacific Oceans shown above.
The take home messages from this George Tselioudis et al study are:
The tropical Hadley Cells on either side of the Intertropical Convergence Zone (ITCZ) are expanding poleward.
The middle latitudes along which the Hadley Cells subsize (aka Horse Latitudes) are moving poleward as the Hadley Cells expand and as they do, marine stratiform cloud cover is declining. Remember, the Horse Latitudes are where the global deserts reside and the causative atmospheric factor is subsiding (anticyclonic) air masses along the higher latitude branches of the tropical Hadley Cells.
The deeply convective clouds (aka Trade Cumulus clouds) within the ITCZ are contracting.
The middle latitude Ferrel Cells are narrowing.
I have included in Figure 1, a cross section illustration of a single Hadley Cell bordering the ITCZ (left-hand side), to better visualize how cloud types vary within the low pressure upwelling zone of the ITCZ to the high pressure downwelling zone along the Horselatitude (right-hand side). This illustration conveys the basics of how atmospheric - oceanic circulation are coupled within the Hadley Zone and work to create two wildly different cloud types (i.e., Trade Cumulus vs Stratiform / Marine Boundary Layer clouds).
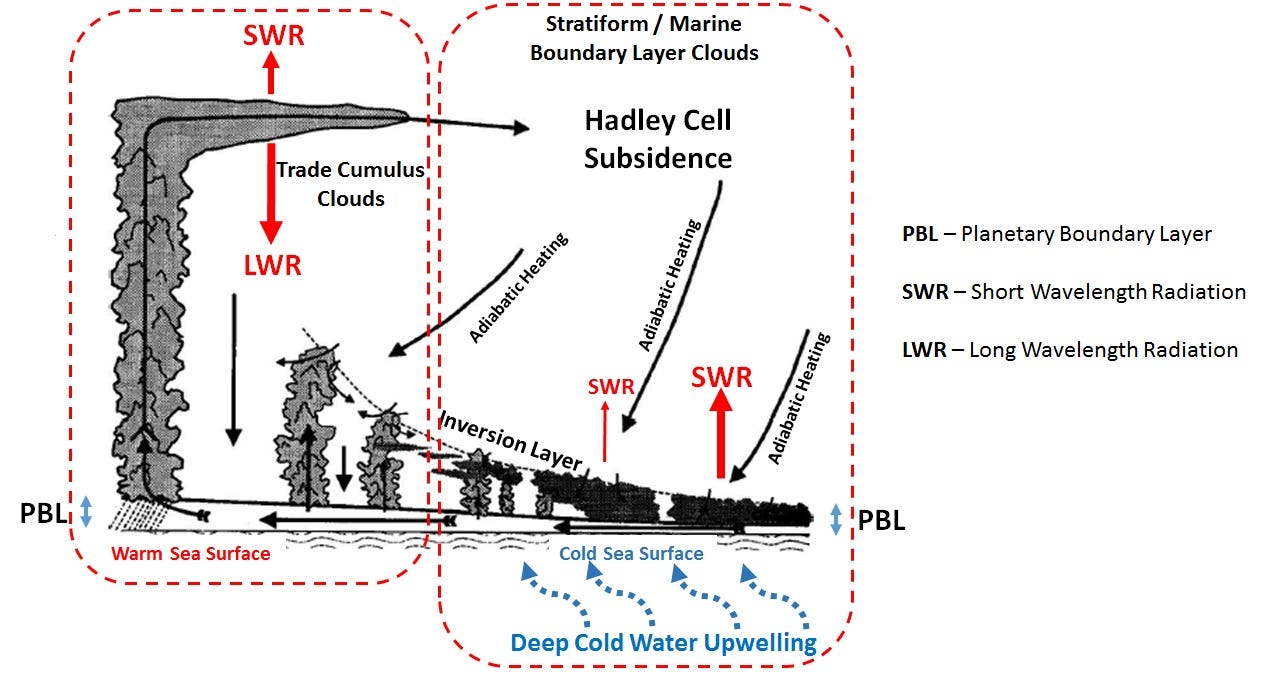
Figure 1. Cloud cover type variance within a cross section of tropical Hadley Cell.
With this model in mind, it is clear that the ITCZ latitudes are more efficiently ventilating LWR as deeply convective clouds contract, while the sub-tropical / middle latitudes are reflecting less in-coming SWR as marine stratiform cloud cover decreases. In other words, the Cloud Greenhouse Effect within the tropics is decreasing and as this occurs, the ocean is absorbing more sunshine.
The role of Walker Circulation dynamics in modulating the Trade Cumulus clouds and LWR flux out the top of the atmosphere was the topic of the recent article titled Clouds 850% Stronger Than CO₂: Unmasking the True Driver of Changes in Global Average Air Temperatures, where I showed that interannual variabilities of the Pacific Trade Winds is the control knob on heat flux out the top of the atmosphere.
This article will expand on the idea that marine stratiform clouds are declining as the Hadley Cells expand poleward and will argue that the famous Southern Annular Mode (SAM) serves as a proxy for this dynamic process. Specifically, I propose that a positively trending SAM Index implies that the Horse Latitudes in the Southern Hemisphere are migrating poleward and conversely that a negatively trending SAM Index is indicative of the migration of the Horse Latitudes towards the equatorial zone.
Keep in mind that while the ITCZ corresponds to the zone of maximum precipitation, the Horse Latitudes are the zones of minimum precipitation. Thus, why in the neoglacial sub-epoch of the Holocene Interglacial (last 4,200 years), the global deserts reside along the Horse Latitudes.
Once this proxy relationship has been established, we will be in a position to approximate how the Hadley Cell expansion - contraction may be evolved since the Medieval Warm Period (MWP) to present.
Finally, I will emphasize the role of changing solar activity in its influence on the Stratospheric Polar Vortex (SPV), together with the coupling between the SPV and SAM migrations, to introduce a plausible mechanism behind Global Brightening (Warming) versus Global Dimming (Cooling) within the Holocene Neoglacial sub-epoch.
Southern Annular Mode (SAM) Index
The Southern Annular Mode (SAM) index is calculated as the difference in zonal mean sea level pressure (SLP) between 40°S and 65°S.
What a Positive SAM Means:
•Strengthening of the circumpolar westerly winds (the Roaring 40s, Furious 50s, and Screaming 60s).
•Poleward shift of the westerlies.
•More zonal flow — the winds become more west-to-east (zonal) with reduced meridional (north-south) waviness.
•A deepening (strengthening) of the stratospheric thermal gradient between low latitudes (warmer) and high latitudes (colder) is a well-established causative mechanism for a positive trend in the SAM Index.
A negative SAM Index implies a reversal of these meteorological effects.
People living in Australia, are well acquainted with the utility of the SAM Index in making sense of climate variability within the southern half of the continent. As shown in Figure 2, when the winter season SAM is positive, the southern coast is droughty, while during a negative winter SAM gives rise to a shift in drought prone regions to the middle eastern coastlines.
Note the zonal shift occurs as a function of the proximity of the westerlies to the southern region of the continent.
The mechanism at play the Southern Hemisphere’s Horse Latitude is migrating in concert with the displacement of the Roaring 40s / Screaming 60s.
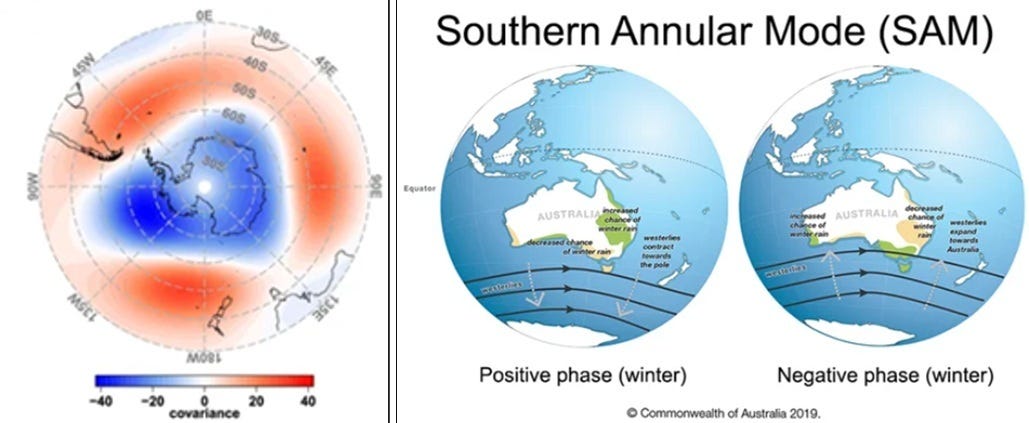
Figure 2. Representations of the Southern Annular Mode (SAM) Index and zonal migrations of the Roaring 40s / Screaming 60s.
The left-hand image in Figure 2 is included to help visualize the relationship between the higher pressure and lower pressure zones that exist along the latitudes (40S & 65S) over which the SAM Index is quantified. The red band is the high pressure zone and the blue is the lower pressure field.
I include Figure 3 to further build the mental picture of the cross sectional structure and dynamics of tropospheric circulation over the latitudes that the SAM Index quantifies.
The left-hand diagram shows the anticyclonic circulation and low cloud cover associated with the high pressure zone that is characteristic of the condition over the 40th parallel when SAM is in a positive state.
The left-hand diagram likewise shows that the 65th parallel is defined by a prevailing cyclonic-low pressure - higher cloud state.
The right-hand illustration shows the latitudinal band over which the SAM Index is measured, together with the classical representation of the the Hadley, Ferrel and Polar cells that exist in either hemisphere extending poleward from the equatorial zone.
Thus, Figure 3 helps in understanding what a positive SAM Index equates to in terms of structural changes in tropospheric circulation. As the cover image shows, the poleward migration of the Horse Latitudes, means this higher pressure - lower cloud - anticyclonic state is increasingly advancing towards the 40th parallel at which the SAM Index characterizing.
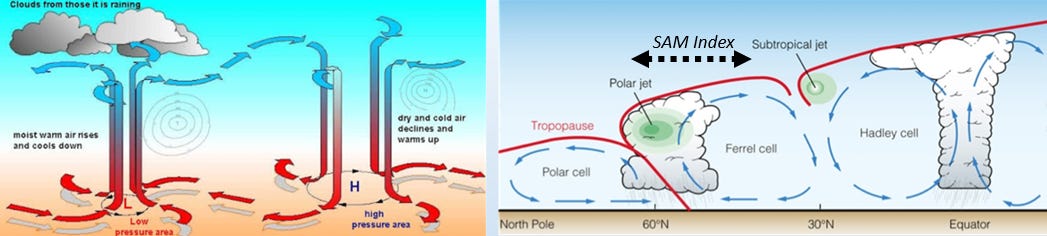
Figure 3. Cross sectional representation of the anticyclonic (40th parallel) and cyclonic (65th parallel) tropospheric circulation patterns that exist across the SAM Index zone.
Figure 4 shows the modern instrumental Marshall SAM index from 1979 to 2018 and Figure 5 shows the 1,000 year reconstruction of the SAM Index by Abram et al. (2014).
Abram et al used a Composite Plus Scale (CPS) with nesting, a widely used paleoclimate reconstruction technique based on James Ross Island (JRI - 64th parallel) ice core deuterium isotope record (temperature proxy from the Antarctic Peninsula) normalized to the calibration period (1957–1995), which overlaps with and weighted by the instrumental Marshall SAM index.
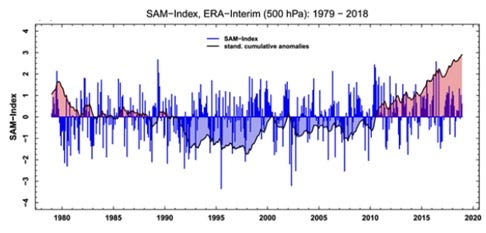
Figure 4. Modern Marshall SAM Index from 1979 to 2018.
The JRI lies off the northeastern tip of the Antarctic Peninsula in the Weddell Sea, Antarctica. This places it near the Antarctic Circle (66.5°S), in a region known for its relatively mild Antarctic climate and significant glacial and paleontological research.
Likewise included in Figure 5 are proxy surface air temperature reconstructions, using geochemical samples taken from selection locations from JRI and South America. These land based temperature reconstructions coincide with the 40th and 65th parallel latitudes over which SAM characterizes changes in mean sea level pressure.
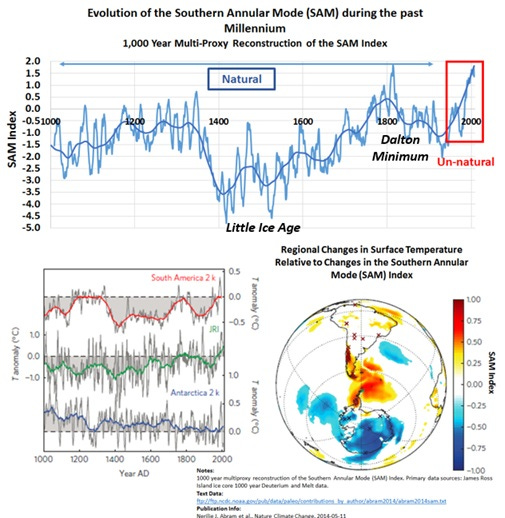
Figure 5. Abram et al 2014 reconstruction of the Southern Annular Mode since the Medieval Warm Period.
I took the liberty of adding supporting text to Abram’s 1,000 year SAM reconstruction, such as Little Ice Age, Dalton Minimum, Natural and Un-natural. While Abram et al maintains that the 20th century trend is a function of human CO2 emissions (i.e., Un-natural), I simply point to the rest of the time series as evidence that such a suggestion lacks merit.
The clear deeply negative state of SAM between 1400 and 1600 (Little Ice Age), together with the abrupt peak with subsequent decline around the end of the 18th and the beginning of the 19th century are features seen in the South American, JRI and SAM reconstructions.
The fact this tipping point coincides with the Dalton Minimum (1780 to 1830) in solar activity, deserves acknowledgement.
The fact that the most negative state of SAM over the 1,000 years is found to coincide with the Little Ice Age, stands in complete mockery of those who argue that the Little Ice Age was not truly global, but rather a regional climate state in the extra-tropical Northern Hemisphere.
We maintain that the Little Ice Age is due to the Maunder Minimum in solar activity.
This article would be deficient if I did not show that sea surface temperatures are likewise governed by the same environmental fundamentals that determine changes in the SAM Index. Figure 6 shows a sea coral reconstruction of near surface proxy temperatures within the Indian Ocean’s Agulhus Current. The Agulhas Current exists primarily between approximately 27°S and 40°S latitude alongside the African east coast, places it in the subtropical to subantarctic transition zone in the southwest Indian Ocean.
Note the remarkable correlation with the Abram et al SAM Index reconstruction across a full three century record.
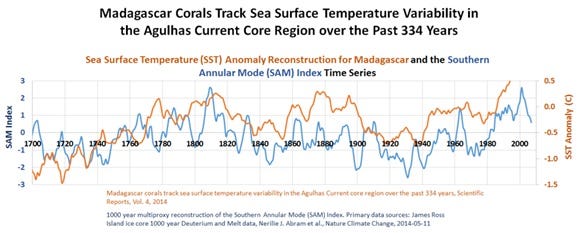
Figure 6. Madagascar Coral based sea surface proxy temperature versus Abram et al SAM Index reconstructions.
Similarly, we find a marked temporal coherence between the SAM Index and the North Atlantic Multidecadal Oscillation (AMO) in sea surface temperature (Figure 7). Two middle latitude sensitive climate measurements, located in either hemisphere, both showing a coherent multi-decadal pattern of change. \
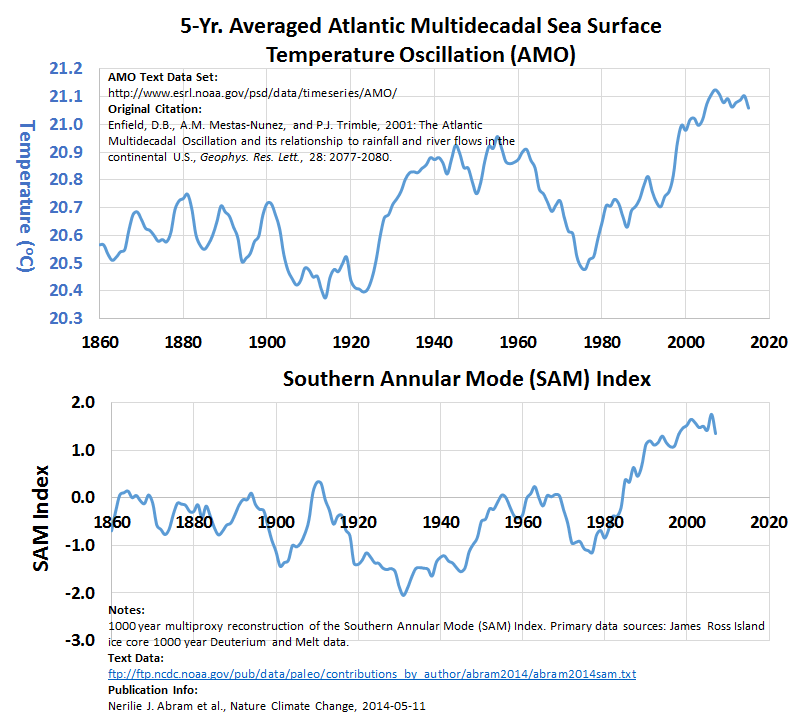
Figure 7. Comparing the Abram et al SAM Index to the Kaplan undetrended Atlantic Multi-decadal Oscillation (AMO) sea surface temperature time series.
In view of the data and fundamentals shown in this article, this should not seem surprising. What is true for the SAM Index is likewise true for the Northern Annular Mode (NAM) Index. However, as NAM is less studied, it is often the North Atlantic Oscillation (NAO) Index that we find in the literature.
In summary, we have now established that a positively increasing SAM Index means:
Marine stratiform clouds are declining in coverage and the tropical oceans are absorbing more sunshine, while the deeply convective cloud greenhouse effect over the ITCZ is declining and more effectively ventilating heat flux through the top of the atmosphere.
The Horse Latitude(s) is (are) migrating poleward as the Hadley Cells expand, effectively cannibalizing the Ferrel Cell(s).
Air and sea surface temperatures across the tropical to polar environment are increasing.
The Stratospheric Polar Vortex, Solar Activity and Middle Latitude Zonal / Meridional Flow
Moving onto the final mile of this marathon, I must begin this last section by reinforcing the idea that a positive SAM or NAM coincides with more zonal (west to east) westerlies, while a negative SAM or NAM implies the westerlies are more meridional (north to south) or undulating.
A more zonal westerly, also means its average velocity is higher in magnitude. Of course, meridional westerlies means they are slower moving and undulating between blocking high and low pressure modes along the middle latitudes.
Figure 8 is introduced to aid the mind’s eye.
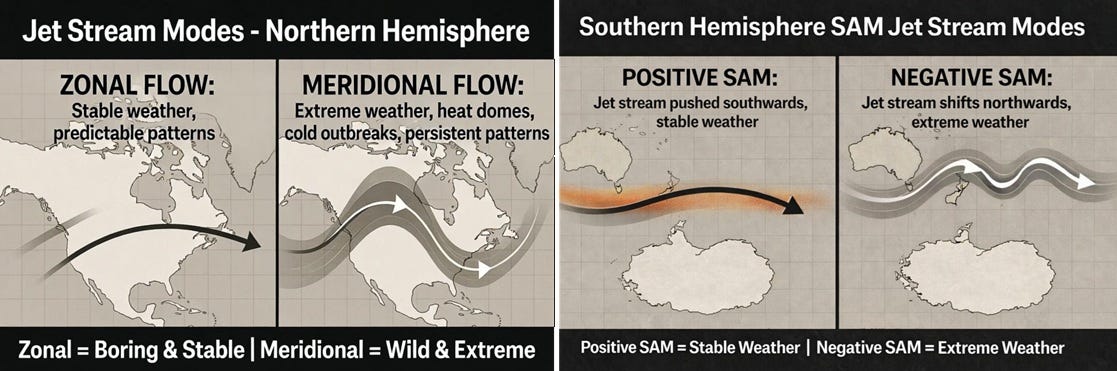
Figure 8. Middle latitude westerlies moving in zonal versus meridional modes.
Now that we have that basic definition covered, it is now time to establish the underlying physics that links these modes of middle latitude circulation with the Stratospheric Polar Vortex (SPV) and the ever changing activity of our G-type Main Sequence star.
While we do, keep in mind that we have established that the Hadley Cells and their culumnus / marine stratiform clouds are changing in coverage across the tropics as the middle latitude position, strength and zonal (meridional) characteristics of the Westerlies vary over time.
Figure 9 represents a demographic of studies, which argue that the Little Ice Age that argue that iceberge calving rates in the North Atlantic and glacial advance records from this climate regime correspond with low states of solar activity and enhanced meridional flow of the middle latitude westerlies. Shindell et al maintained that the defining characteristic of the Little Ice Age was the emergence of higly resilient low pressure troughs and low pressure ridges (meridional flow) across the extra-tropical Northern Hemisphere.
High resilience implies they slowly move eastward.
A highly resilient winter low pressure (Arctic) system was deadly during the Little Ice Age, as dispatchable natural gas heating and electricity were non-existent.
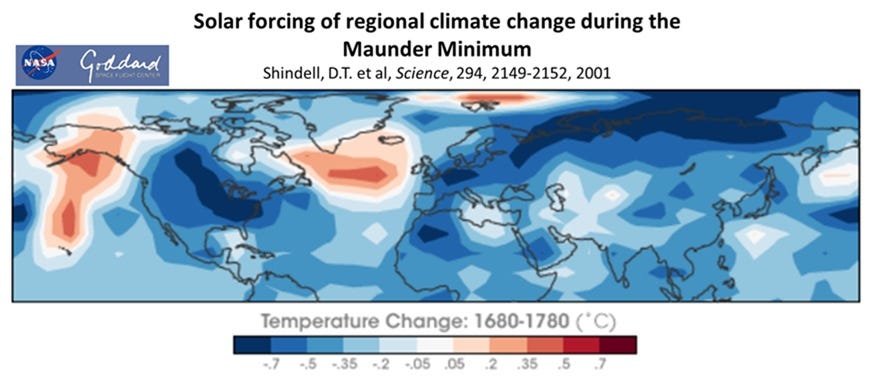
Figure 9. Literature example arguging the Little Ice Age was driven by solar activity modulated changes in the Stratospheric Polar Vortex (SPV).
The mechanism commonly invoked is the well known coupling between the SPV and the lower troposphere middle latitude westerlies.
Stratospheric Polar Vortex (SPV) - Tropospheric Coupling
The first and most important principle to understand is that any top-down solar perturbation of the stratosphere that results in a steeper equator-to-pole temperature gradient in the stratosphere gives rise to an increase in the thermal wind shear / velocity of the circumpolar westerly winds (aka SPV) in the stratosphere.
This strengthened SPV then propagates downward into the troposphere (stratosphere-troposphere coupling), resulting in:
Stronger, more zonal, and more poleward-shifted tropospheric westerlies (e.g., Roaring 40s / Screaming 60s).
Higher sea level pressure along mid-latitudes and lower pressure over Antarctica → positive SAM index.
A rudimentary analogy is the SPV is akin to a stratospheric tornado and as the energy of the tornado increases, its bottom reaches down to the lower troposphere and draws in the troposphere and specifically the Hadley Cells, towards higher latitudes.
Figure 10 attempts to convey some of these basic ideas with specific application to understanding the relationship between the SPV and the SAM Index. The idea that a strong SPV gives rise to more zonal westerlies and a weaker SPV produces a negative more waving (meridional) westerly field, is shown, together with the time lag between cause and effect.
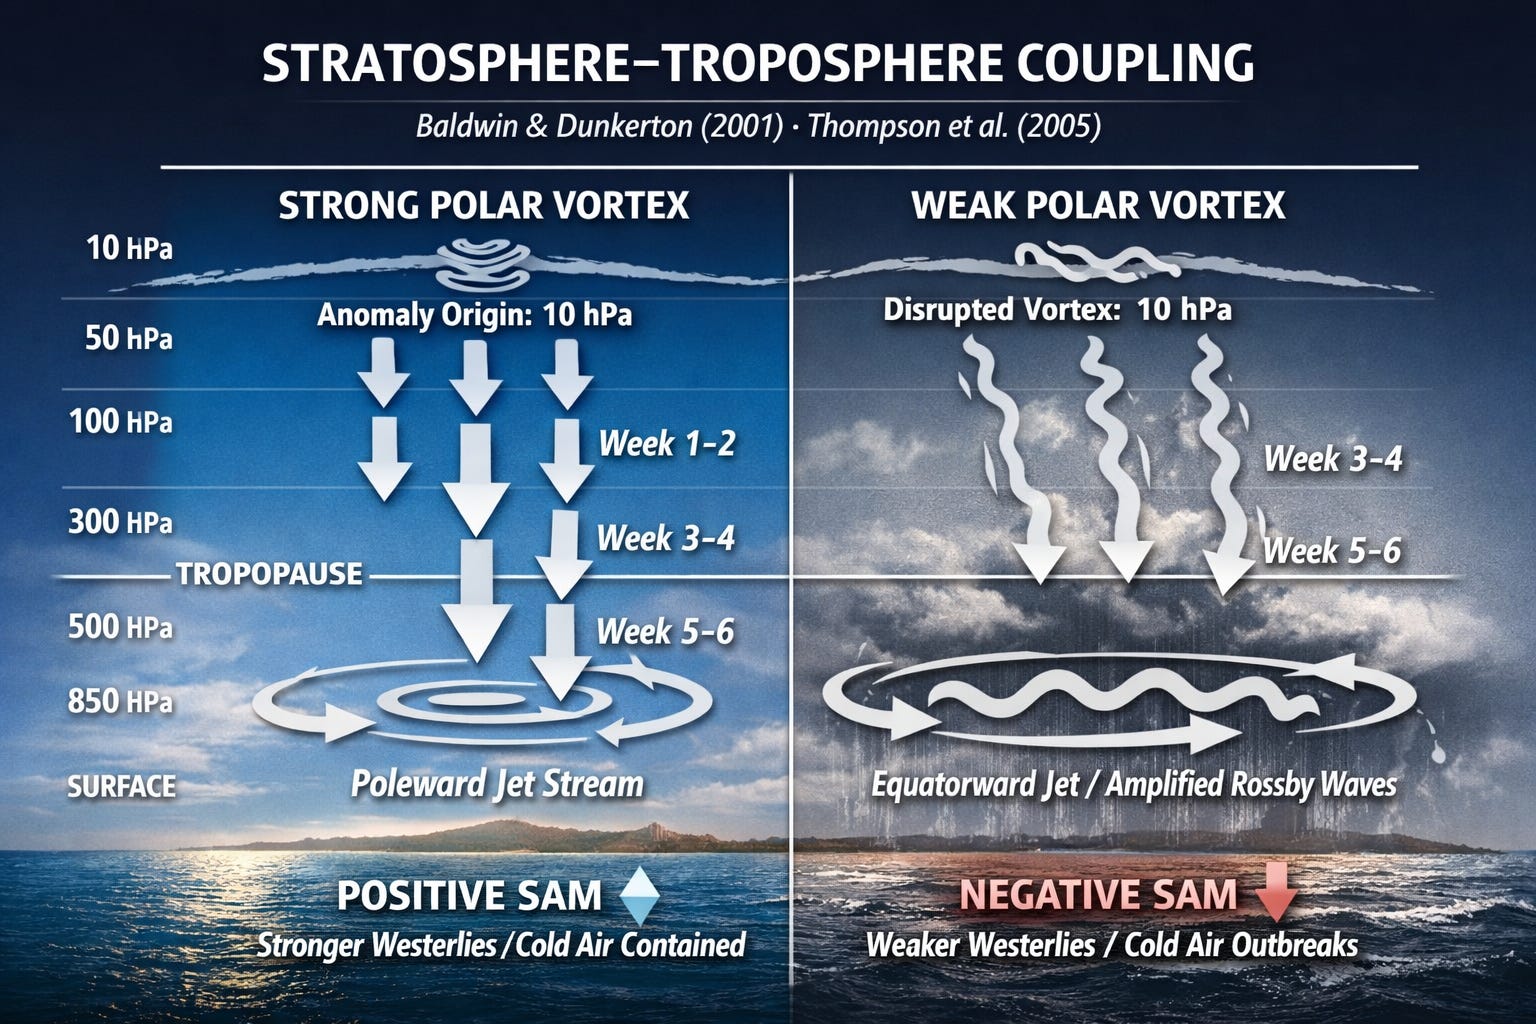
Figure 10. Illustration conveying the underlying physics specific to Stratospheric - Tropospheric Coupling in the Southern Hemisphere.
One of the first two most common factors at play in modulating the stratospheric equator to pole thermal gradient is the solar activity modulated UV / EUV intensity influence on the exothermic Chapman Cycle (O + O2 - > O3). During periods of high solar activity or sunspot numbers (SSN), UV / EUV intensities can increase by upwards of 50%.
As the equatorial latitudes receive more UV / EUV radiation than polar latitudes, the SPV strengthens and the stratospheric thermal gradient increases as SSN peaks. Figure 11 conveys these ideas and acts to reinforce how solar activity ultimately gives rise to changes in tropospheric circulation in the Southern Hemisphere.
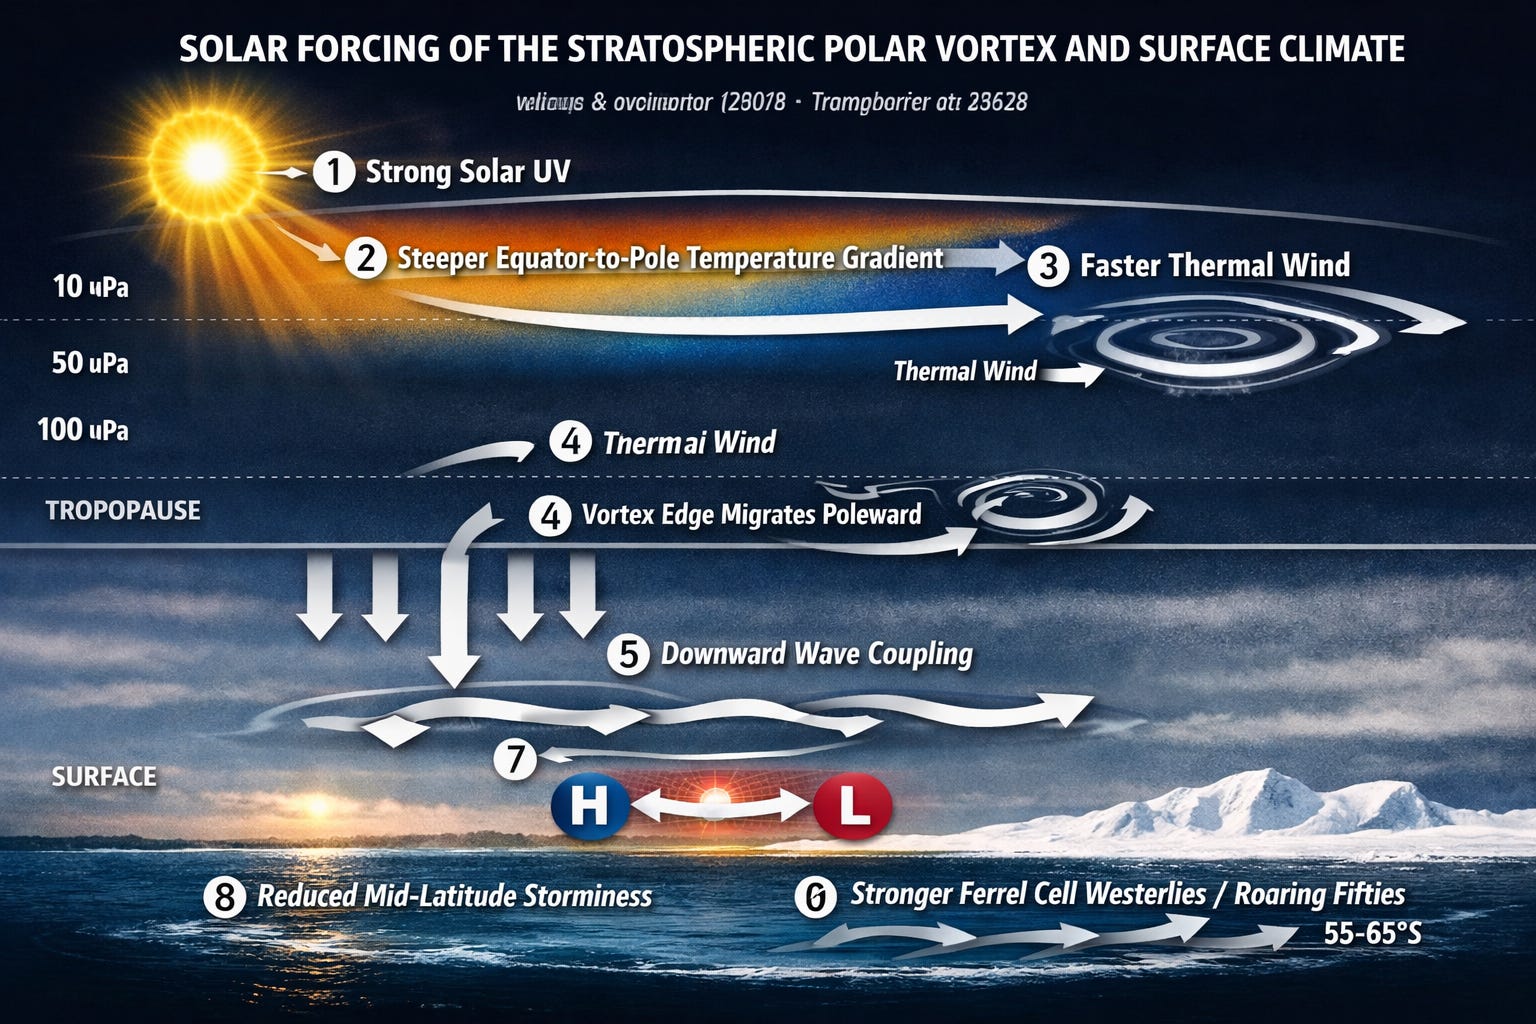
Figure 11. Illustration conveying the role of solar activity modulated changes in EV intensity incident on the stratosphere and thus influencing both the SPV and SAM Index.
The second known mechanism that links changes in solar activity to increased SPV strength is known as Energic Particle Precipitation (EPP). EPP is closely linked to the Aurora Borealis (Northern Lights) and Aurora Australis (Southern Lights).
EPP is in essence the capture and transport of charged particles (e.g., electrons, protons) in the solar winds ejected from the Sun’s surface during high activity storms, which become trapped in the Earth’s geomagnetic fields emanating from its polar regions. As these charged particles drop down into the stratosphere they increase the stratospheric equatorial to polar region temperature gradient by quenching the exothermic Chapman Cycle within the eye of the SPV.
Figure 12 conveys these basic ideas and highlight the relvance of the Earth’s geomagnetic field and Sun’s solar storm activity in modulating the SPV strength.
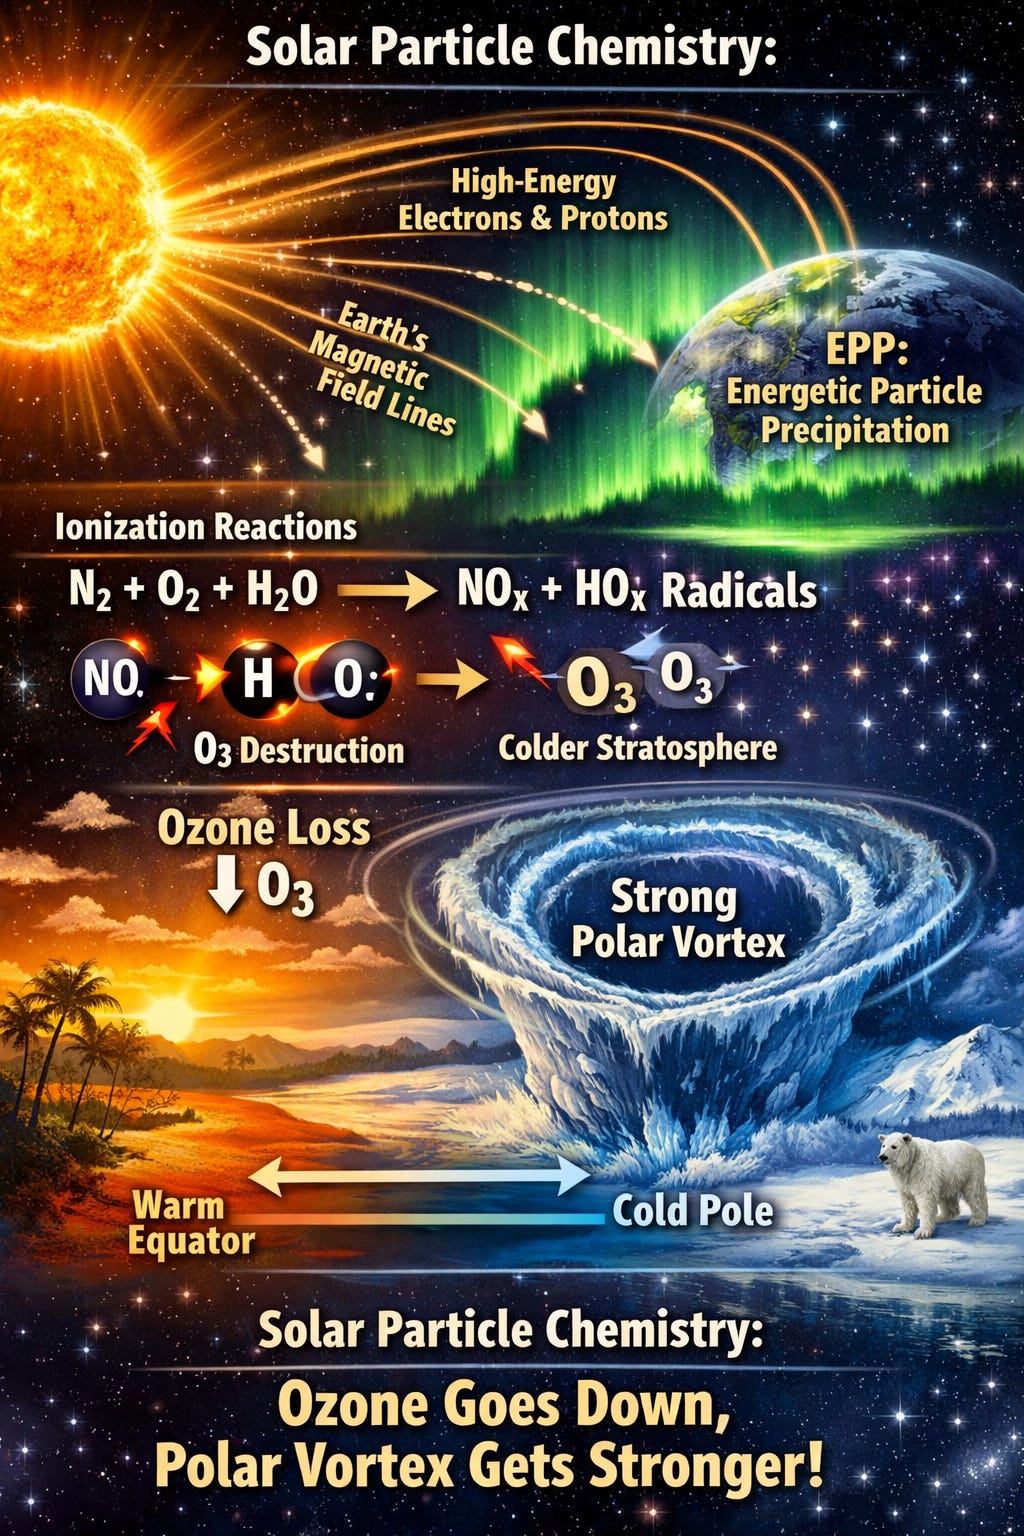
Figure 12. Illustration highlighting the known relationships between solar activity and solar winds modulated rates of energetic particle precipitation (EPP) and the strength of the Stratospheric Polar Vortex.
Conclusion
The evidence presented throughout this article converges on a single, coherent framework: solar variability modulates the stratospheric polar vortex, which in turn governs the Southern (Northern) Annular Mode and the migration of the Horse Latitudes. A positive SAM reflects a strengthened SPV and more zonal westerlies, driving the subtropical high‑pressure belt poleward and reducing tropical marine stratiform cloud cover over the Pacific and Atlantic oceans.
This dynamic enhances oceanic absorption of shortwave radiation by the oceans and accelerates global brightening. Conversely, a negative SAM corresponds to weakened solar forcing, a slackened SPV, and more meridional flow—conditions that favor persistent troughs, expanded cloud fields, and global dimming.
Across millennial reconstructions, from the Medieval Warm Period through the Little Ice Age to the present, the SAM Index mirrors solar‑driven oscillations in atmospheric circulation and oceanic heat flux. These findings underscore that the interplay between solar activity, stratospheric dynamics, and tropospheric structure is not peripheral—it is central to understanding Holocene’s neoglacial sub-epoch’s climate evolution. The SAM thus stands as a powerful proxy for tracing the rhythm of solar‑atmospheric coupling that defines the waxing and waning of Earth’s thermal equilibrium.
Longer version Tom Nelson link:
No posts
Comments
Nothing yet. Say the first thing.
Sign in to join the conversation.