
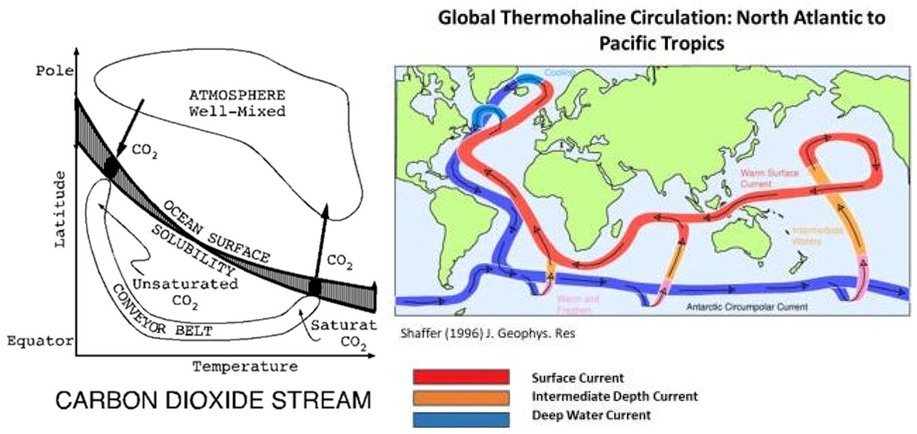
This article is dedicated to Mitch Sylvestre, CEO of Stay Free Alberta (SFA) / Alberta Prosperity Project (APP), who has been steadfast in his defiance of Ottawa’s climate fraud and its insane allegiance to Net Zero.
After the May 13th, 2026 ruling by Justice Shaina Leonard of the Alberta Court of King’s Bench ruled against the SFA petition on the grounds that the Alberta Government failed to consult Albertans living on reserves, regarding the Citizen’s Initiated Petition on the question of Alberta Independence, I felt it timely to once again set the record straight on the underlying philosophy of the Net Zero ideology.
I argue that the single greatest reason for Alberta’s present day Independence movement is Ottawa’s insistence that the production of food and energy represents an existential threat to Confederation and to Humanity.
For subscribers who are not Albertan, I encourage you to read The West Wants Out: How Ottawa’s Climate Fraud, Censorship Crusade, and Cultural Betrayal Are Driving Alberta Toward Independence to gain a deeper understanding of this complex and pressing topic.
In a recent article titled The Pasture Is Not a Methane Factory—It Is the Original Solar Panel, I argued that the Net Zero view of modern agriculture is akin to a mental disorder.
Likewise, in 2026 I wrote a two part series titled From Lambing Fields to Deep Oceans and Plate Tectonics: A New Take on CO2 and Climate Reality and Pacific Upwelling, Not Fossil Fuels: The Dominant Driver of Tropospheric CO2 Growth where I challenged the claim that Humans are responsible for the 20th century growth in tropospheric CO2 concentrations.
In place of the Human centric model of the global CO2 cycle, I proposed the Meridional Overturning Mediated Carbon Cycle (MOMCC), which emphasizes the following:
Modern changes in tropospheric tropospheric CO2 concentration, also called the Tropospheric Growth Rate (TGR), reflect changes in the natural flux of CO2 from the Cold Tongue region of the tropical eastern Pacific.
The interannual changes in the TGR are indicative of the rate by which carbonic acid enriched deep water upwells and offgases, like opening a can of beer, and the natural process at work is Walker Circulation Dynamics.
Said deep water is enriched in carbonic acid through both the accumulation of subsiding - decaying lifeforms along the ocean’s surface and from geochemical exchange with the Earth’s Crust over the +2,300 year journey of the global thermohaline circulation (cover image) starting in the sub-polar North Atlantic and ending in the tropical eastern Pacific.
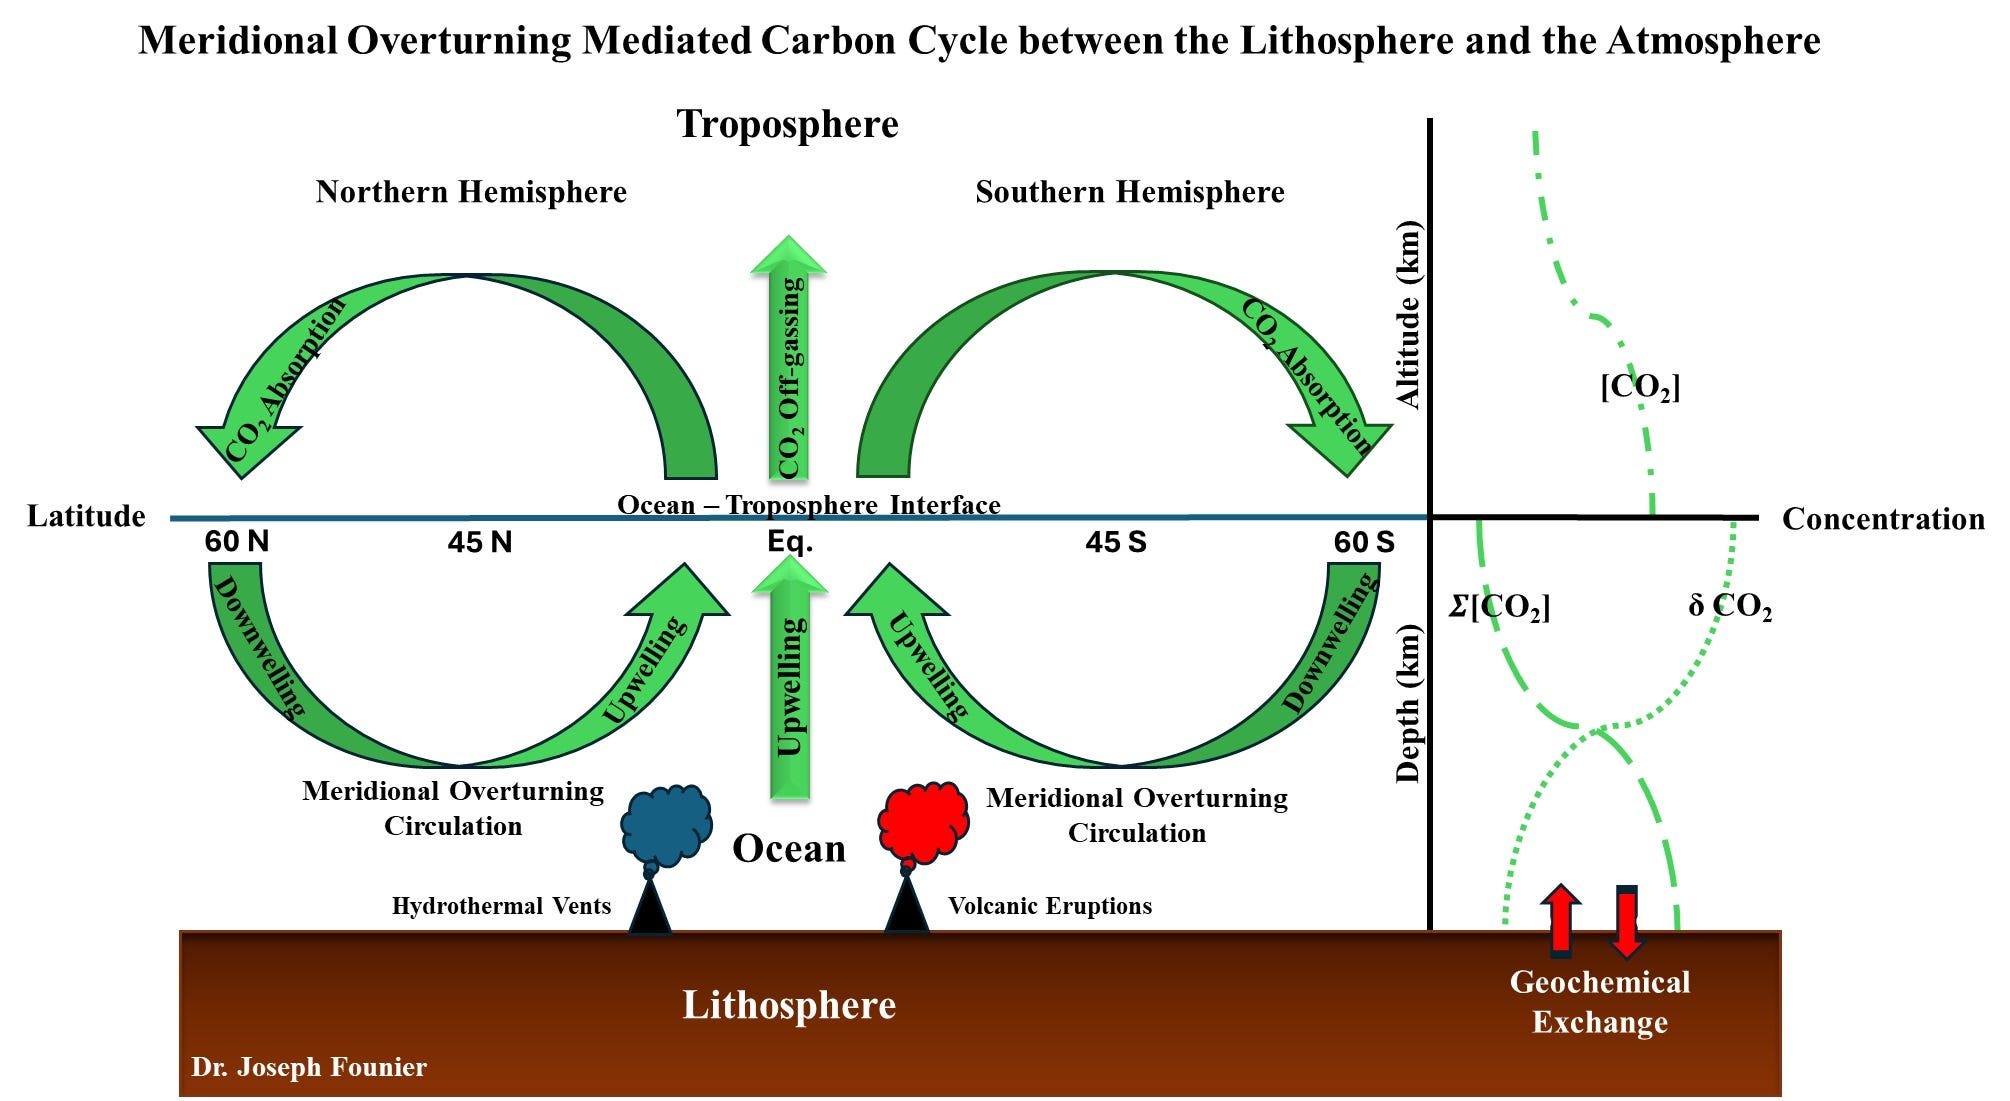
Figure 1. The Meridional Overturning Mediated Carbon Cycle (MOMCC) showing CO2 absorption along polar latitudes, CO2 offgasing along tropical latitudes and geochemical exchange between deep water and the Earth’s Crust.
For a deeper dive into the framework of the MOMCC, I encourage you to take the time to review the data and literature I shared in my 2026 two part series.
Here in this article, I will expand further on the MOMCC by emphasizing two main arguments.
Number One
Even though the majority of human CO2 emissions occur within the Northern Hemisphere, and there is extremely limited inter-hemispheric gas exchange within the lower atmosphere, the first derivative of the seasonally detrended CO2 concentration measured in either hemisphere, is almost perfectly matched on a month-over-month basis. This suggests that dominant CO2 emissions in both hemispheres arise from a common area source (i.e., Cold Tongue region) that is located along the latitudes where they collide and repell each other (aka Hadley Cell Convergence Zone).
Number Two
Comparing CO2 concentration time series obtained from Antarctic ice core samples to best estimates of global CO2 emissions from the 18th century to present, shows that Tropospheric CO2 concentrations began to rise 200 years prior to the Industrial Revolution.
1st Argument - Hadley Cell Convergence Zone (HCCZ) vs Tropospheric CO2 Concentrations
To begin this discussion, I must first help build a mental picture for why in the 1st argument, I suggest that there is extremely limited inter-hemispheric gas exchange wtihin the Troposphere. Figure 2 has been selected as it effectively demonstrates why this limited inter-hemispheric gas exchange exists.
The Hadley Cells, are the two largest counter-rotating air masses on the planet.
Note how both cells collide and convect along the equatorial latitude(s).
Further note how the Hadley Cell Convergence Zone (HCCG) migrates towards whichever hemisphere that is experiencing summer. This migration of the HCCG towards whichever hemisphere is warming relative to the other, is a consistent trend that is found across all time scales (e.g., Seasonal to Millennial).
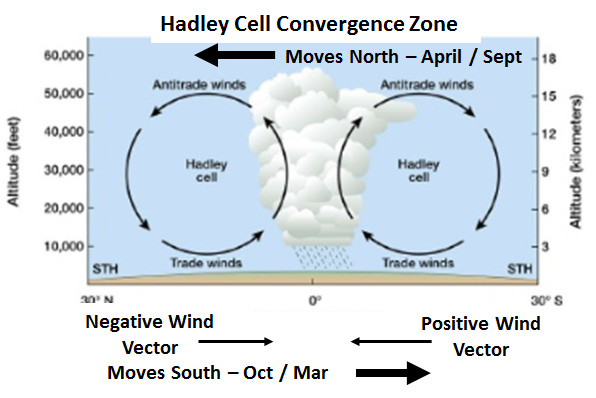
Figure 2. Structure and dynamics of the Hadley Cell Convergence Zone over the Seasonal Cycle.
Comparing Figures 1 and 2, we see that the HCCG is both the zone of maximum precipitation and CO2 offgasing.
Likewise, both figures show that the HCCG is the zone where both deep water and the lower troposphere experience the greatest convective upwelling. While the mechanics of deep water upwelling differ from HCCG upwelling, ultimately both are driven by the absorption of solar energy and thus are examples of convective overturning.
I will reiterate that the extremely limited inter-hermispheric gas exchange across the HCCG is a consequence of the counter-rotating structure of both Hadley Cells.
This is classical atmospheric physics.
Now that we have this first step laid out, it is time to highlight the long standing fact that the majority of Human CO2 emissions are located on the Northern Hemisphere side of the HCCG.
Figure 3 shows a classic representation of the latitudinal distribution of Human “carbon” emissions over the last half of the 20th century. This estimate shows that the vast majority of Human CO2 emissions are located between 30N and 50N.
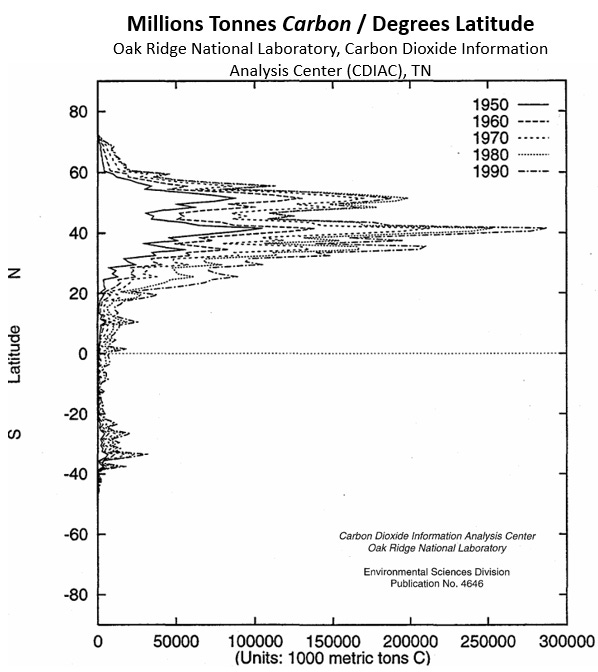
Figure 3. Oak Ridge National Laboratory estimation for historical “carbon emissions” by decade and by latitude.
This is extremely importnt to bear in mind when we move onto examine Tropospheric CO2 concentration data at surface stations in either hemisphere, such as Mauna Loa in Hawaii and at the South Pole.
Figure 4 shows CO2 concentration time series data from both Mauna Loa in Hawaii and the South Pole from 1958 to 2023. The most important feature that I want to draw your attention to is the fact that the monthly average values on either side of the HCCG are out of phase in how they change over the course of the Seasonal Cycle.
Specifically, Figure 4 shows that when CO2 concentrations near Mauna Loa are decreasing, they are increasing at the South Pole.
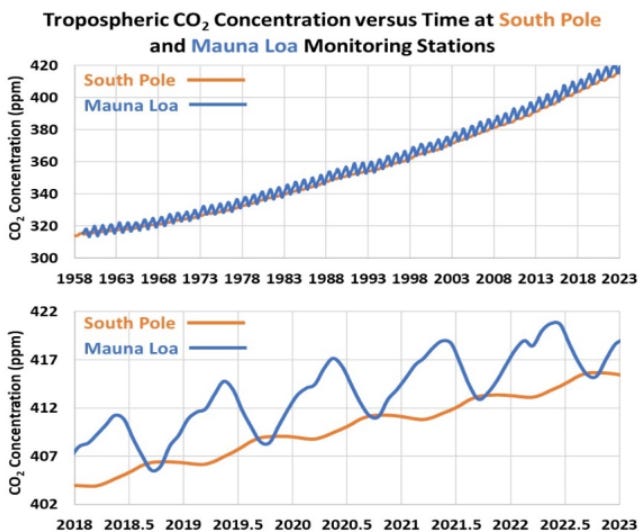
Figure 4. CO2 concentration time series data from both Mauna Loa in Hawaii and the South Pole from 1958 to 2023.
The reason behind the anti-correlation shown in Figure 4 is simply the fact that when it is winter in one hemisphere, it is summer in the other. Figure 5 shows a great 3-D plot for both CO2 and CH4 concentration versus latitude and time.
Note the biological attribution applied to changes in both gases (i.e., respiration vs photosynthesis).
During the summer months, photosynthetic uptake prevails over organic material respiration (decomposition) and both gases decrease in concentration, while during winter months respiration (decomposition) dominates and both gases increase in concentration.
The significant hemispheric difference in the seasonal amplitude is often argued to be due to the difference in land versus ocean coverage between the North and South.
Collectively, these observations are proof of the extremely limited inter-hemispheric gas exchange across the HCCG.
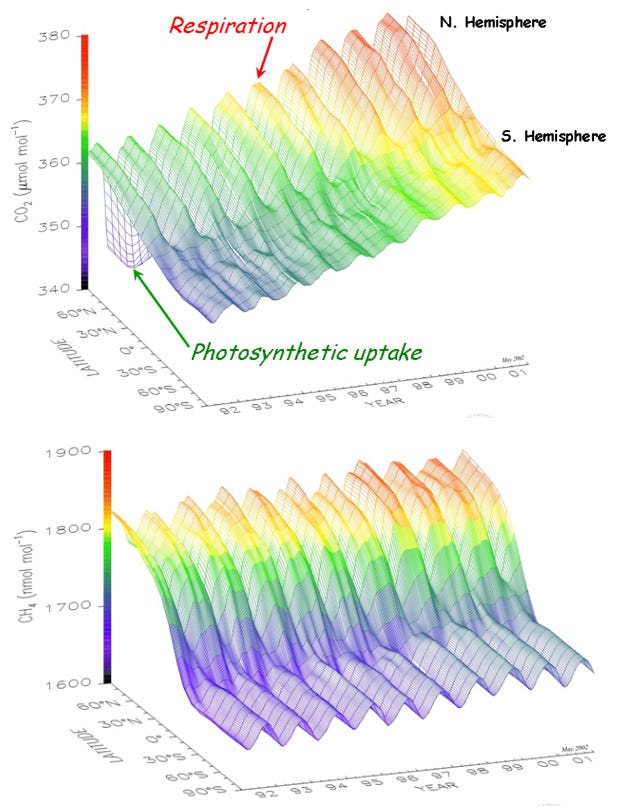
Figure 5. Tropospheric CO2 and CH4 concentration versus latitude and time
To examine the month-over-month change in Tropospheric CO2 concentration at a subharmonic level to the Season Cycle, we simply apply as 12-month rolling average low pass filter to both time series in Figure 4.
The application of a 12-month rolling average acts to filter out the Seasonal Cycle and this technique is often referred to as Seasonal Detrending.
Given the topic is emission rates, we then apply a month-over-month difference (first derivative) to the seasonally detrended data from Figure 4, which is then replotted in Figure 5. This technique reveals an entirely different relationship is shared between stations in either hemisphere that would not be apparent otherwise.
Figure 5 shows the Tropospheric CO2 Growth Rate (TGR) as measured at both South Pole and at Mauna Loa.
Note that both time series are now almost perfectly correlated.
Likewise, take note of how the TGR peaks during La Ninas and reaches a local minimum during El Ninos. See part I & II to gain a deeper understanding for why the TGR emulates Walker Circulation Dynamics.
Finally, take stock of the fact that the TGR went negative or approached zero multiple times between 1960 and 1993. This is a particularly damning feature, when we consider the mainstream claim that the growth in tropospheric CO2 concentration since the Industrial Revolution is entirely due to Human activity.
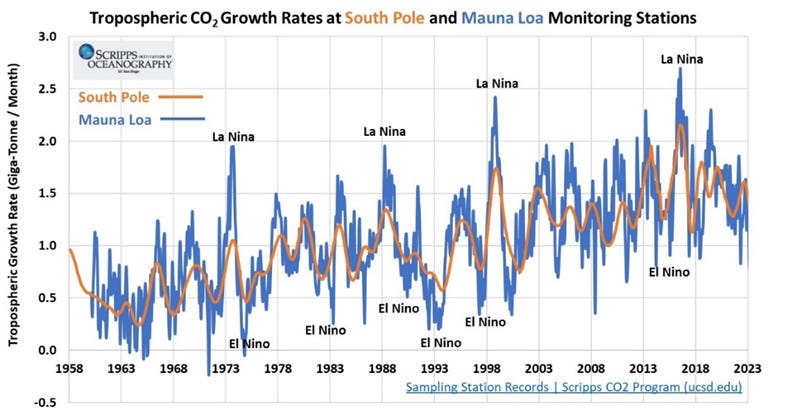
Figure 5. Tropospheric CO2 Growth Rate (TGR) as measured at stations in either hemisphere.
I argue here that the reason the TGR at both the Mauna Loa and at the South Pole surface stations are highly correlated is because they share a common area source. In atmospheric sciences, an example of an area source would be a lagoon, while a point source would be a smoke stack.
This area source is the tropical eastern Pacific Cold Tongue.
The Cold Tongue region gets its name from the simple fact that the carbonic acid enriched deep water that upwells in this climate zone is cold, as it last came in contact with the warm atmosphere some +2,300 years prior when it subsided to ocean bottom in the sub-polar North Atlantic.
Figure 6 is a great representation of the Cold Tongue, together with its little siblings along Africa’s tropical west coast and the northwestern Indian Ocean.
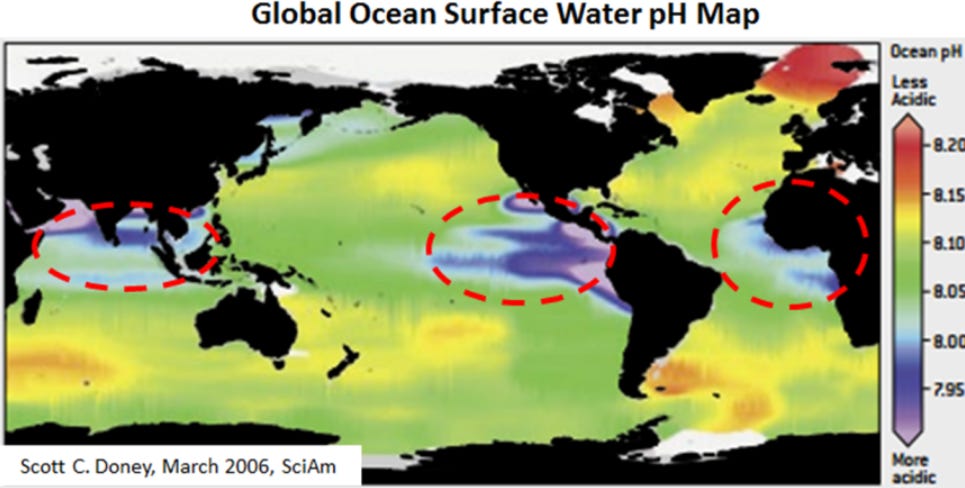
Figure 6. Global ocean surface water pH map, showing eastern tropical Pacific Cold Tongue climate regime and its smaller analogs along the tropical west coast of Africa and northwestern Indian Ocean.
Please note that the actual rate by which carbonic acid enriched deep water upwells in the Cold Tongue region is highly uncertain. Case in point is a 2025 study titled How Fast is the Mean Upwelling in the Equatorial Pacific Ocean? This publication produced new data and analysis suggesting that the actually deep water upwelling rate in the Cold Tongue zone is an order of a magnitude higher in actuality than has been estimated or assumed in climate models.
This of course implies that CO2 offgasing rates from this area source are also 10x higher than historically assumed.
In conclusion to this argument, I propose that the fact that the seasonally detrended TGR measured in either hemisphere is found to be almost perfectly correlated, while the Seasonal Cycle shows tropospheric CO2 concentrations in either hemisphere to be anti-correlated, is evidence that the common area source is the HCCG.
In otherwords, Human CO2 emissions, which are largely constrained to the Northern Hemisphere, have a lower order influence than rising CO2 emissions arising from deep water upwelling from the eastern tropical Pacific.
2nd Argument - The Industrial Revolution vs Growth in Tropospheric CO2 Concentration
This next and final data set is introduced to add further merit to the claim that the growth in Tropospheric CO2 concentration is natural. The data I share is publically available, but ignored.
Figure 7 plots the change in Tropospher CO2 concentration reported in the famous Antarctic Law Dome ice core samples versus the gold standard record (aka CDIAC) on human CO2 emissions during the 18th and 19th centuries.
Note that a 1 ppm rise in Tropospheric CO2 concentration is equivalent to 7.8 billion tonnes.
This plot clearly shows that Human CO2 emissions during the early stages of the Industrial Revolution came too late to the game and were over two orders of a magnitude smaller than the rise in Tropospheric CO2 .
To be exact, ice cores show the atmosphere gained 117 billion tonnes from 1625 to 1850, but by 1850, Human emissions had contributed a mere 0.6 billion tonnes.
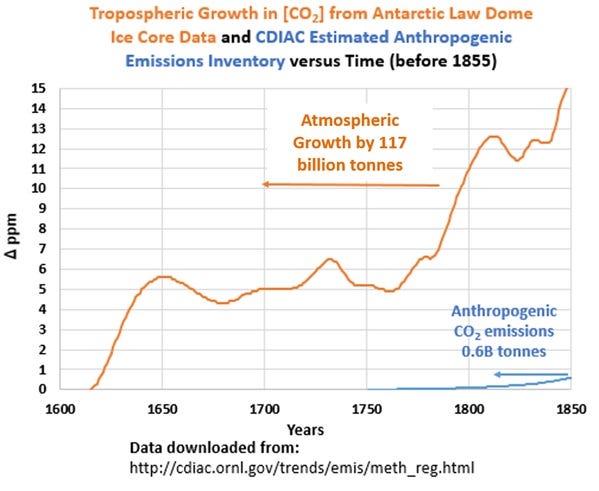
Figure 7. Comparison of the growth in Tropospheric CO2 from Anarctic ice core samples versus records of the early growth in Human CO2 emissions during the 18th and 19th centuries.
The challenge that remains for those who adhere to the strict Human centric view of “the Industrial Revolution was bad” should be rather apparent.
When the likes of the IPCC, CSIRO and Copernicus argue that 25% to 30% of today’s approximately 40 billion tonnes per year of CO2 emissions are absorbed by the oceans, how is it that our puny 19th century emissions were able to radically alter the natural carbon balance?
Were oceans fundamentally different back in the 18th and 19th centuries?
If the Human centric model is indeed correct, pre-Industrial oceans should have easily absorbed over 10 billion tonnes per year.
Considering that the World today is warmer and colder oceans absorb more CO2, how do we reconcile this argument with reality?
Conclusion
To Mitch Sylvestre and every Albertan who refuses to bow to this climate ideology: your courage is inspiring.
The push for Alberta independence is not rooted in rebellion for its own sake — it is a rational, necessary response to a federal government that has declared war on the very industries that sustain Canada.
Alberta must chart its own course.
And the future of our province demands that we reject Ottawa’s Net Zero fantasy and reclaim control over our resources, our economy, and our destiny.
The pasture is not a methane factory.
The Cold Tongue is not a smokestack.
Alberta will not be sacrificed on the altar of a failed ideology.
No posts
Comments
Nothing yet. Say the first thing.
Sign in to join the conversation.