
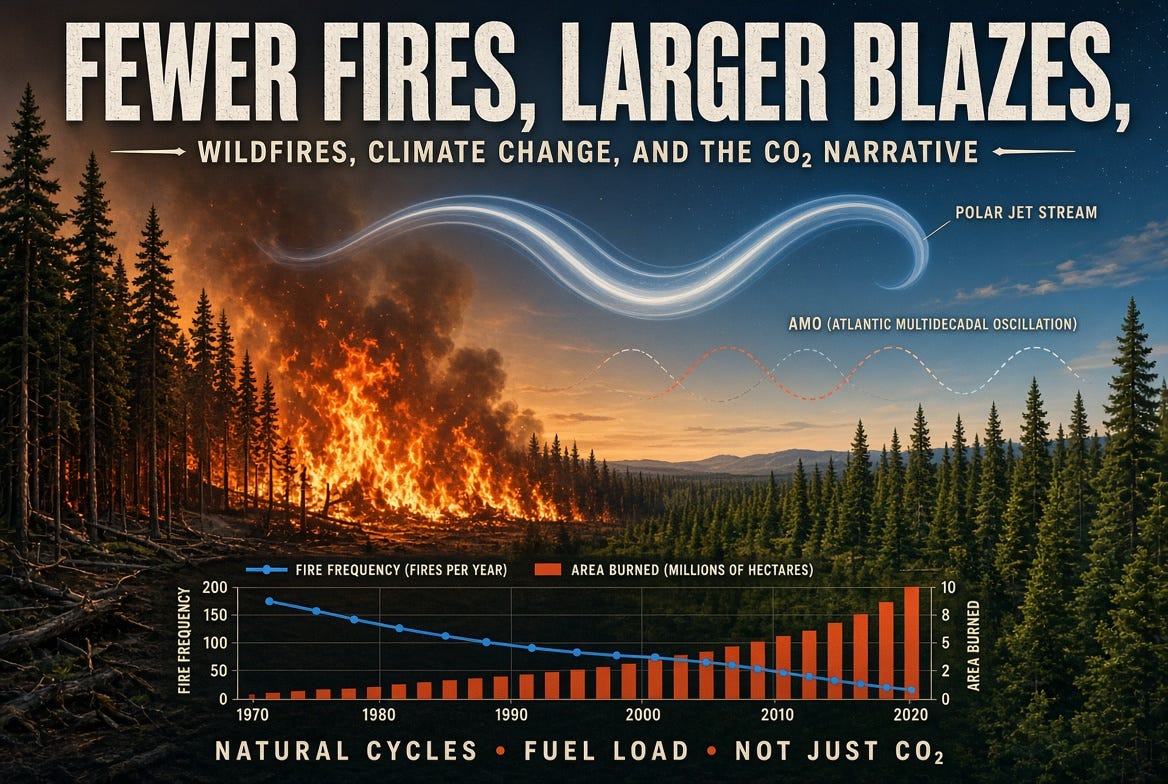
A Subscriber, who I admire and appreciate as a Friend, wrote me after my last Substack article and encouraged me to write on the topic of “Wildfires and Climate Change.”
We can hardly spend 5 minutes on social media or read mainstream media news over the past few summers, without hearing the repeated narrative that “rising temperatures cause forest fires” and of course, what is implied is that “warming is caused by human CO2 emissions.”
To me, the strategy is obvious and brilliant.
INTRODUCTION
In this article, I will focus on the following topics and by doing so, I hope you will come away with a greater understanding of this complex topic that is plagued with failed policies, disinformation and yes, complicated by Climate Change.
Climate Change is not evidence of Human Causation; it is largely of natural origination and humans are a minor perturbation to the Earth’s radiative balance.
The Plant Kingdom is rapidly expanding in area and density, driven by more optimal climatic conditions and atmospheric composition (e.g., CO2, NOx, H2O).
The Boreal Forest ecosystem requires reqular, low intensity fire to germinate and to recycle nutrients and older coniferous forests are lower biodiversity and lower overall productivity ecosystems.
On a global basis, both the per annum rate an total area burned by wildfires has been declining, driven largely by reductions across grassland, savana, brushlands and agricultural landscapes, while Boreal Forest fires appear to be on the rise.
Canada is an anomaly by showing a growth in total area burned as forest fire frequency has declined.
Now let us begin.
1.0 CLIMATE CHANGE IS NOT EVIDENCE OF HUMAN CAUSATION
I open with this one-liner, because of the open perversion of climate science with this popular narrative that Climate Change = Anthropogenic Global Warming.
Routinely, I argue that evidence of environmental change is hardly evidence of human causation. A new set of data that I have derived in an attempt to demonstrate these false claims are without merit is shown in Figure 1.
Figure 1 compares the Undetrended Atlantic Multidecadal Oscillation (AMO) in sea surface temperature (SST) versus the global ocean sensible plus latent heat flux anomalies and includes their linear regression plot and R-squared value. The following describes the steps I used in creating the global heat flux anomaly and the citations for the data source is embedded in Figure 1:
The global average ocean heat content (0 - 2000 meter depth) anomaly was converted to an equivalent sensible heat flux by dividing each year value by the area of the planet and the number of seconds in a year.
The global average precipitation anomaly was converted to an equivalent latent heat flux by converting inches to mass and multiplying by the heat of vaporization of water, followed by dividing each year by the area of the planet and the number of seconds in a year.
Summing both heat flux time series over 1955 to 2018.
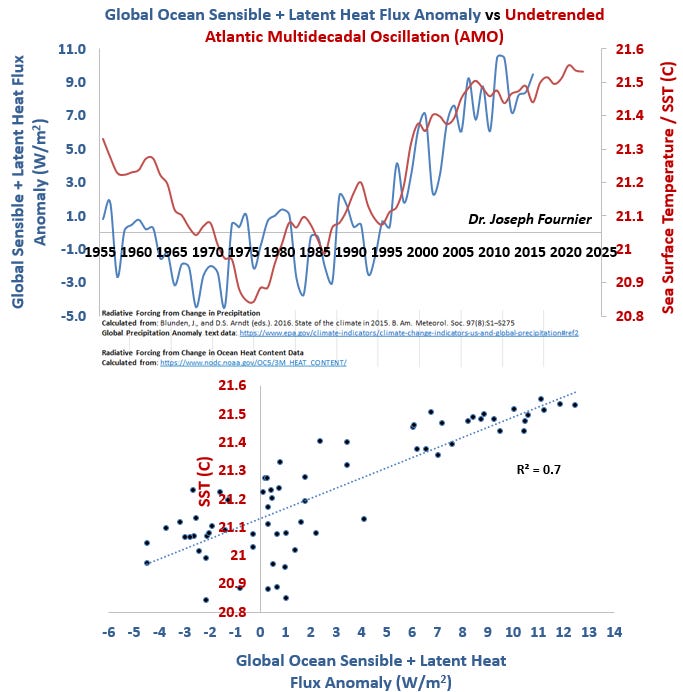
Figure 1. Global ocean sensible + latent heat flux anomaly versus the undetrended Atlantic Multidecadal Oscillation (AMO) and its regression line.
The regression line and its R-squared value of 0.7 obtained from the scatter plot of both of these data products shows that my global sensible + latent heat flux exhibits a comparable time dependence to the famous AMO time series.
This plot is not introduced to imply the AMO is causative of these globally estimated changes in ocean heat content and precipitation. Rather, it is used here to show that the rate of change of these two separate but related physical properties, follows a multidecadal cycle analogous to the AMO with a periodicity of 60 - 80 years.
Furthermore, the difference between 1970 and 2010 shows an approximate slope of 3.5 Watts per square meter per decade.
This later point is extremely important, for it represents the magnitude or rate by which the Hydrological Cycle accelerated over three decades - an effect.
When we examine the literature for estimates of the magnitude or slope of the CO2 downwelling IR radiation curve, produced by rising CO2, we find that this value increased by a mere 0.2 Watts per square meter per decade - a theoretical cause or force.
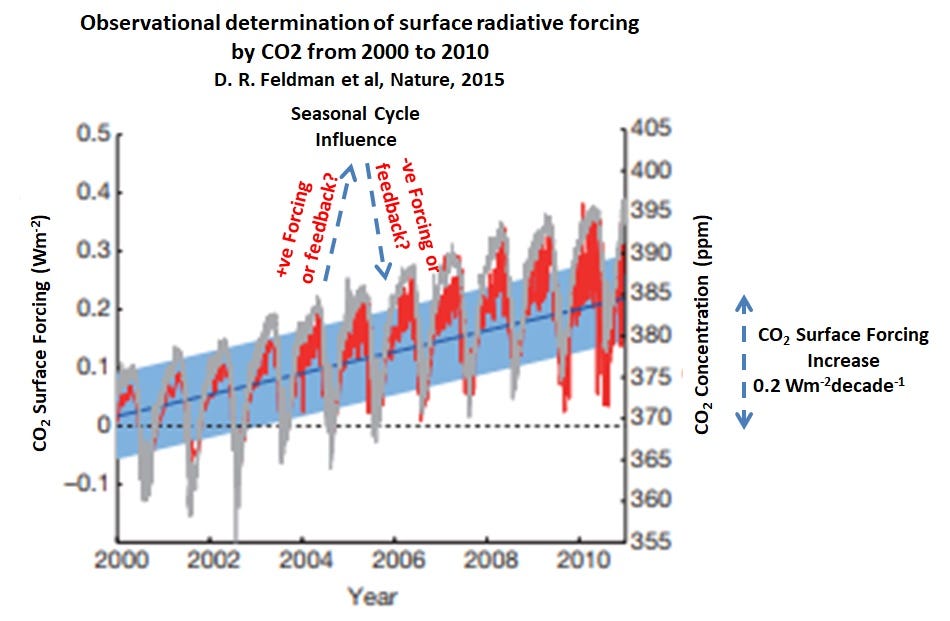
Figure 2. Measured rate of increase in CO2 downwelling IR radiation over the early 21st century.
So the trillion dollar question is how can a decadally increasing force of magnitue 0.2 give rise to an effect of magnitue 3.5?
That is well over an order of magnitude descrepancy and it represents a complete failure of logic in that is defies basic energy conservation principles.
Therefore, if we assume the tropospheric CO2 growth rate is entirely due to human influence, clearly Climate Change does not equal Anthropogenic Global Warming. I have written extensively on this topic and have argued that insufficient evidence to suggest we are responsible for rising tropospheric CO2 concentrations and that this measured trend is of natural origination.
2.0 THE PLANT KINGDOM IS RAPIDLY EXPANDING
The literature is extremely clear on the fact that the Plant Kingdom is rapidly expanding across every continent. The reasons for this trend are numerous and they include rising tropospheric CO2 concentrations, higher global average precipitation rates, warmer temperatures and elevated rates of NOx deposition.
Figure 3 shows the classical representation of the dependence of net photosynthetic rates on leaf - ambient temperature and tropospheric CO2 concentration.
This illustration by Bruce Dunn, from the University of Oklahoma, is commonly used to explain by CO2 injection into commercial greenhouses gives rise to higher yields and growth rates. The upper curve represents the net photosynthetic rate commonly observed at higher CO2 concentrations and it shows that the optimal photosynthetic state moves to higher temperatures.
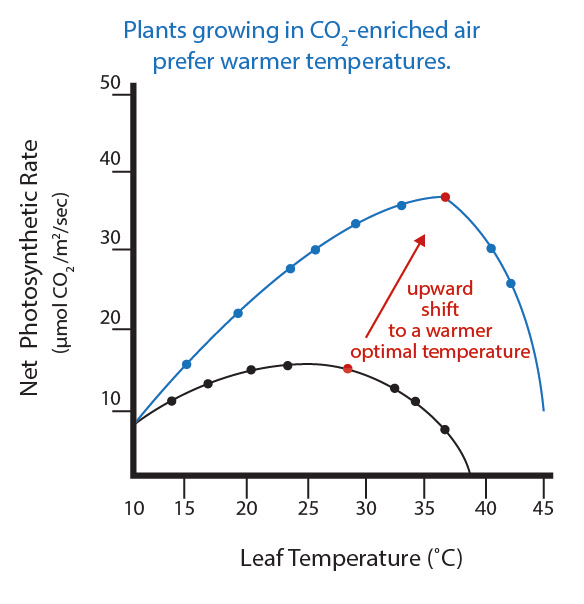
Figure 3. Relationship between leaf temperature and net photosynthetic rate at ambient and CO2 elevated condition in Populas grandidentata (Jurik et al., 1984). Redrawn by Vince Giannotti
Furthermore, Figure 3 illustrates why the Plant Kingdom is able to increasingly thrive under more arid conditions as tropospheric CO2 concentrations rise and why satellite measurements show many deserts are receding in the face of advancing plantlife.
Dan Zhu et al (2025) in their Nature Reviews publication argues that global mean vegetation greenness reached a record high in the year 2025, extending the multi-decadal upward trend. A total of 68.2% of vegetated land surfaces experienced greening, particularly in grasslands and croplands in the Southern Hemisphere and in northern mid-latitudes. Herbaceous ecosystems dominated the 2025 greening signal, with 72.1% of grasslands and 77.6% of croplands exhibiting greening. Greening hotspots observed in southern Africa, southern South America, northern Australia, Europe, central North America and northern China align with precipitation increases.
As discussed in my recent Substack article titled Hadley Cell Expansion and the Re-Greening of Africa, I show that numerous arid regions are experiencing expanding plantlife, where increases in both temperatures and precipitation are positively correlated.
This highlights that CO2 fertilization is not acting alone and in fact, as required by mass action laws applicable to photosynthesis, H2O is required in CO2 sequestration in plant matter.
Of course, any increase in atmospheric total water content and precipitation, will require an acceleration in the Hydrological Cycle, which is in essence what Figure 1 represents. Coincidently, Figure 4 illustrates this multidecadal change in the global ecosystem water-use efficiency anomaly (WUE), where WUE is the ratio of carbon gained by photosynthesis (gross primary production) to H2O lost through evapotranspiration.
Ca / VPD (red curve) anomaly is the ratio of the tropospheric CO2 concentration divided by vapor-pressure deficit, which captures the competing effects of rising CO2 (which tends to raise WUE) versus rising atmospheric dryness (VPD, which tends to lower WUE).
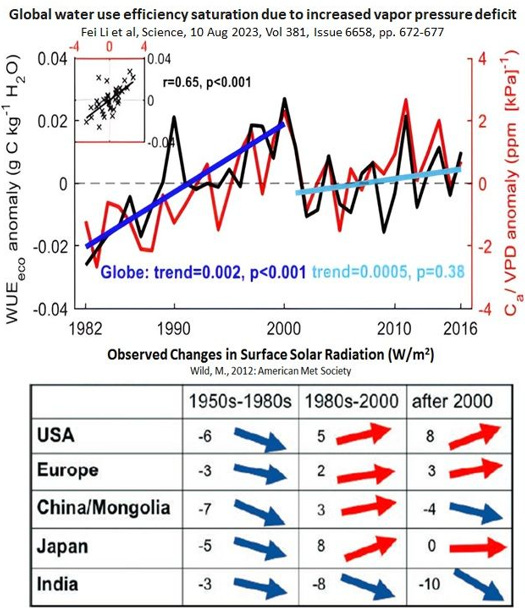
Figure 4. Changes in global photosynthetic water use efficiency and vapor pressure deficiency versus multidecadal changes in global sunshine intensity.
By juxtaposing Martin Wild’s 2012 data against Fei Li et al’s global photosynthetic water use efficiency and vapor pressure deficiency anomaly, I am arguing that it is changes in sunshine intensity or cloud cover - type that ultimately is driving the multidecadal changes in the Hydrological Cycle required to mass balance CO2 uptake through Global Greening.
Comparing Figure 1 and 4 reveals complementary periods of globally coherent steep changes (1980 to 2000) in sunshine intensity and global photosynthetic water use efficiency and vapor pressure deficiency, which level off in the first 10 to 15 years of the 21st century.
Much like the AMO, which is increasingly viewed as a proxy of the multidecadal changes in the North African and Indian Summer Monsoon.
Now we move away from global generalizations and switch gears to focus on the World’s largest terrestrial ecosystem - the Northern Hemisphere Boreal Forest that covers 11 % to 14 % of the Eath’s terrestrial surface.
Figure 5 shows a recent publication by Min Feng et al that makes extensive use of satellite remote sensing data to extrapolate the northward shift of the Boreal - Arctic Tundra interface over the period of 1985 to 2020. I will leave the details on their methods for you to explore.
What caught my attention from this study, was not just its hemispheric scale, but the fact that it like other studies, shows that the Boreal Forest is expanding northward by approximately 10 to 15 km per year over the 35 years of data examined.
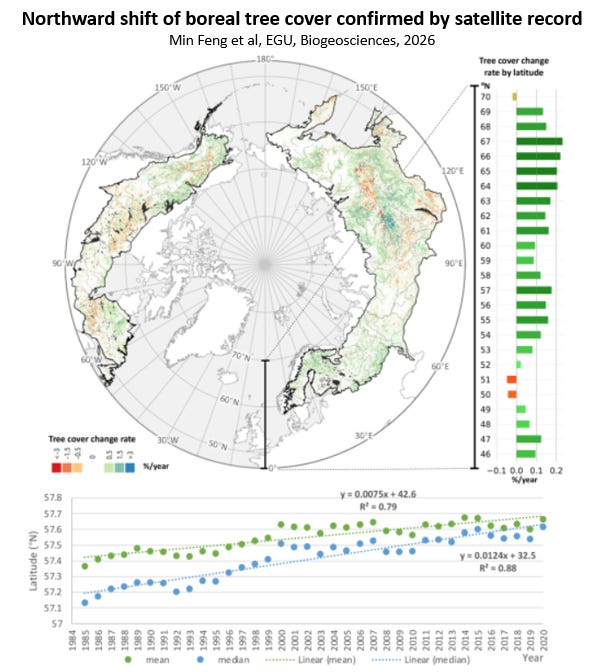
Figure 5. Spatial and temporal distribution of boreal tree cover change from 1985 to 2020. Map: significant net gains (green-blue) and losses (orange-red) of tree cover over the boreal biome. Bar chart (top-right): linear regression slope of tree cover over time, stratified by latitude. Time series (bottom): northward migration of the distribution of mean and median latitude of tree cover.
Note that the greatest expansion in tree cover in this study is found between 63N to 68N and that there is a stagnation - contraction along 49N to 52N.
The second example of a northward migration of the interface between the Boreal Forest and Tundra ecosystems is shown in Figure 6. This earlier study by Giona Matasci et al used similar remote sensing techniques to those by Min Feng et al and it too, shows an abrupt growth in younger above ground biomass and an expansion of canopy cover along the polar extent of the Canadian Boreal region over the time frame of 1984 - 2016.
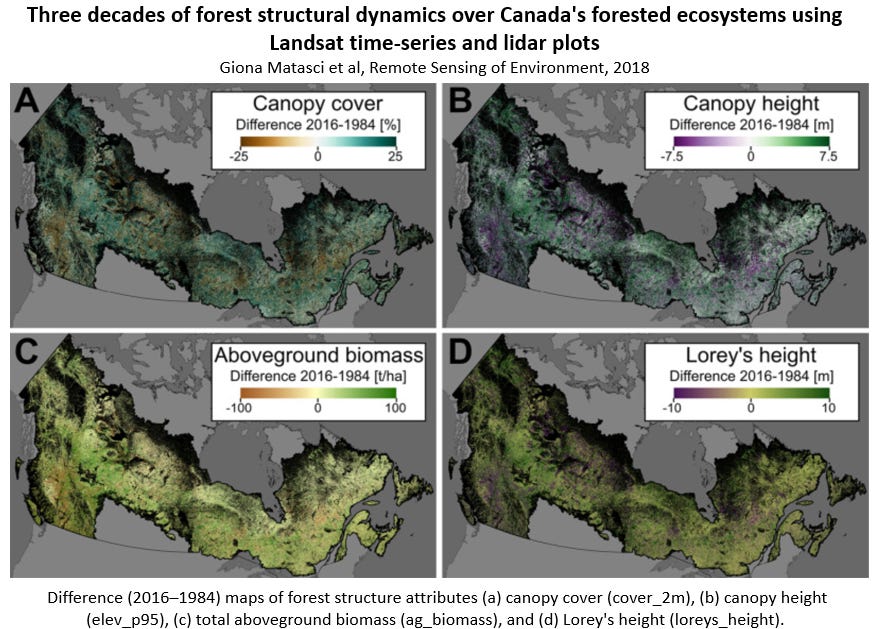
Figure 6. Difference (2016–1984) maps of forest structure attributes (a) canopy cover (cover_2m), (b) canopy height (elev_p95), (c) total aboveground biomass (ag_biomass), and (d) Lorey’s height (loreys_height) using Lansat time series and Lidar plots.
Equally important is the distribution of lighter colors along lower latitudes relative to the darker colored northern expansion. This suggests that this lighter colored zone is not experiencing the same net growth as regions further north over this time frame.
This lower net growth zone is due to a complex pattern of logging, changing climatic conditions and to increased frequency of forest fires.
Starting first with the most important climate indicator - total precipitation records.
To answer this question, I introduce a full century total annual precipitation record from Fort McMurray, Alberta, which is located in the very bullseye of Canada’s Boreal Forest (57N x 111W).
Note the following:
21st century total precipitation levels mirror the levels seen in the early 20th century - a natural cycle.
Monthly precipitation records show that +75% of total precipitation comes in the form of rain during the non-winter months.
There is a 3x fold difference between maximum (1970s) and minimum precipitation levels.
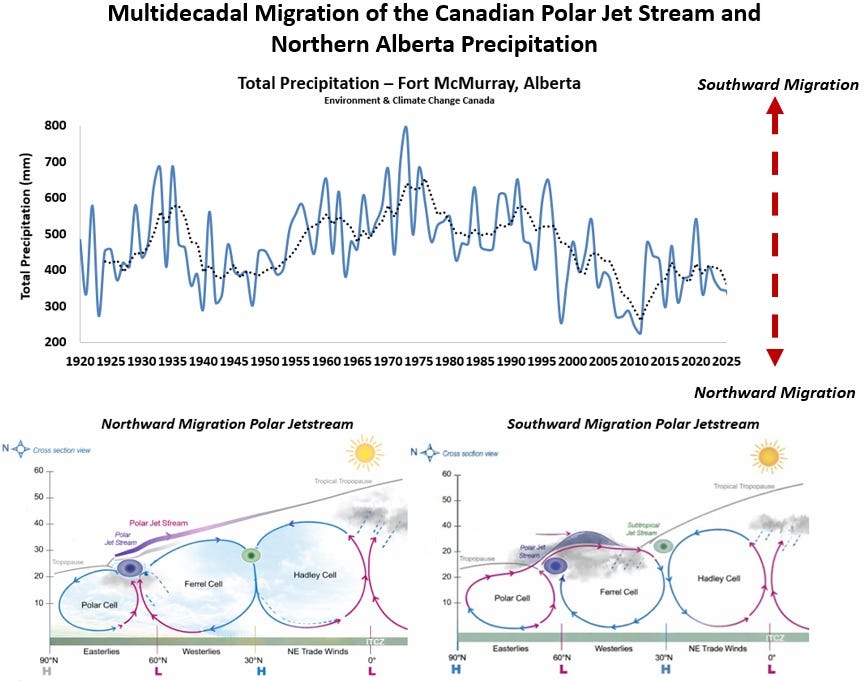
Figure 7. Fort McMurray, Alberta, total precipitation records, together with a model of the multidecadal migration pattern of the polar jet stream and its storm track.
At this point in my intensive research, I am invoking a hypothesis that argues that the polar jet stream over North America, together with its storm track, have undergone a multidecadal pattern longitudinally over the past century.
The Arctic Polar Cell and its polar jet stream has contracted poleward twice over the past century and its areal extent southward reached a maximum during the 1970s.
As the polar jet stream migrated southward (northward), Fort McMurray at 57N received more (less) precipitation.
As such, total precipitation is proxy for the Arctic Oscillation Index, which is the Northern Hemisphere analog to the longer studied Southern Annular Mode (SAM) of the Southern Hemisphere - same atmospheric physics applies.
The early 20th century poleward expansion of the North American polar jet stream coincided with the concurrent positive phases of the North Atlantic - Pacific sea surface temperature cycles.
To test the later literature claim, I plotted the inverse total precipitation record at Fort McMurray versus the undetrended AMO and as shown in Figure 8, it is clear that a negative correlation exists, which appears to get stronger in the latter half of the 20th century.
Note, Figure 8 is not an argument for an AMO influence on Boreal Forest precipitation trends - it is simply my way of showing two effects, with similar temporal dynamics.
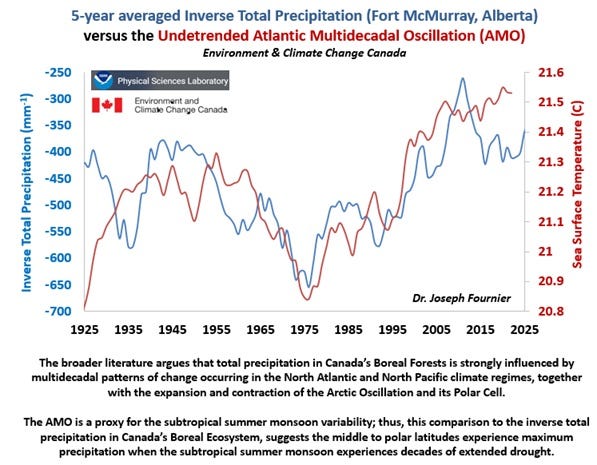
Figure 8. Inverse total annual precipitation records from Fort McMurray, Alberta (57N x 111W) versus the undetrended AMO time series.
By emphasizing long term precipitation data, specific to Canadian’s Boreal Forest region, we set the stage to show that the 21st century has been droughty for this region relative to the middle of the 20th century.
Note that the lowest total precipitation in a century in Fort McMurray (2011) coincided with the second largest forest fire since 1950 in Alberta.
The Alberta Athabasca region’s 2011 Richardson Fire burned over 700,000 acres of Boreal Forest - I lived in Fort McMurray during that fire and it was epic.
It is crucial point out that the multidecadal rise in precipitation shown in Figure 7 from the early to middle 20th century was not unique to Fort McMurray - it was part of Canada wide phenomenon.
I am presently embarking on an expanded research project that examines centennnial scale precipitation and air temperature data, extending from Canada, to Greenland and Europe. Careful attention will be made to both latitude x longitude, in an effort to expand further on the idea that multidecadal trends are phase locked with changes in the mean zonal position of the Northern Hemisphere’s polar jet stream or AMO.
In conclusion to this section, I will simply state that on a global average basis, the biosphere has been rapidly accumulating biomass, since the natural climate tipping point of the late 1970s, where sunshine, the Hydrological Cycle and tropospheric CO2 concentrations entered a multidecadal phase of collaboration.
In essence, this means wildfire fuel has been stockpiling.
The Boreal Forest’s poleward migration since the late 20th century, coincides in parallel with the northward displacement of the polar jet stream and its associated storm track. This trend is giving rise to droughty conditions along lower latitudes over which the majority of the Boreal Forest is concentrated.
The conditions for enhanced Boreal Forest fires is therefore increasing.
3.0 BOREAL FOREST ECOSYSTEMS, WILDFIRES AND ECOSYSTEM VITALITY
While the previous sections were global in their generalizations, this section focuses on the boreal forest ecosystem. The Boreal Forest ecosystem is unique to the extratropical Northern Hemisphere and is the largest zonally coherent forest system on the planet (11% - 14% land surface area).
The Boreal Forest is a disturbance‑adapted biome whose long‑term stability depends on recurring, low‑to‑moderate intensity wildfire.
Far from being an episodic catastrophe, fire is the central ecological process governing regeneration, nutrient cycling, species composition, and productivity across northern coniferous landscapes. The structural and functional characteristics of the boreal forest cannot be understood without recognizing the evolutionary role of fire and the consequences of its absence.
A defining feature of many dominant boreal species is serotiny — an adaptation in which cones remain closed until exposed to the heat of fire.
Jack pine, lodgepole pine, and portions of black spruce populations exhibit this trait, ensuring that seed release coincides with conditions favorable for establishment:
Fire exposed mineral soil
Reduced competition for newly emergent sapplings
A pulse of nutrients liberated from combusted organic matter.
Johnson’s comprehensive analysis of boreal fire regimes demonstrates that these species evolved under fire return intervals typically ranging from 50 to 150 years, and that their reproductive strategies are tightly coupled to this disturbance frequency.
Weber and Stocks show that fire acts as a nutrient reset mechanism, increasing the availability of nitrogen, phosphorus, and base cations, thereby enhancing early‑successional productivity relative to older stands. This nutrient pulse is essential for maintaining long‑term forest productivity in a biome otherwise constrained by cold temperatures and short growing seasons.
The biodiversity consequences of fire exclusion are equally significant. Older coniferous stands tend toward structural homogeneity: closed canopies, sparse understories, and limited habitat heterogeneity.
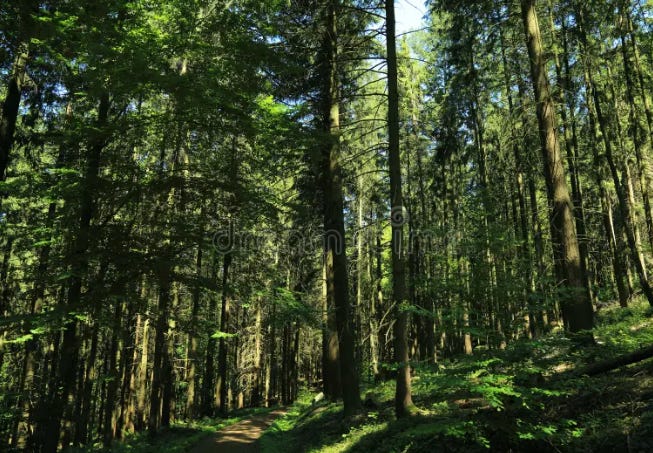
Figure 9. Late stage successional low diversity state of the Boreal Forest before a fire.
These conditions support fewer species and restrict ecological niches.
In contrast, fire creates a shifting mosaic of stand ages and compositions, generating the spatial heterogeneity required by many boreal birds, mammals, and understory plants. Bergeron and colleagues demonstrate that recurring fire maintains landscape‑level biodiversity by preventing late‑successional dominance and promoting mixedwood development, which supports higher species richness and functional diversity.
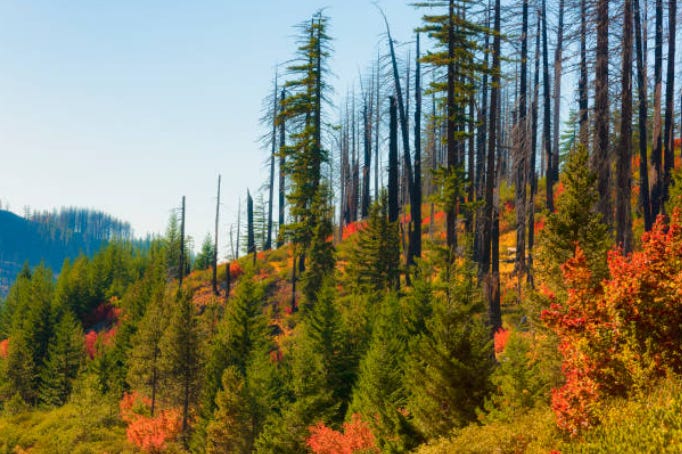
Figure 10. Early stage open structure and diverse state of the Boreal Forest after a fire.
Taken together, these dynamics illustrate a fundamental principle: the Boreal Forest is not a climax ecosystem but a disturbance‑regulated system. In classical ecology, a climax ecosystem is the end‑point of succession:
Stable
Self‑maintaining
Dominated by long‑lived species
Capable of persisting indefinitely without major disturbance.
Temperate hardwood forests in the eastern U.S. or old‑growth coastal rainforests in British Columbia fit this model reasonably well. If left alone, they tend toward a predictable, mature state.
The Boreal Forest cannot reach — and is not designed to reach — a stable, disturbance‑free climax condition. Its dominant species (jack pine, lodgepole pine, black spruce) are fire‑adapted, fire‑dependent, and in many cases fire‑obligate.
Their reproductive strategies assume that fire will occur on a predictable cycle.
This means:
The boreal forest requires disturbance to maintain its structure and function.
Fire is not an interruption of the ecosystem; it is the primary organizing force of the ecosystem.
Without fire, the forest does not progress toward a stable climax state — it declines.
These principles, while well known among Indigenous peoples, have largely been forgotten by metropolitan policy architects - much to our detriment.
4.0 GLOBAL FIRE STATISTICS
Now that we have established a foundation based on fundamentals, it is time to switch gears to statistics. Figure 11 shows Copernicus data specific to 21st century yearly burned aera and the annual number of fires by ecosystem type - croplands, forest, shrubs/grasslands, savannas and other.
Pay close attention to total yearly burned areas, together with ecosystem type and yearly number of fires.
Africa, Asia and European Union stand out by showing strong declining trends for both over the two decades of data listened at the Copernicus website, driven predominately by reductions in fires over shrublands / grasslands and croplands.
North America, South American and Oceania shows limited evidence of any trend on a total area burned basis and other than Oceania, show a shallow reduction in annual total fire count.
Missing is the Russian Confederation.
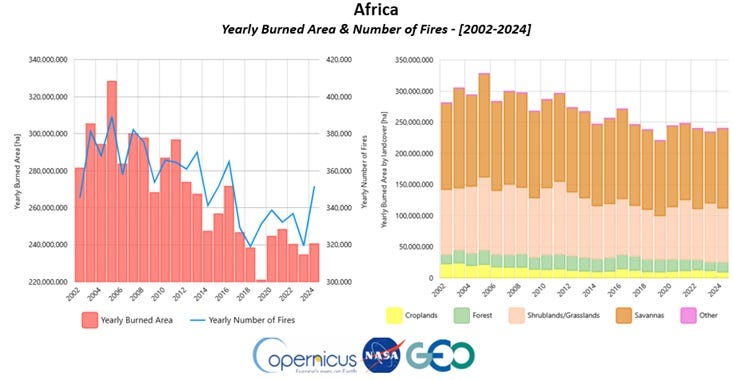
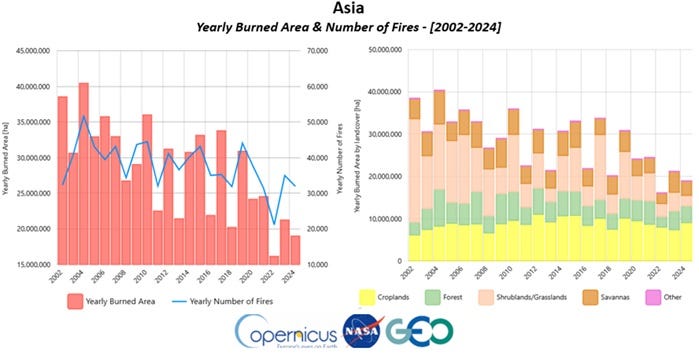
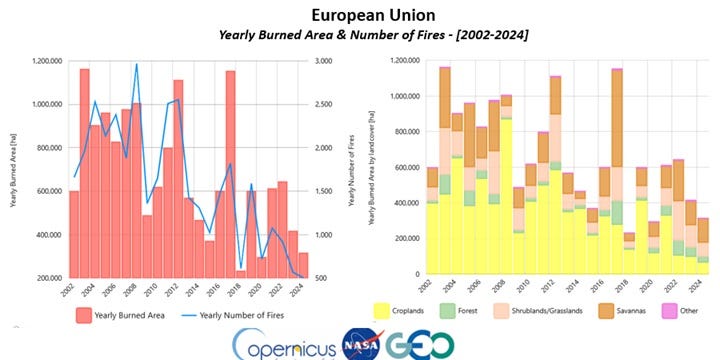
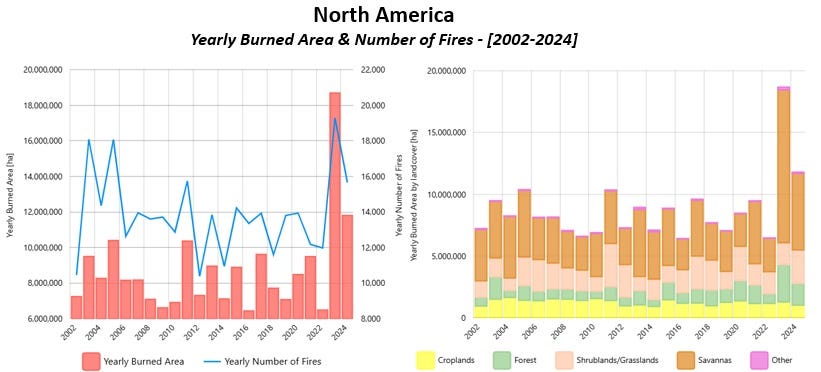
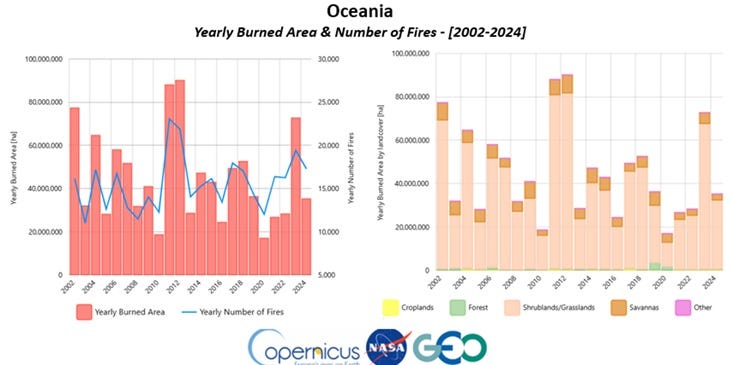
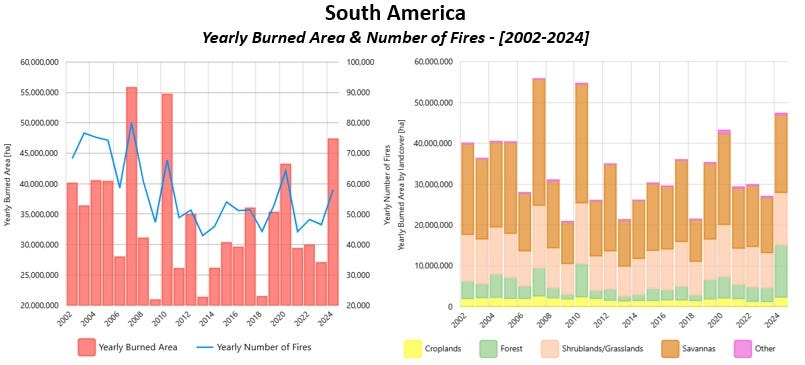
Figure 11. 21st century yearly burned area and annual fire rates by region - Copernicus data.
Now, when I have shown this data to people on social media, when debating whether forest fires are increasing, I am regularly reminded that this data is dominated by statistics from other ecosystem types.
I remind people that ecosystems such grasslands, shrubs and savannas are uniquely fire prone by virtue of the fact that they are low precipitation landscapes, while forested ecosystems are less so.
Forests only exist where sufficient rainfall exists to support their higher evaportranspiration load.
Now lets dive into the statistics specific to forest ecosystems.
The World Resources Institute (WRI) provides a useful frame of reference, with numerous recent publication references, which shows the active research into quantifying how 21st century forest fires are changing.
Figure 12 is an extract from a WRI literature review article, which quantifies select literature estimates on annual tree cover loss by fire from 2001 to 2025, as a function of forest ecosystem type.
Note that the Boreal Forest fires are the dominant signal.
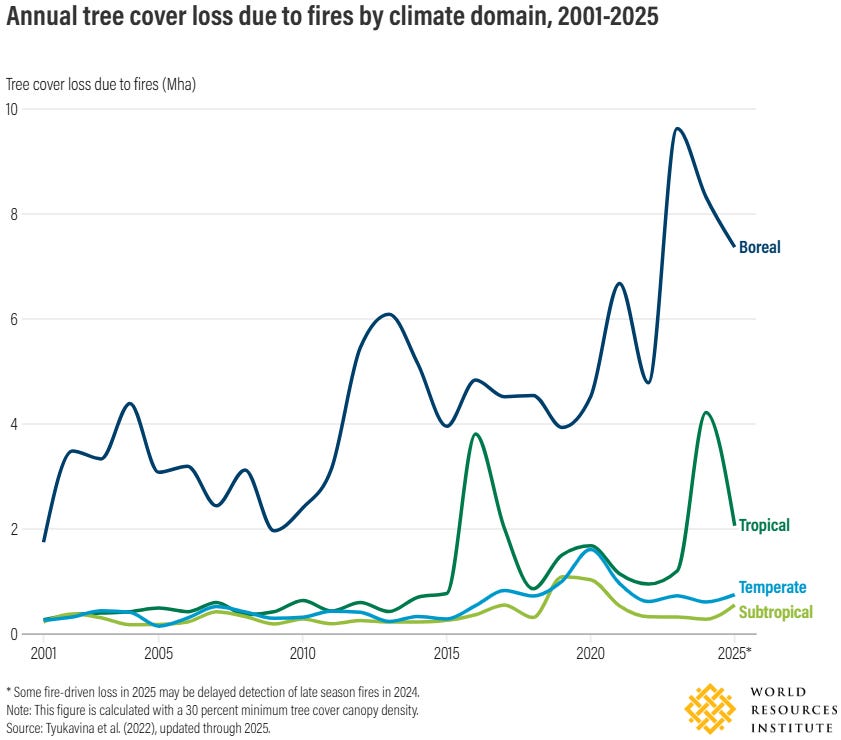
Figure 12. 21st century forest fire statistics by forest ecosystem type - WRI.
A closer examination of the Boreal Forest specific statistics shows that Russia is the dominant source of the signal. Figure 13 compares annual Boreal Forest cover loss for both Canada and Russia, shows that the latter has exhibited a positively trending area burned, while the former has been relatively constant until the last three years prior to 2025.
Clearly Russian fires are dominating the signal.
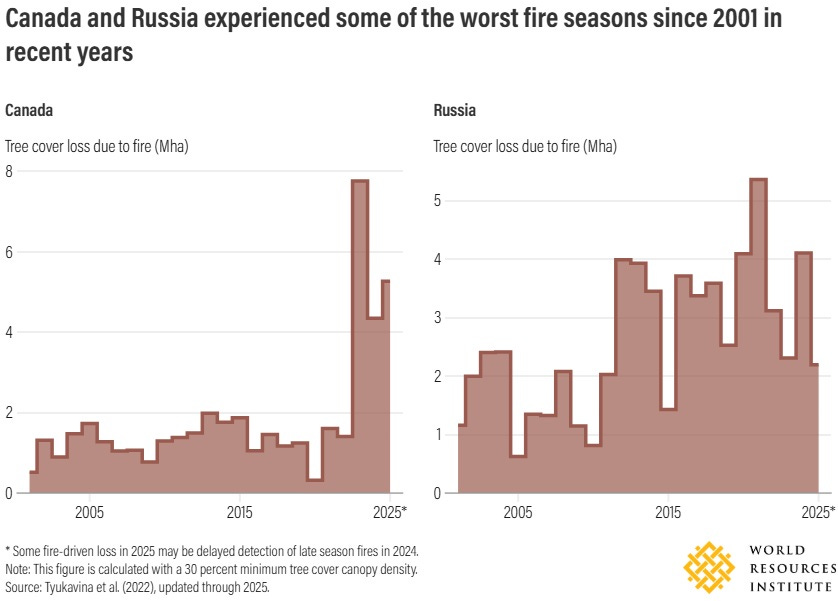
Figure 13. Canadian versus Russian Boreal Forest annual forest cover loss to fire - WRI.
The fact that the middle latitude Boreal Forests are the primary signal source for global forest fires in the 21st century is an important fact to bear in mind.
At this point, I suspect it is because the tropics are benefiting from rising precipitation, while the middle latitudes of the Northern Hemisphere is experiencing low precipitation as per the ideas expressed in the previous section.
Indeed, the poleward migration of the polar jet stream and its precipitating storm track, is indeed evidence of Climate Change. However, as this discussion started, there is no physical basis with any merit to argue that modern Climate Change is due to rising CO2 concentrations.
In conclusion to this section, I will summarize global total area burn stats that simply shows the opposite of the common narrative - total being all ecosystem area types - not just forests (Figure 14).
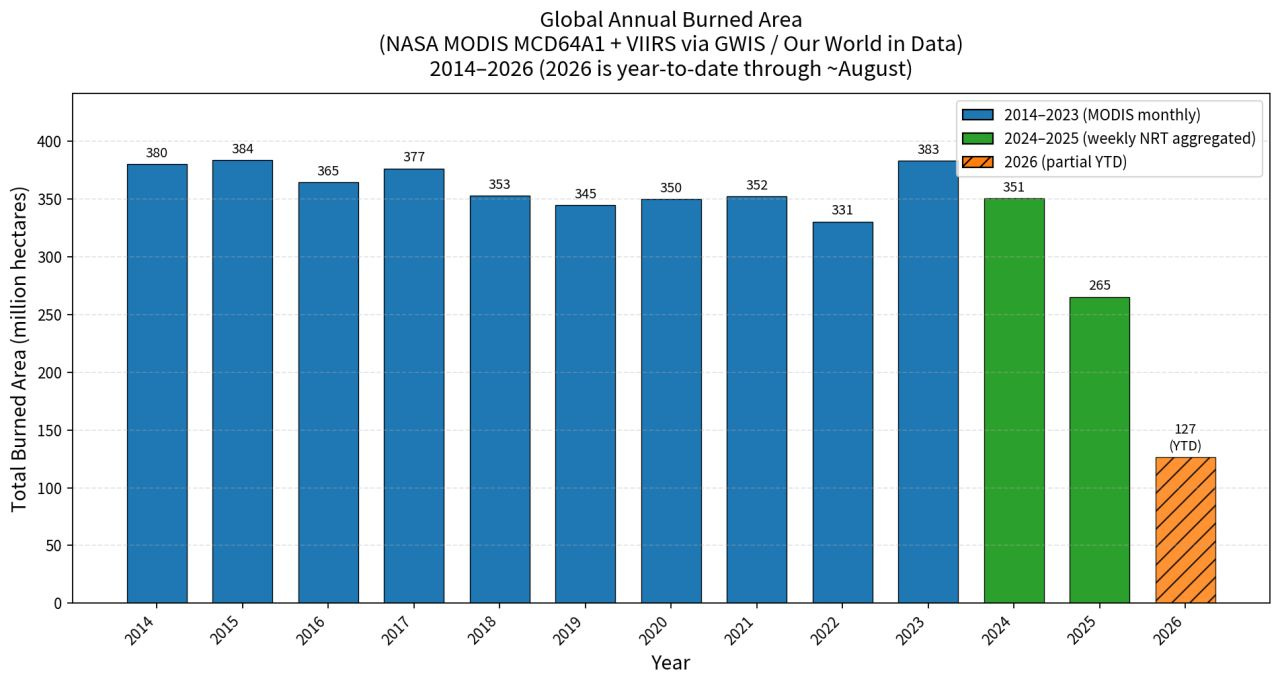
Figure 14. Total global annual burn area from Our World in Data - all ecosystem types.
5.0 CANADIAN FOREST FIRE STATS
This article ends with a focus on Canada and the central reason is because the longer term record shows larger forest fires have been increasing since the 1950s, while total forest fire count has been decreasing since the 1980s.
First, I will begin by showing a figure by Chelene C. Hanes et al that I have modified with green highlighting. In Figure 15, Chelene C. Hanes et al shows the distribution of major fires across Canada by decade from 1959 to 2024.
I added the green band to show the approximate area of newer Boreal Forest that has developed since the 1980s - note that I added this green band because of the absence of fires identified in this study along this younger forested zone - in line with Figure 6.
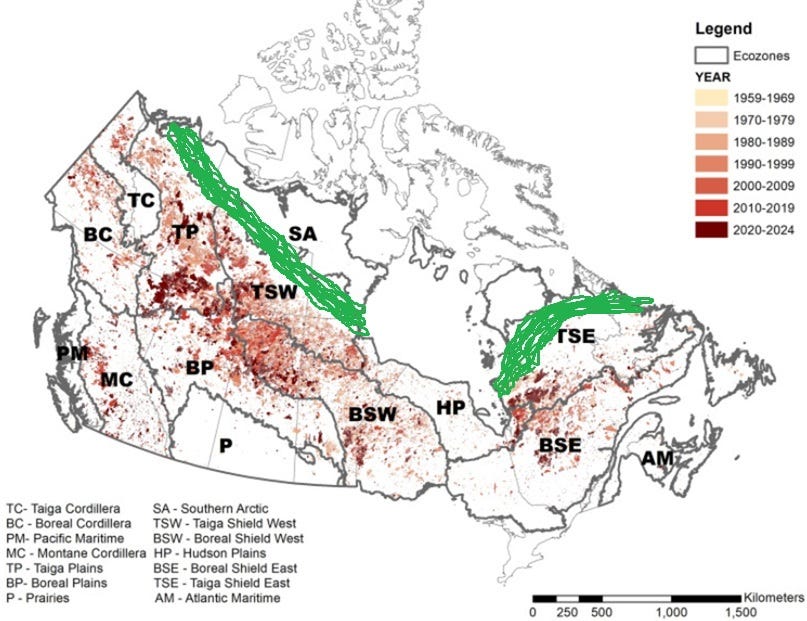
Figure 15. Spatial distribution of burned areas over the last 66 years in Canada across ecozone boundaries.
The key figure from Chelene C. Hanes et al that I want to emphasize is shown in Figure 16, which shows the time series for fire size class in both area and percentage of total area burned between 1959 to 2024. The take-away point is that irrespective of size class, forest fires in Canada are increasing in size per event.
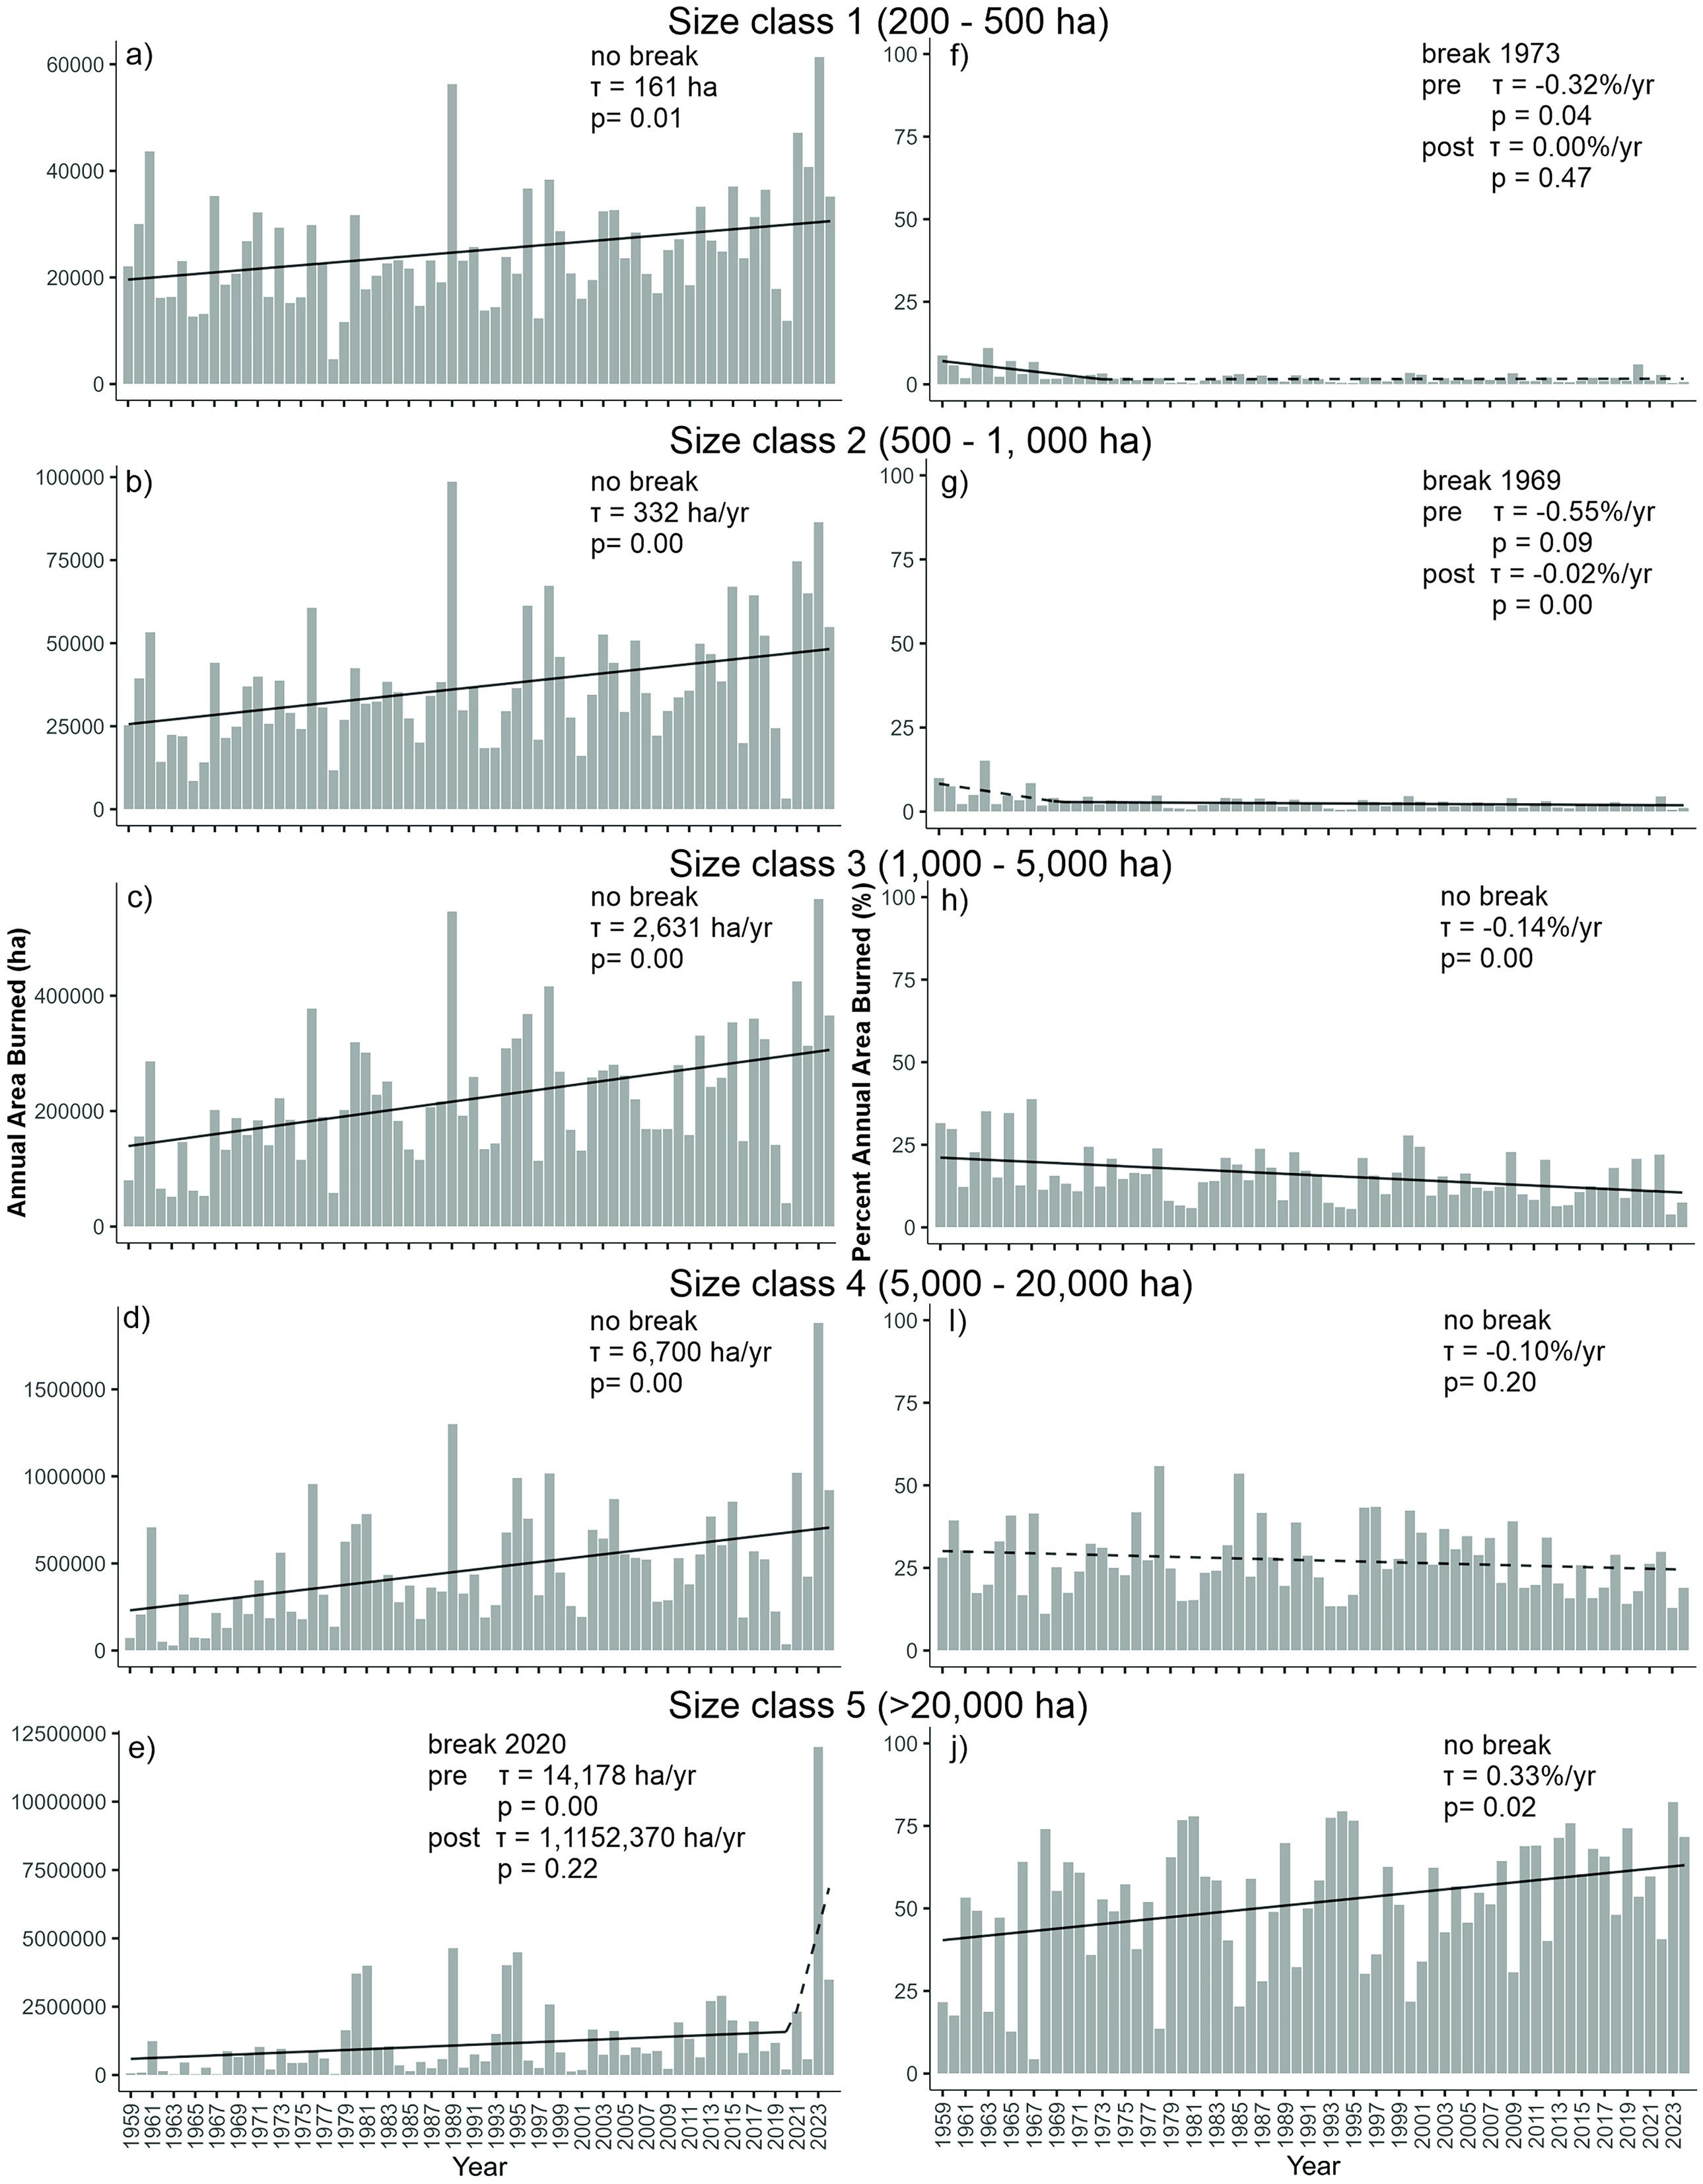
Figure 16. National annual area burned (left panel a to (e)) and percent annual area burned (right panel f to j) by size classes 1959–2024. Solid trend lines p < 0.05 and dashed lines are not significant.
Now for the linchpin dataset.
Figure 17 displays the segmented trend in the annual number of fires of all sizes across Canada from 1959 to 2024. It shows a statistically significant increase in fire frequency from 1959 until a peak around 1988, followed by a sustained decline thereafter. This pattern, together with Figure 16, underpins the paper’s central finding that, while total fire numbers have fallen since the late 1980s (largely due to improved detection, prevention, and suppression), the remaining fires have grown larger and more destructive.
This is a concerning long term trend and it signals an unsustainable ecological trajectory.
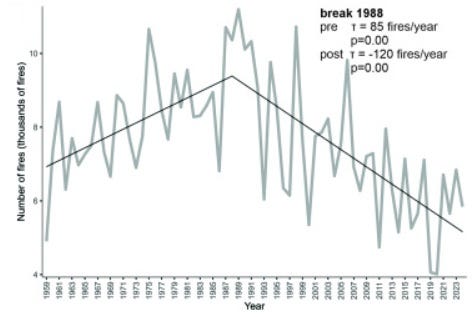
Figure 17. Segmented trend in all Canadian fires since 1959 - Chelene C. Hanes et al.
As we approach the end point in this deep dive, I want to show the sum total of all size class fires versus the annual number of fires from the Canadian National Fire Database (CNFDB). Figure 18 helps bring perspective on the scale of the recent highs in 2023 - 2025 relative to the annual area burned from 1970 to 2025.
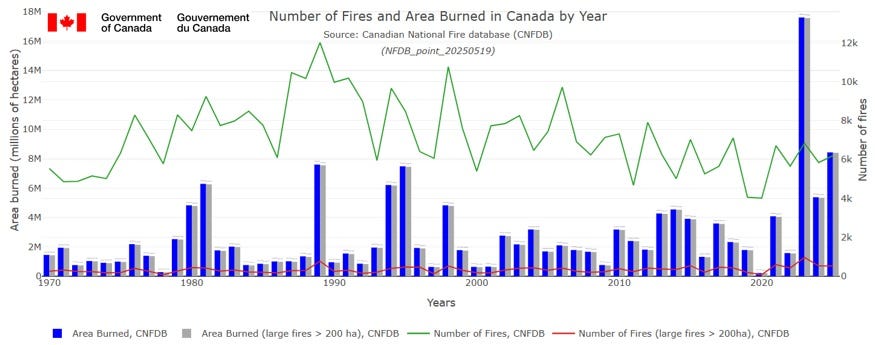
Figure 18. Canada - Wildland Fire Summary Stats.
Is it just me or do the last few years appear as an outlier?
If Climate Change is by norm defined by a longer term trend (e.g., Figure 16), what Figure 18 shows over the past few years is hardly consistent relative to the decadal trend.
It the last few years due to a sudden drought intensification? How about arson?
In conclusion, I will leave you with a photo I found just this evening as I am wrapping up this multi-day research and writing endeavor. A British Columbia Forester posted to LinkedIn the photo shown in Figure 19, apparently taken from a location in the southwestern region of the province at an elevation of 1200 - 1400 meters above sea level.
The Forester was alarmed by the successive mortality that is occurring.
When I look at this forest, I am reminded of the same level of successive mortality and fuel loading accumulation that I witnessed while living in Fort McMurray prior to the Richardson Fire of 2011.
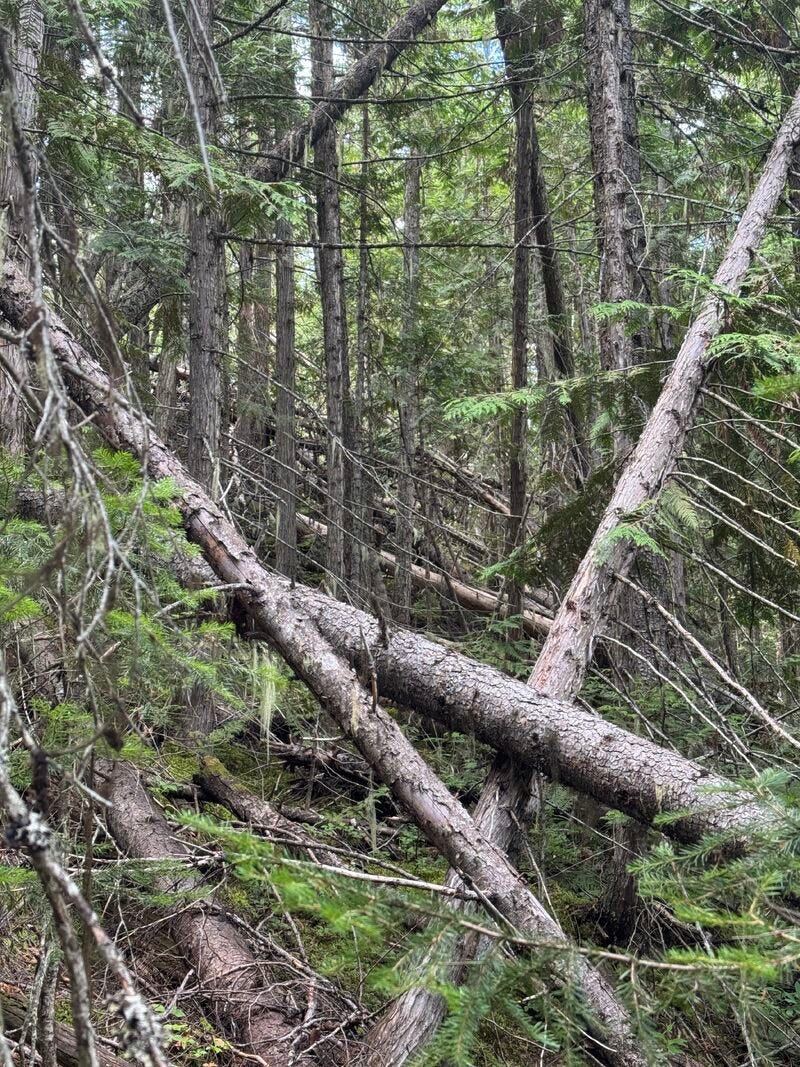
Figure 19. Photo taken in late stage conifer forest in British Columbia in 2026.
Let me conclude this final section by saying that:
Long term fire suppression.
Optimal climatic conditions from the 1950s to the late 20th century.
Declining logging over the past few decades.
Each of these factors have collectively given rise to a near perfect condition where fuel loading in older Boreal Forest zones in Canada have reached unsustainable levels.
These factors, have reached a tipping point over the past decade with persistent droughty conditions as part of a natural cycle in precipitation. All that is required is an ignition source to set in motion a rise in very large intense forest fires in Canada.
Climate, economics and policy - a complex mix of factors.
CONCLUSIONS
The evidence examined throughout this article demonstrates that the dominant public narrative linking wildfires primarily to human-caused warming via CO2 is both incomplete and misleading. Climate change itself is real and ongoing, yet it is largely an expression of natural multidecadal and longer-term oscillations in ocean–atmosphere systems, sunshine intensity, and the hydrological cycle—processes that dwarf the radiative contribution of rising CO2.
Concurrently, the global plant kingdom has expanded vigorously under higher CO2, increased precipitation in many regions, and warmer conditions, accumulating substantial biomass and, in the boreal zone, creating dense fuel loads.
Within the Boreal Forest—the planet’s largest terrestrial ecosystem—fire is not an aberration but an essential ecological process that resets nutrients, enables serotinous regeneration, and sustains biodiversity. Long-term fire suppression, favorable mid-to-late twentieth-century climate, and reduced logging have allowed fuel to accumulate to critical levels, particularly in older stands.
Canadian data illustrate the resulting paradox: total fire frequency has declined since the late 1980s while individual fires have grown larger and more intense, especially under recent drought. Globally, overall burned area continues to fall, driven mainly by reductions outside forest ecosystems.
Policy that treats every large fire as proof of catastrophic anthropogenic warming risks perpetuating failed suppression strategies while ignoring the natural role of fire and the complex interplay of climate, vegetation, and human management. A more honest approach recognizes natural climate variability, the ecological necessity of fire, and the need for adaptive, landscape-scale management rather than simplistic attribution.
Only then can we move beyond disinformation toward resilient forests and informed public discourse.
No posts
Comments
Nothing yet. Say the first thing.
Sign in to join the conversation.