
Podcast: Check out the latest episode of the Corn Belt Newsletter Podcast with Senator Peter Welch of the Senate Agriculture Committee!
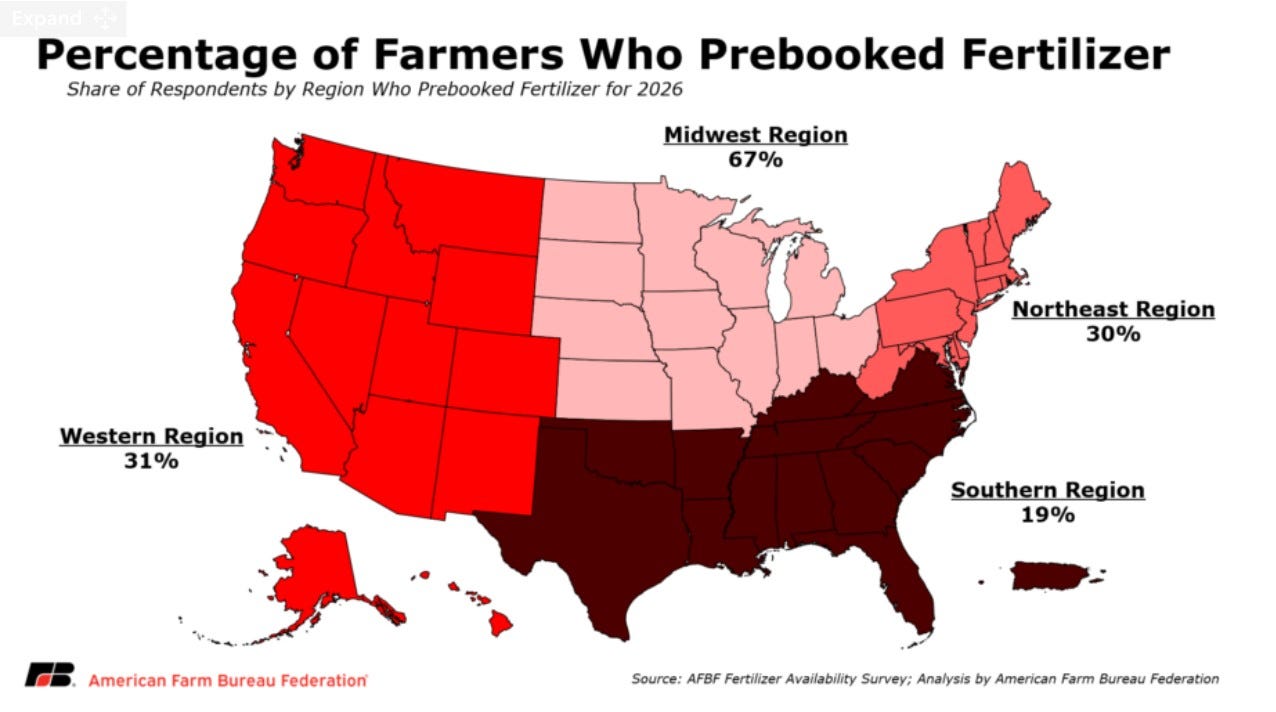
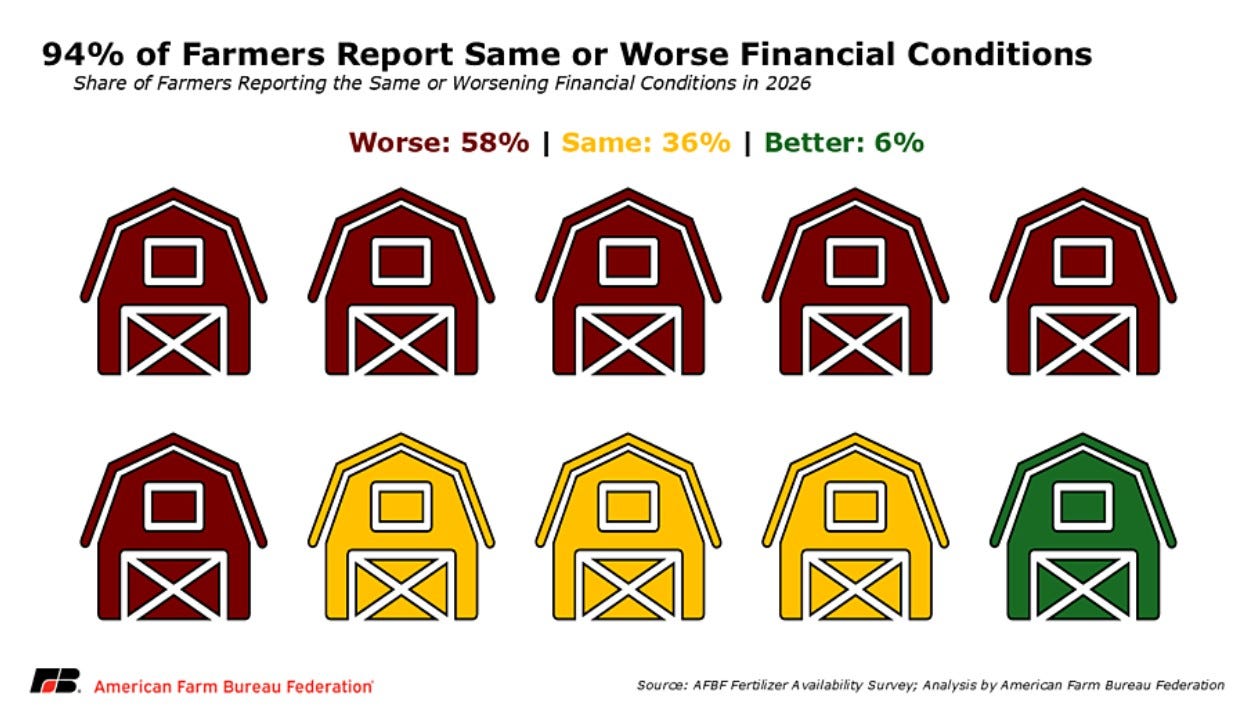
American Farm Bureau Survey on Fertilizer: The American Farm Bureau released a survey of farmers showing that many will not be able to afford the fertilizer they need for the 2026 growing season. This is mainly due to supply chains in oil and fertilizer being disrupted due to the conflict in the Middle East. The report said, “Producers in the Northeast and West also reported significant challenges, with 69% and 66%, respectively, unable to afford all required fertilizer, compared to 48% in the Midwest.” The survey also pointed out that economic conditions on their operations were getting worse. This is no surprise considering the farm economy is entering year three of a recession. Another element to consider is the cost of diesel fuel. I had Chad Hart, who is an economist from Iowa State University, on my podcast a few weeks ago, and one of his major concerns was the price of diesel fuel. Not only does this drive up the cost of transporting grain and running equipment, but most of our food supply is delivered by truck, which runs on diesel fuel. This could lead to higher inflation throughout the economy in the months to come. For the entire survey results, click the link below.
Link: Farm Bureau Survey Reveals Real Impact of Fertilizer Availability and Price
Planting Progress: Planting has commenced across the Corn Belt. Iowa is ahead of its five-year average for both corn and soybeans. Illinois and Indiana are right on pace for both crops. Unless Mother Nature turns on the faucet, we are off to a good start this growing season.
Corn:
Iowa: 32% planted. Five-year average 22% planted.
Illinois: 15% planted. Five-year average 19% planted.
Indiana: 9% planted. Five-year average 10% planted
Soybeans:
Iowa: 23% planted. Five-year average 13% planted.
Illinois: 20% planted. Five-year average 18% planted.
Indiana: 9% planted. Five-year average 8% planted
Link: Crop Progress
Quote of the Month: “Out of the long list of nature’s gifts to man, none is perhaps so utterly essential to human life as soil.” - Hugh Hammond Bennett
Farmland Sales: Below are a few notable farmland sales from March.
160 acres sold in Clay County, IA. The farm had a CSR-2 rating of 85 and sold for $13,943 per acre, or $164 per CSR-2 point.
102 acres sold in Lee County, IA. The farm had a CSR-2 rating of 64 and sold for $14,225 per acre, or $222 per CSR-2 point.
73 acres sold in Sioux County, IA. The farm had a CSR-2 rating of 91 and sold for $26,800 per acre, or $294 per CSR-2 point.
Link: Corn Suitability Rating (CSR-2) Explainer
Check out the rest of the newsletter for key indicators affecting the land market and agriculture.
Commodity Markets
Corn:
Feed and Residual Use: USDA’s latest estimates were unchanged from last month’s report. 6.200 billion bushels are to be used for feed and residual use during the 2025-2026 marketing year.
Why it Matters: Feed and residual demand account for about 40% of corn usage. With the recent cattle inventory report showing the smallest cattle herd in over seventy years, it’s difficult to see feed numbers increasing.
Ethanol: Recent USDA estimates kept projections for the 2025-2026 marketing year the same at 5.600 billion bushels for ethanol use.
Why it Matters: Ethanol accounts for roughly 40% of corn usage. Continue to monitor developments from Washington regarding biofuel policy. Year-round E-15 would be a welcome policy change.
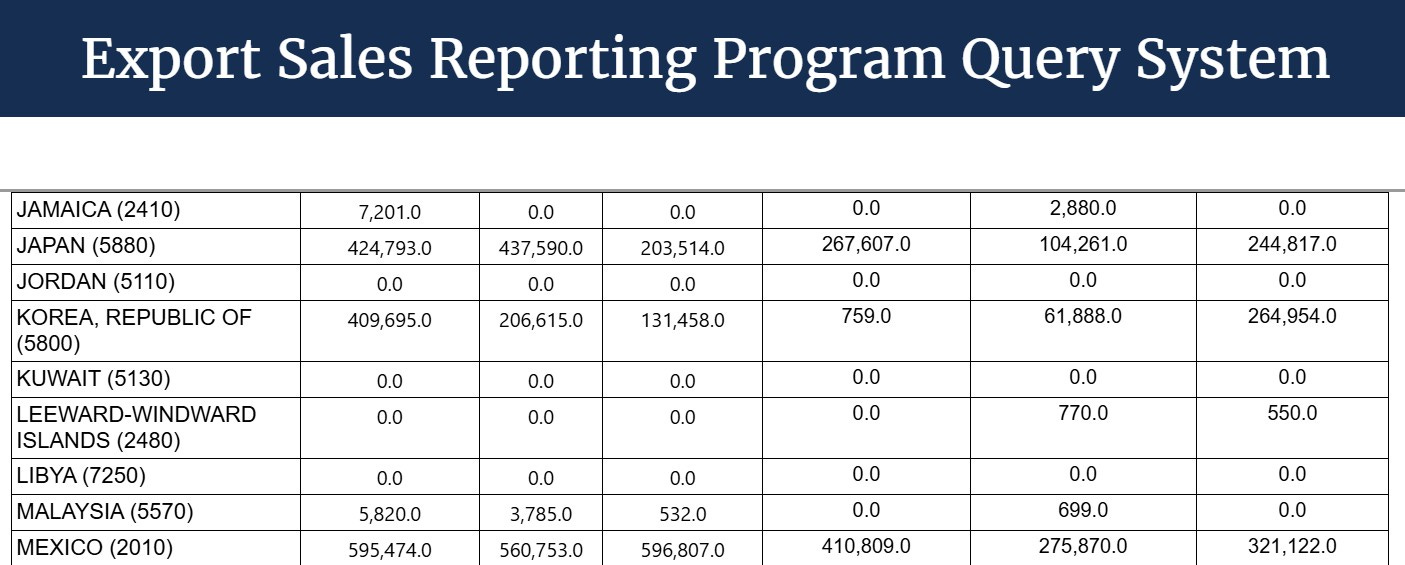
Exports: USDA’s latest estimate of exports for the 2025-2026 marketing year was unchanged from last month’s report. 3.300 billion bushels is expected for export.
Why it Matters: Exports comprise about 20% of U.S. corn demand. U.S. corn sales remain very strong. Mexico remains our biggest buyer.
Link: WASDE
Link: Exports
Soybeans:
Crush: The National Oilseed Processors Association (NOPA) crush data for March was 226.1 million bushels, up from 194.6 million bushels a year ago.
Why it matters: Roughly 55% of U.S. soybeans are used for crush and soybean oil production.
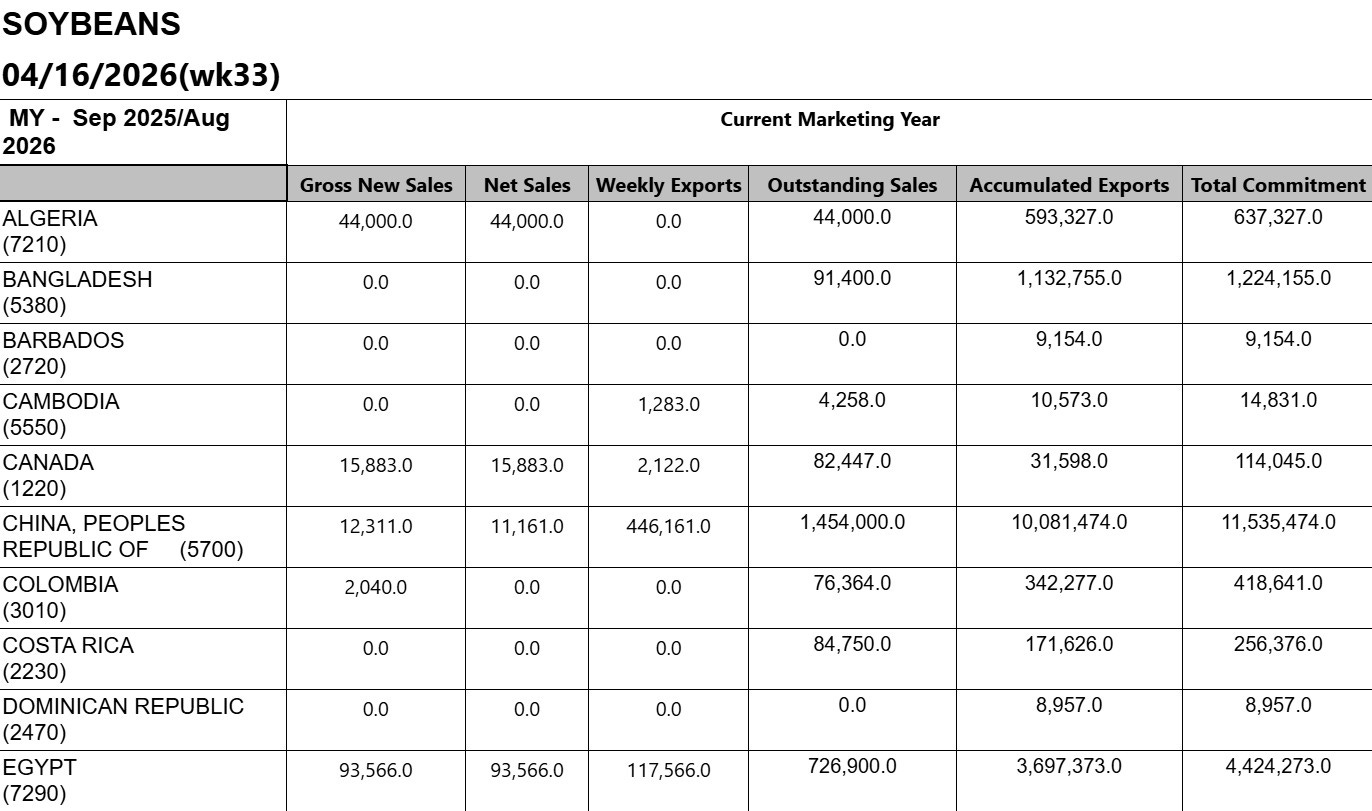
Exports: The USDA’s recent export projections estimate 1.540 billion bushels of soybeans for export during the 2025-2026 marketing year. This number was reduced from last month’s report of 1.575 billion bushels.
Why it matters: About 45% of our U.S. soybean crop is exported. Egypt was the biggest buyer last week. Soybean sales have dropped mostly due to China’s lack of buying and a record South American crop.
Link: WASDE
Link: Exports
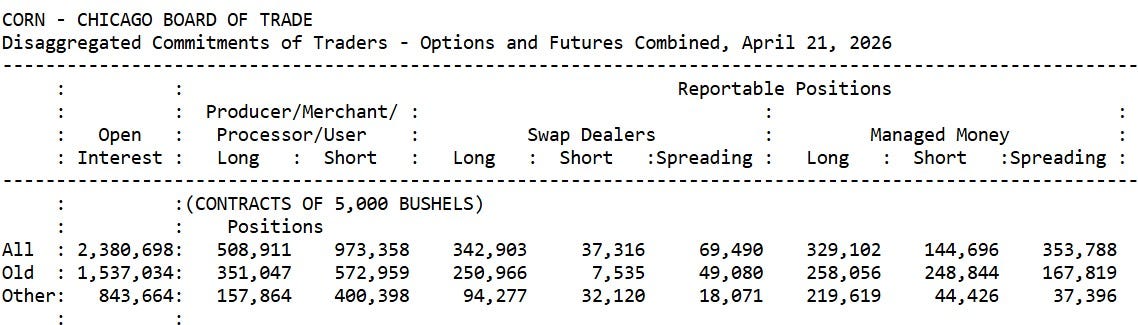
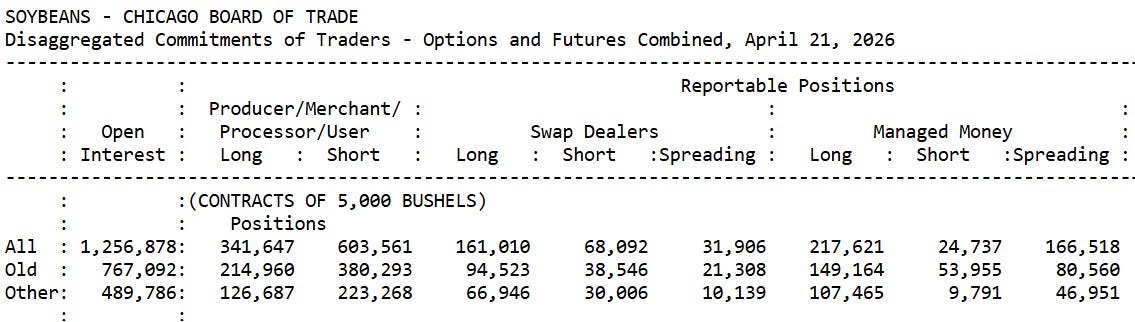
Commodity Futures Trading Commission: The Commodity Futures Trading Commission (CFTC) showed that managed money has a long position in the corn and soybean markets. Long corn contracts of (184,406) and long soybean contracts (192,884).
Why it matters: The funds have trimmed their long positions somewhat from last month’s newsletter. They still hold a large long position in both the corn and soybean markets. We will continue to track their positions. July corn is currently at $4.73 per bushel, and July soybeans are at $11.94 per bushel.
Link: CFTC
Link: Corn and Soybean Prices
Interest Rates:(30-year mortgage) The current 30-year mortgage rate is 6.4%, compared to 6.8% a year ago.
Why it matters: Interest rates are a major factor in agriculture. They are one of the fundamentals to watch in the land market.
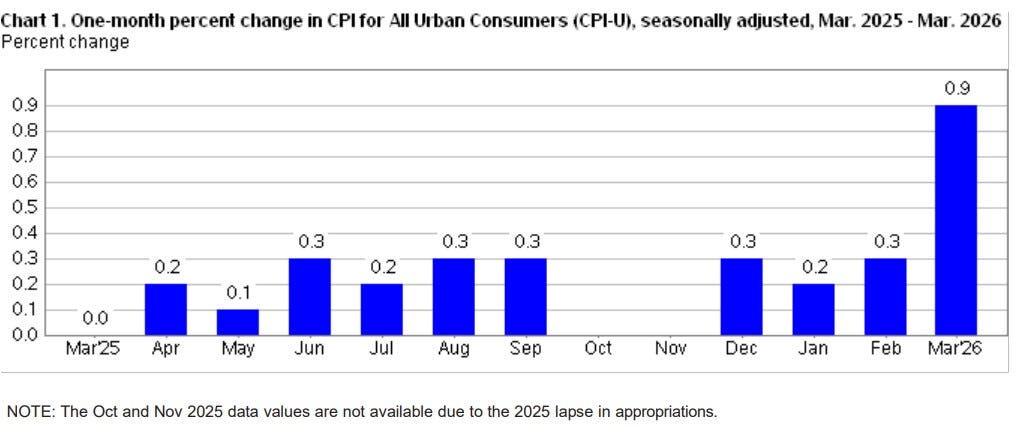
Inflation: The Labor Department’s monthly Consumer Price Index (CPI) showed a 3.4% year-over-year increase in its latest report.
Why it matters: CPI increased in March to 3.4%. This was up from 2.4% from February. The Federal Reserve kept interest rates the same at its April meeting. With the War in Iran continuing to disrupt energy and fertilizer markets, it is not surprising to see inflation rise and the Federal Reserve keep interest rates where they are. The average price of a gallon of gas is $4.30.
Link: CPI
Link: AAA Gas Prices
Link: Federal Reserve
Fertilizer Prices: According to the USDA Production Cost Report, Anhydrous Ammonia (NH3) averaged $1,073 per ton. A year ago, it was $779 per ton. Potash averages (POT) $494 per ton. A year ago, it was $463 per ton. Phosphate (MAP) averages $901 per ton. A year ago, it was $820 per ton.
Why it matters: With the war in Iran disrupting supply chains, fertilizer prices, which were already high, are continuing to increase. This will affect some growers for the current growing season. However, a big concern is what this will mean for fertilizer prices this fall and how that will affect the 2027 growing season.
LINK: Iowa Production Cost
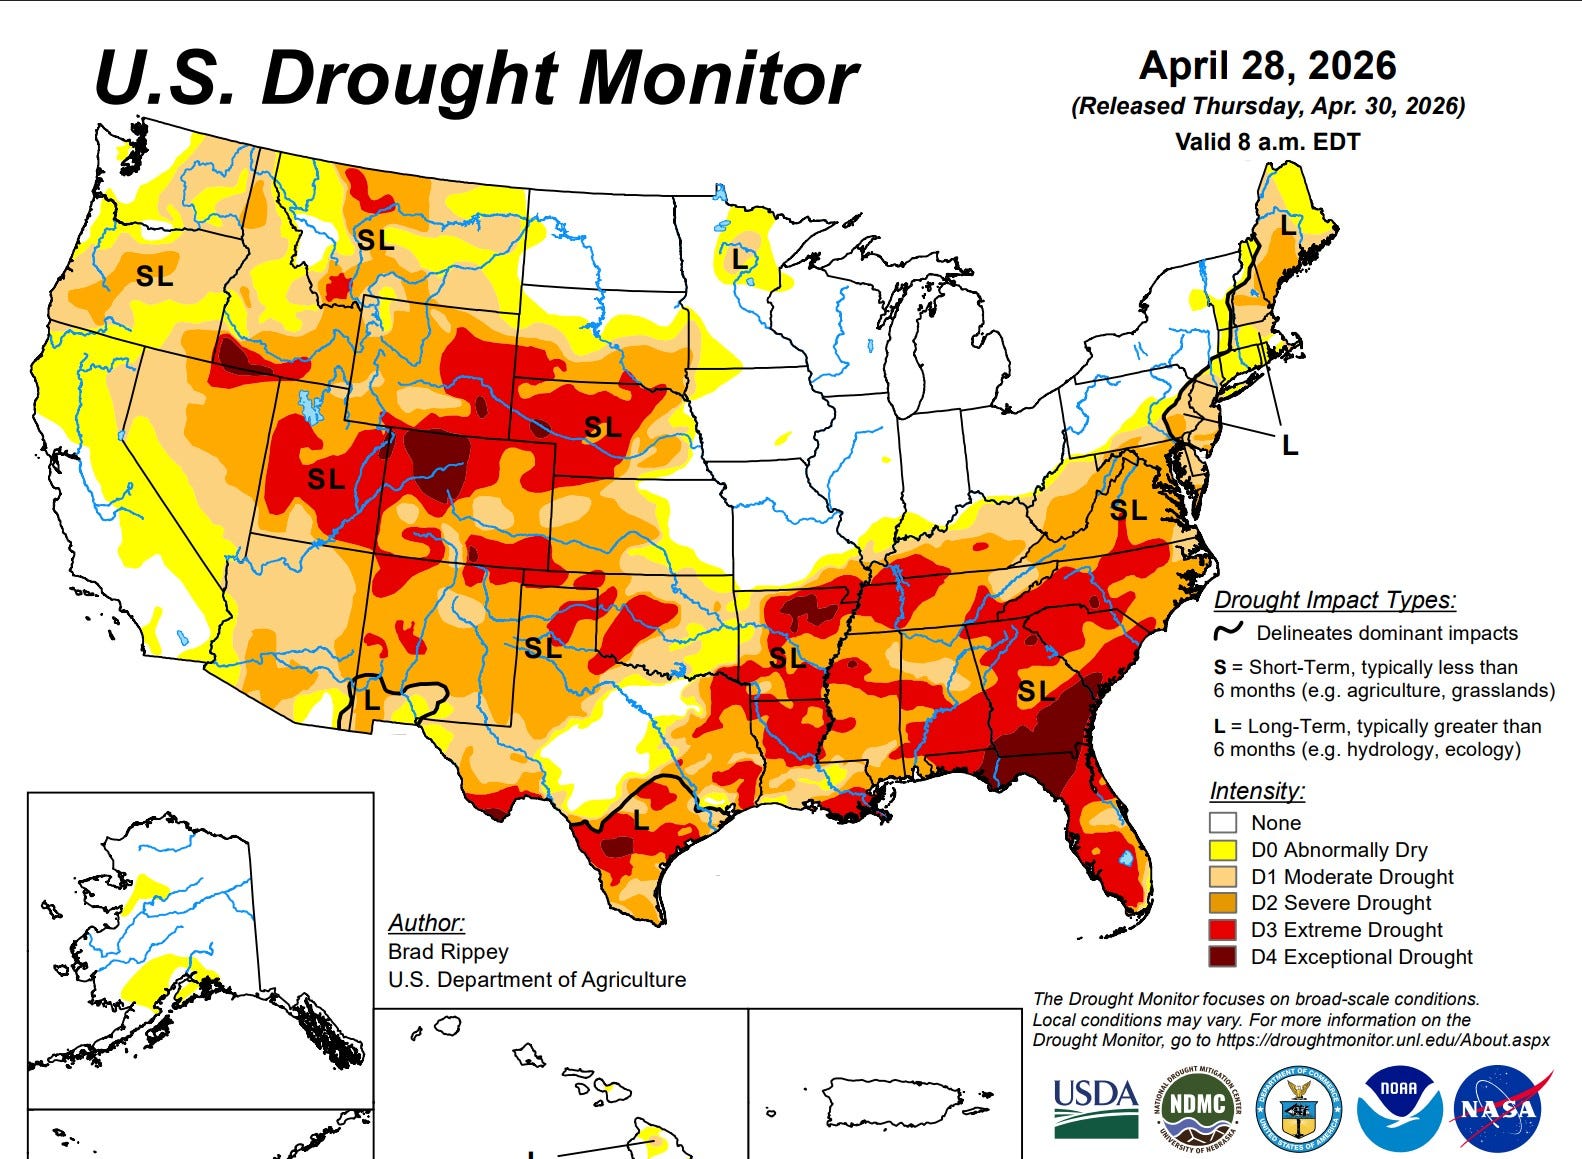
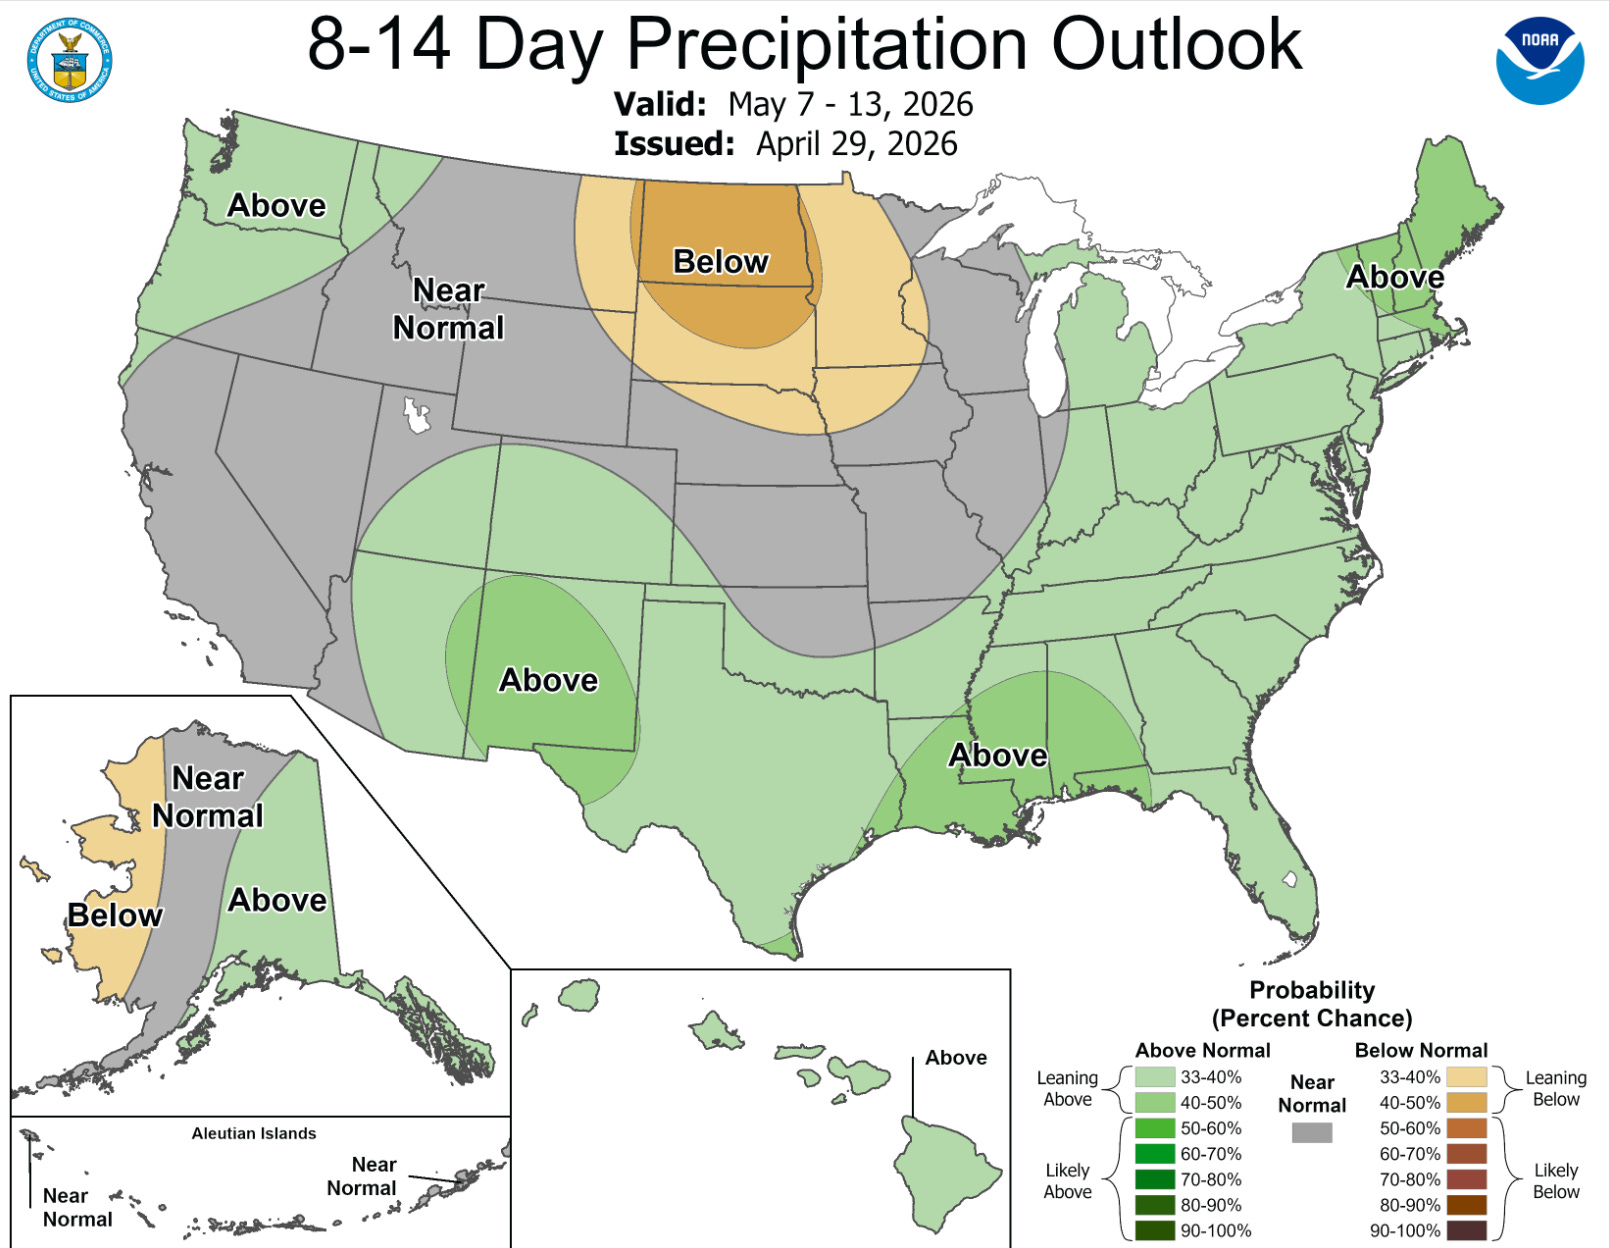
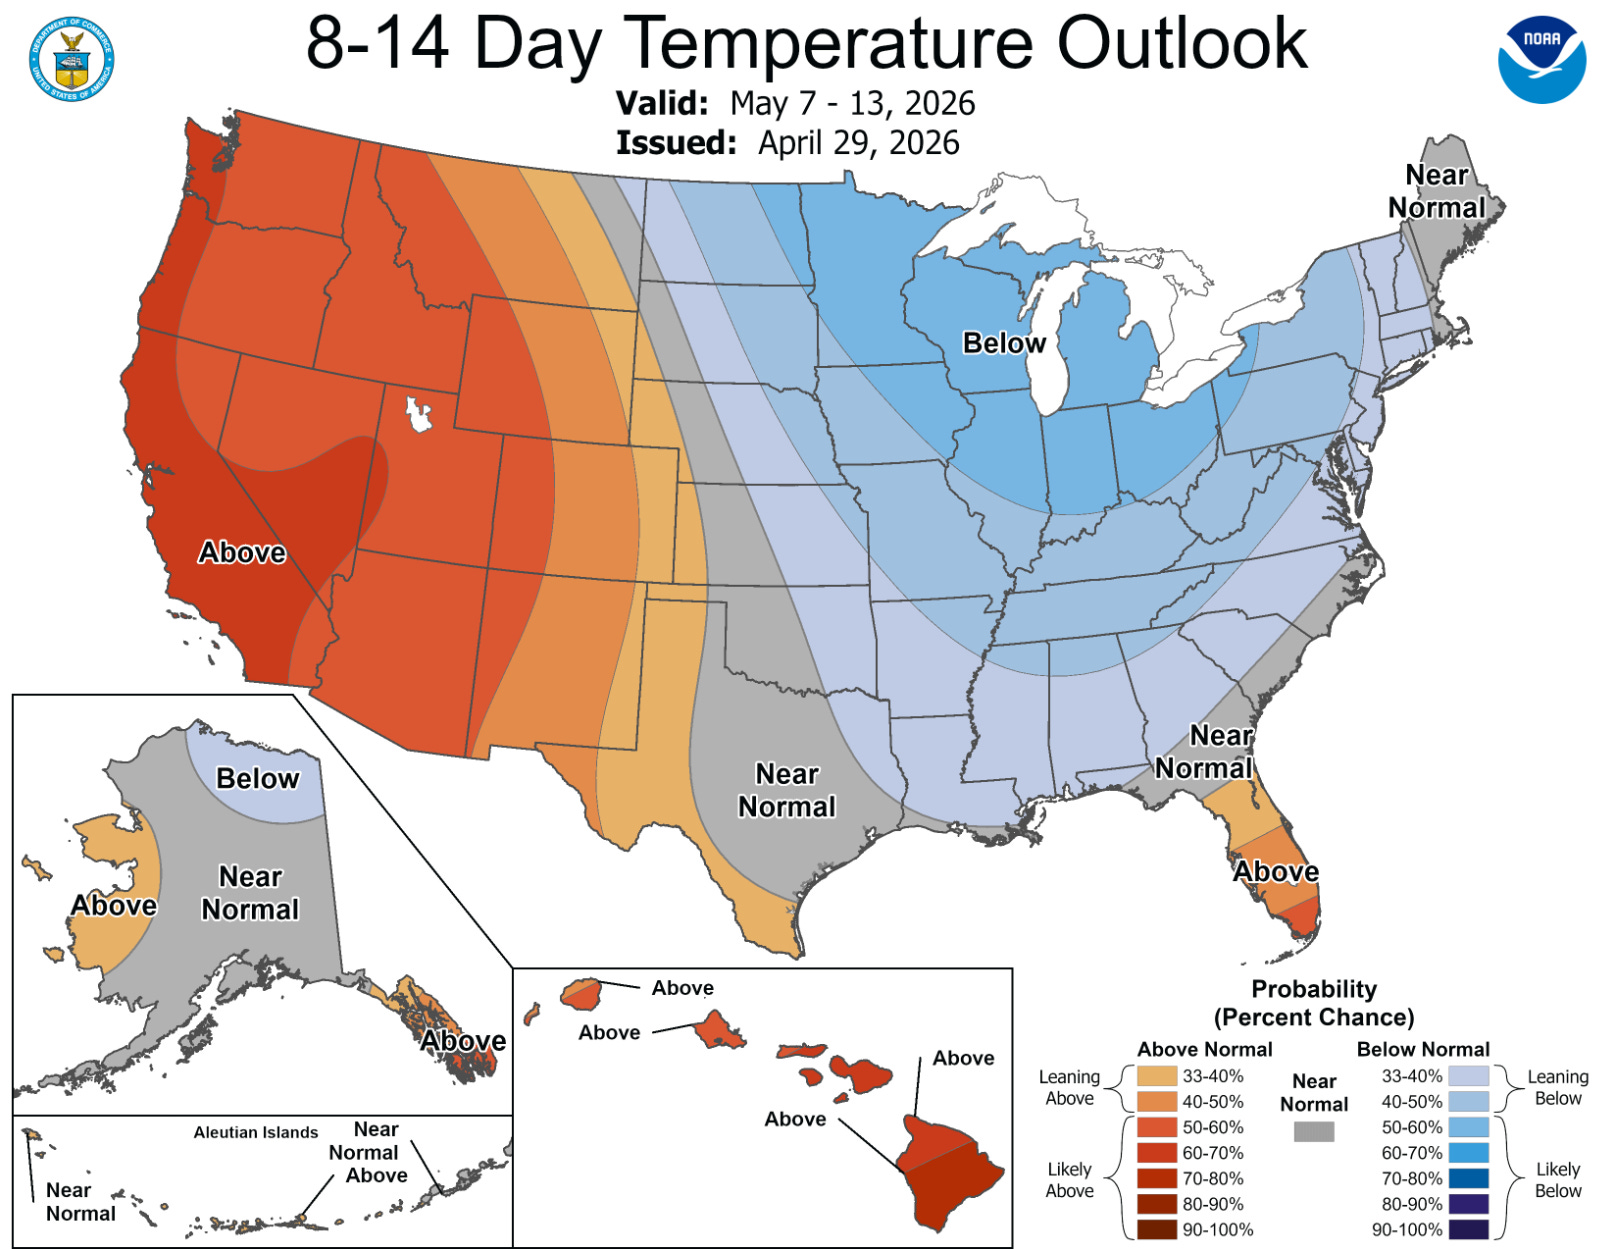
U.S. Weather: Adequate moisture has made its way through most of the Corn Belt to start the growing season. Except for the far Western Corn Belt, soil moisture is good. See the Drought Monitor below. Will we see an El Niño weather pattern develop this summer? Watch this space!
Link: National Weather Service Climate Prediction Center
Link: U.S. Drought Monitor
Link: Ag Wx
Agriculture News of Note:
“If You Bought It, You Own It”: Iowa House Backs Farm Right-to-Repair
USDA Expands Disaster Aid with Second SDRP Payment and Deadline Extension for Producers
One For The Road: A Wolfe 600 Drainage Plow.

Thanks for reading the Corn Belt Newsletter! If you’re looking to buy or sell farmland or would like an evaluation of your property, please reach out to me.
Contact Information: Joshua Manske (Farm Real Estate)
Cell: 515-707-1774
Email: joshuahmanske@gmail.com
Farm and Home Services LLC
No posts
Comments
Nothing yet. Say the first thing.
Sign in to join the conversation.