
Hi everyone,
I hope you had a great weekend!
A quick note to say “Thank You” to everyone for your feedback on the new format. I will incorporate (to the degree possible) the suggestions you have made.
Okay, let’s jump into this week’s newsletter…
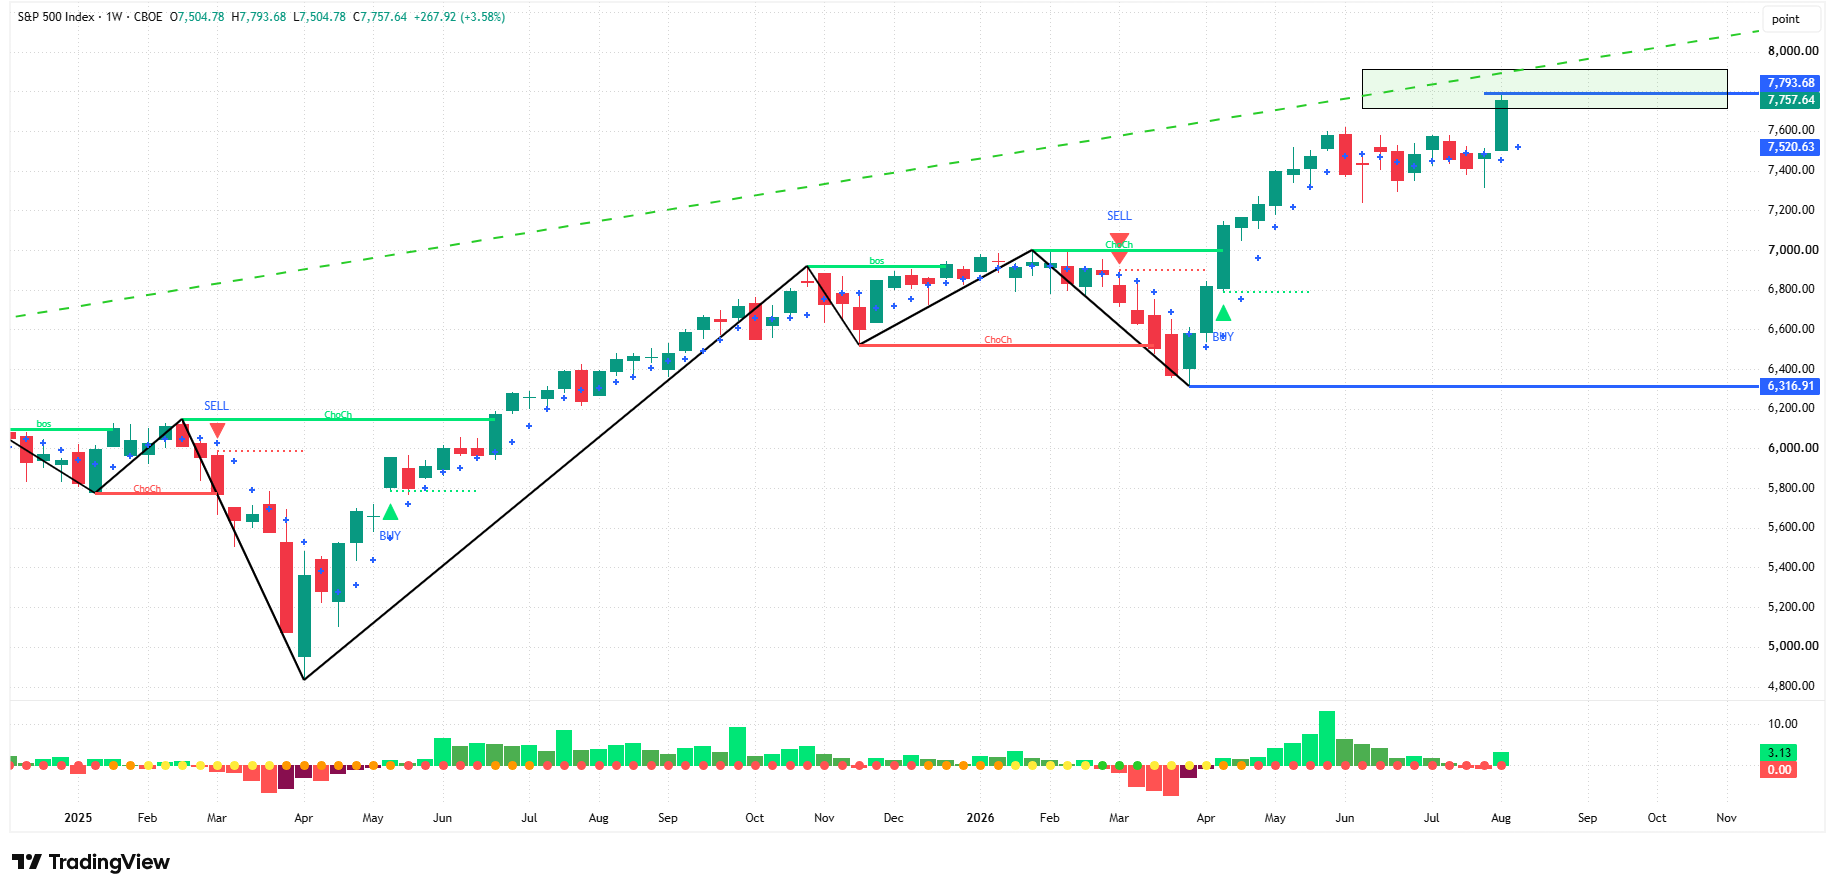
Structure = Bullish
Signal = Buy
Signal Grade = A
Minimum Target = 7,912
Stop Loss = a weekly close below 7,458
Reward-to-Risk = 0.5x
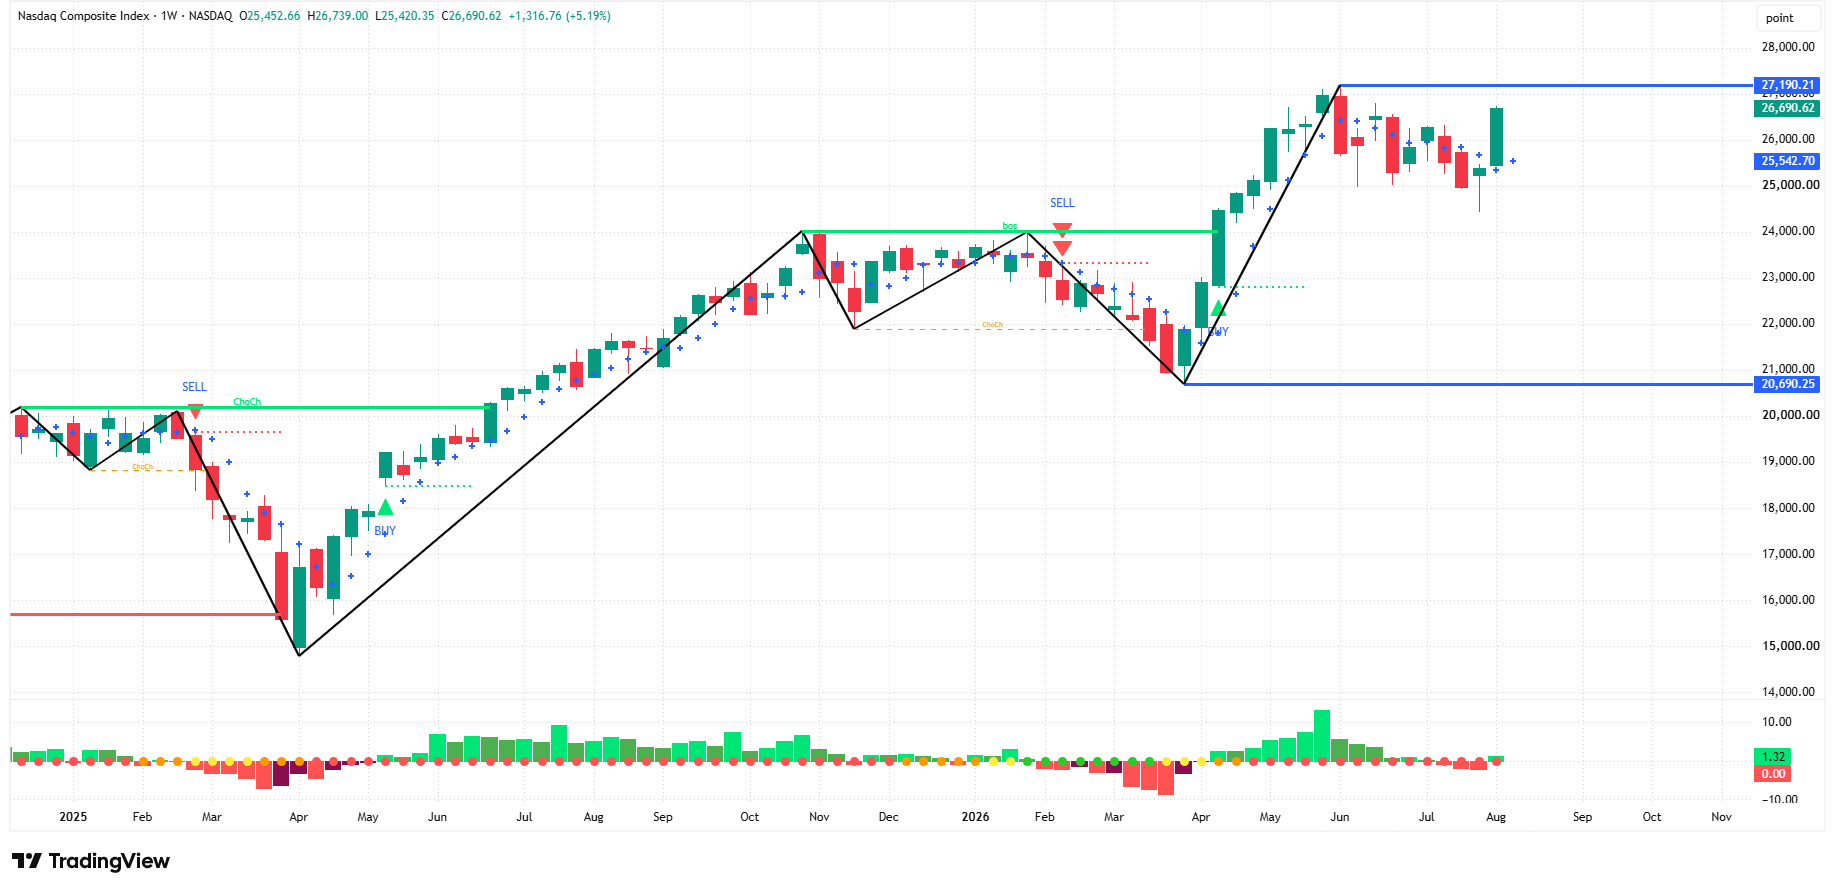
Structure = Bullish
Signal = Buy
Signal Grade = A
Minimum Target = 27,190
Stop Loss = a weekly close below 25,145
Reward-to-Risk = 0.3x
Each week, I analyze over 150 global ETFs across seven broad asset classes using my proprietary systematic process, which I call “The Market Map.”
The Market Map combines my proprietary “Market Structure” methodology with my proprietary “Turn Signal” indicator to provide a “Market Bias” for each asset class.
The Market Bias tells us the possible direction (bullish 🟢, bearish 🔴, or neutral 🟡) of each asset class over the short- to medium-term.
The Market Map is a rules-based, systematic framework that removes emotion from the investment decision-making process.
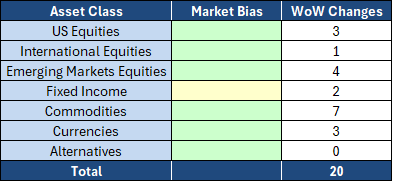
There were twenty changes this week, but they aren't twenty independent signals.
Thirteen of them — the miners, copper, natural resources, three currency positions, international bonds, and the EM complex — are the same trade expressed in different ways: the dollar is weakening.
If the dollar reverses, most of last week's signals may reverse with it.
Summary of the Week-Over-Week changes:
Neutral 🟡 —> Bullish 🟢 = 15
International (1), Emerging Markets (4), Fixed Income (2), Commodities (5), Currencies (3)
Bearish 🔴 —> Neutral 🟡 = 3
US Equities (2), Commodities (1)
Bullish 🟢 —> Neutral 🟡 = 2
US Equities (1), Commodities (1)
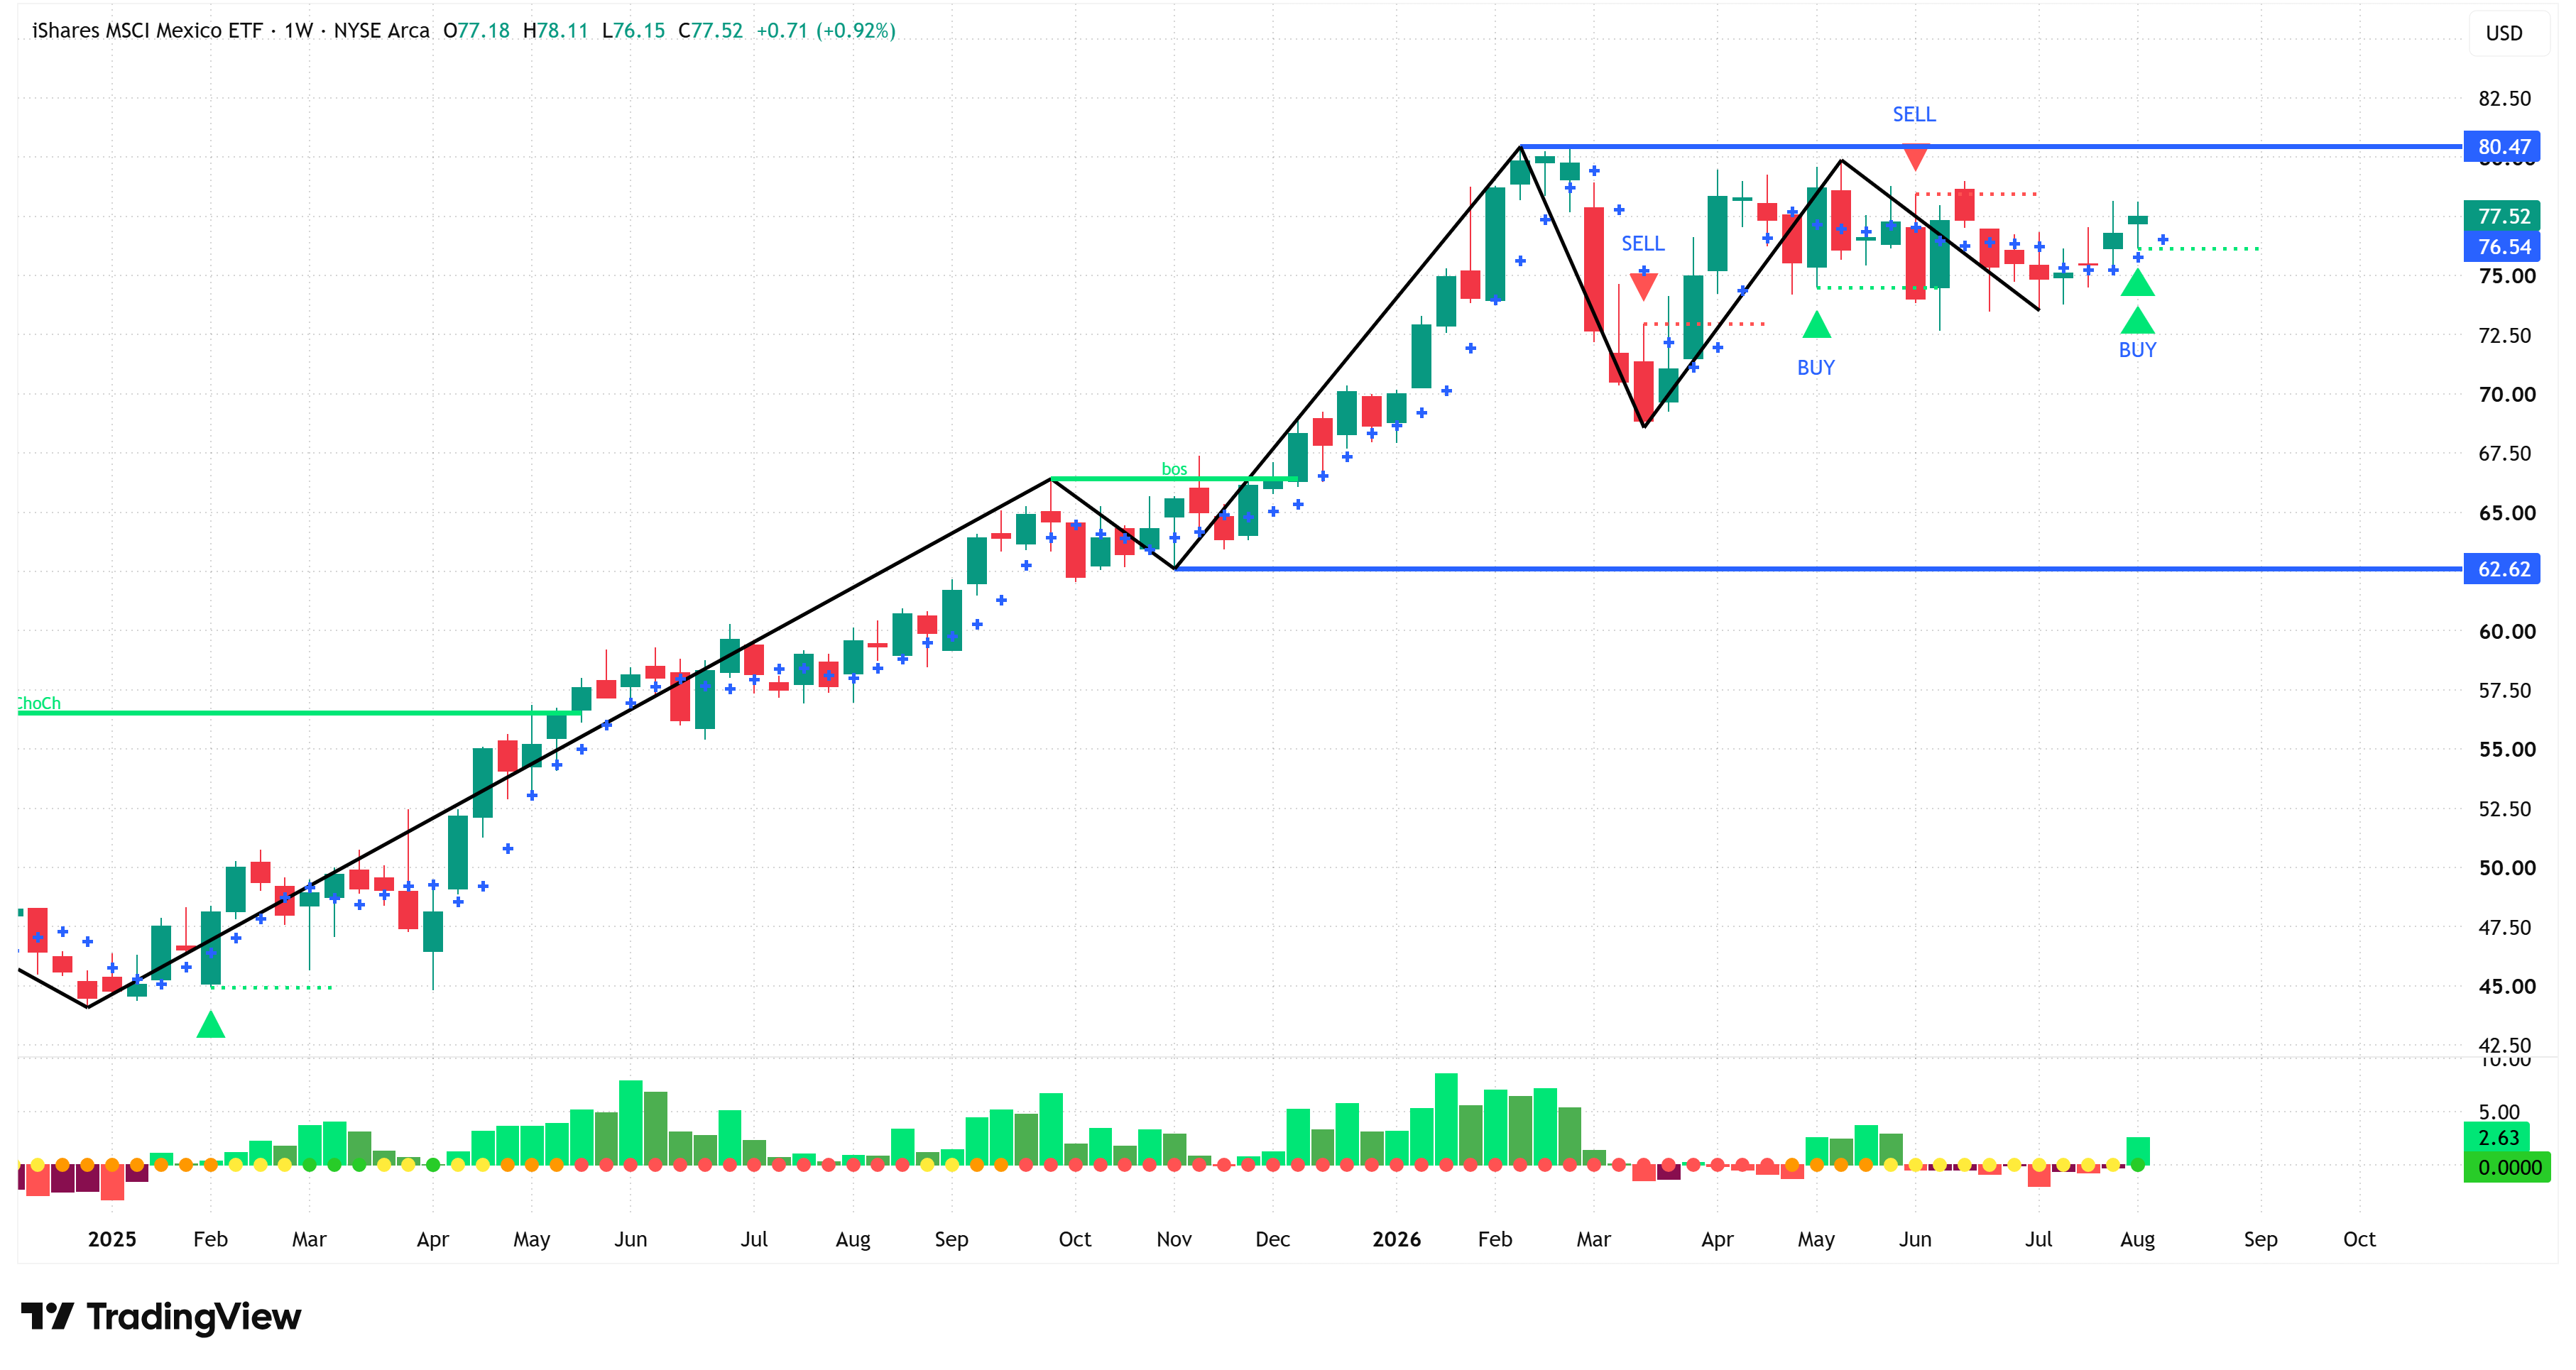
EWW (iShares MSCI Mexico ETF): Neutral 🟡 —> Bullish 🟢
Structure = Bullish
Signal = Buy
Signal Grade = A+
Minimum Target = 80.47
Stop Loss = a weekly close below 76.15
Reward-to-Risk = 2.2x
“Signal Grade” measures the quality of the setup and has one of the following four grades:
A+ = “Double Triangle” where signal and structure are aligned.
A = “Single Triangle” where signal and structure are aligned.
B+ = “Double Triangle” where signal and structure are not aligned.
B = “Single Triangle” where signal and structure are not aligned.
“Reward-to-Risk” is a measure of the target price vs. the stop loss price based on an entry at Friday’s close.
Note: A high-grade signal can have a poor “Reward-to-Risk” if price is already extended.
Would you like to see the same analysis for the other 19 securities that changed on a week-over-week basis? Plus, the current Market Bias for all 150+ securities?
If so, check out our paid section below.
I like to highlight the results of our “SGR - Turn Signal” indicator each week.
The SGR - Turn Signal is one of the two key components used in our proprietary Market Map methodology. The other is our analysis of Market Structure.
This week, we’ll highlight ZBRA:
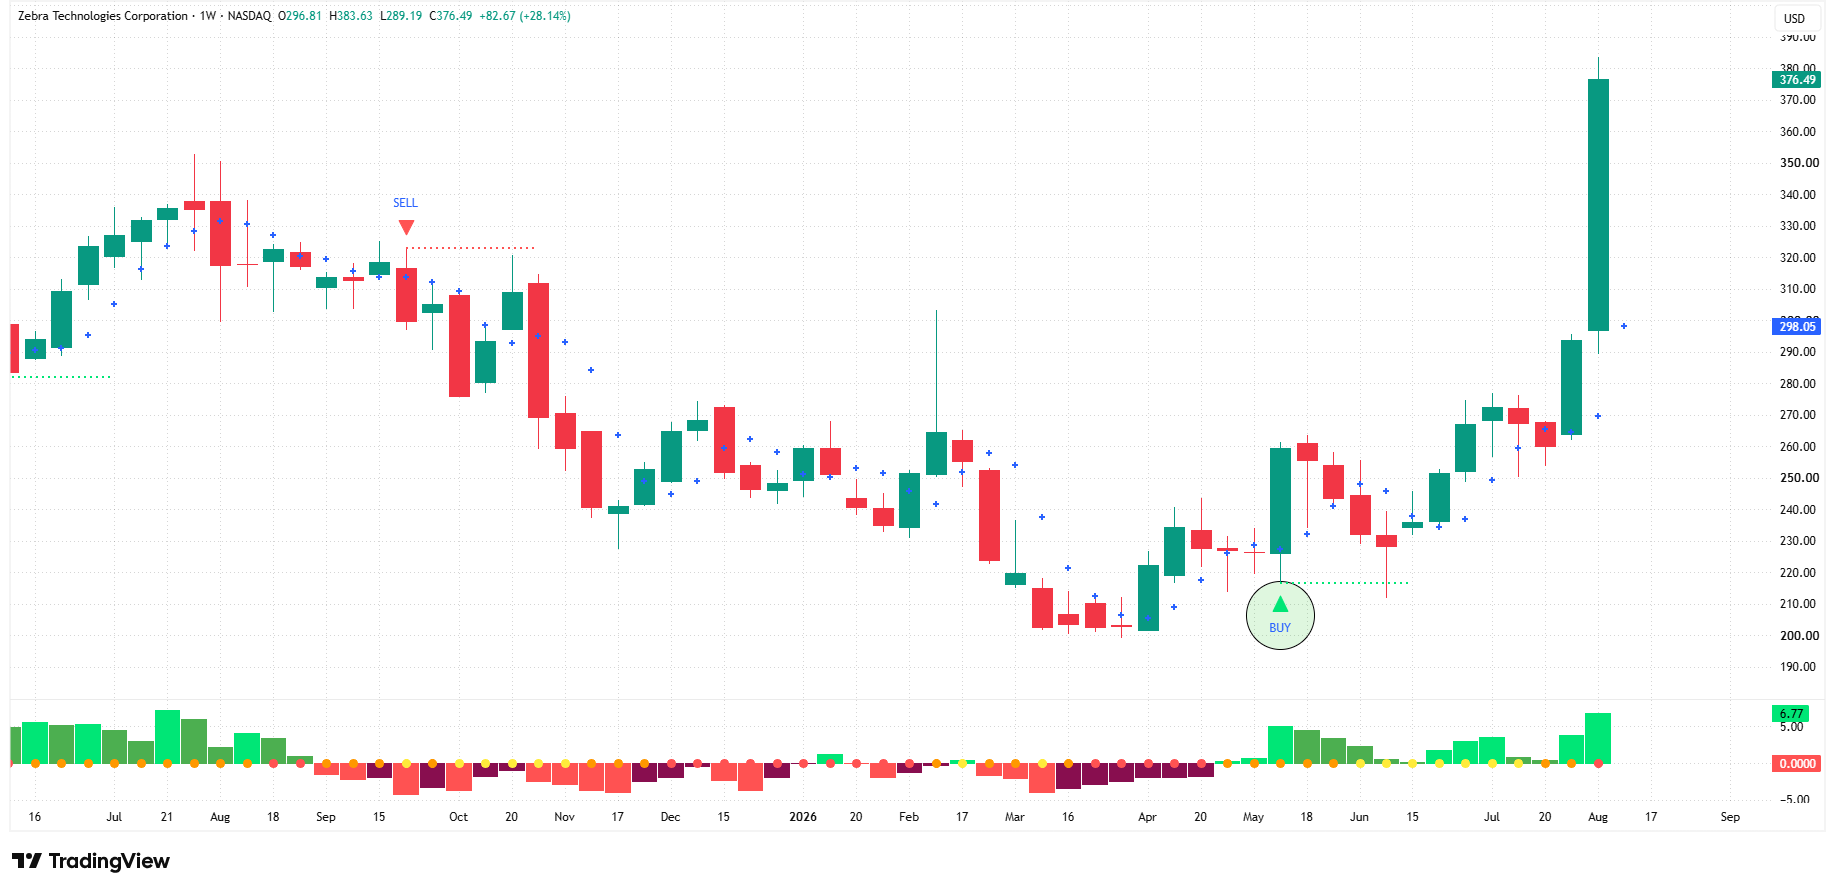
Zebra Technologies Corporation (ZBRA) returned 28.14% last week.
The SGR - Turn Signal initiated a “Buy” signal for ZBRA on May 15, 2026.
With the SGR - Turn Signal, you could have been in ZBRA almost three months before last week’s breakout.
If not, consider joining our FREE LIVE webinar this Thursday, August 13th, at 7:00 pm (ET), where you can learn more about the SGR - Turn Signal, how to get access to it, and how it works within the context of our Market Map methodology.
Can’t join live? No worries, the presentation and recording will be provided to all who register.
👉 Click here to grab your seat: Webinar Registration
Paid subscribers receive access to our “Investment Ideas” portfolio each week.
The Investment Ideas portfolio uses our “Market Map” methodology to sift through hundreds of securities each week to create a portfolio of our best ideas.
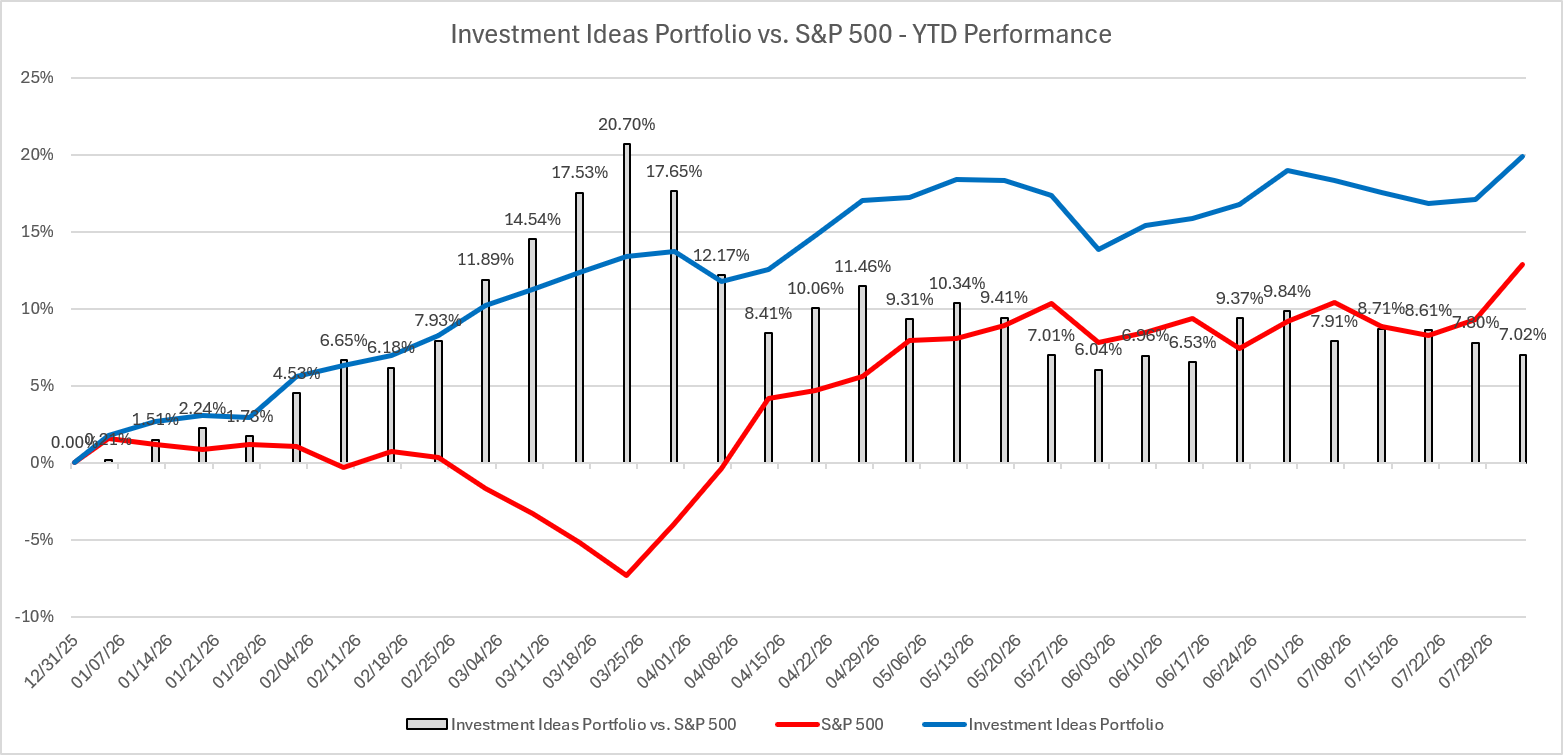
Year-to-date, our Investment Ideas portfolio has returned 19.89% and has outperformed the S&P 500 by 7.02%.
Would you like access to our Investment Ideas portfolio each week?
If so, consider becoming a paid subscriber by clicking the link below.
Comments
Nothing yet. Say the first thing.
Sign in to join the conversation.