
Hey everyone — it’s Jim.
I hope you had a great weekend!
Let’s jump right into this week’s newsletter…
Let’s take a look at a couple of the Top Performing stocks in the S&P 500 last week.
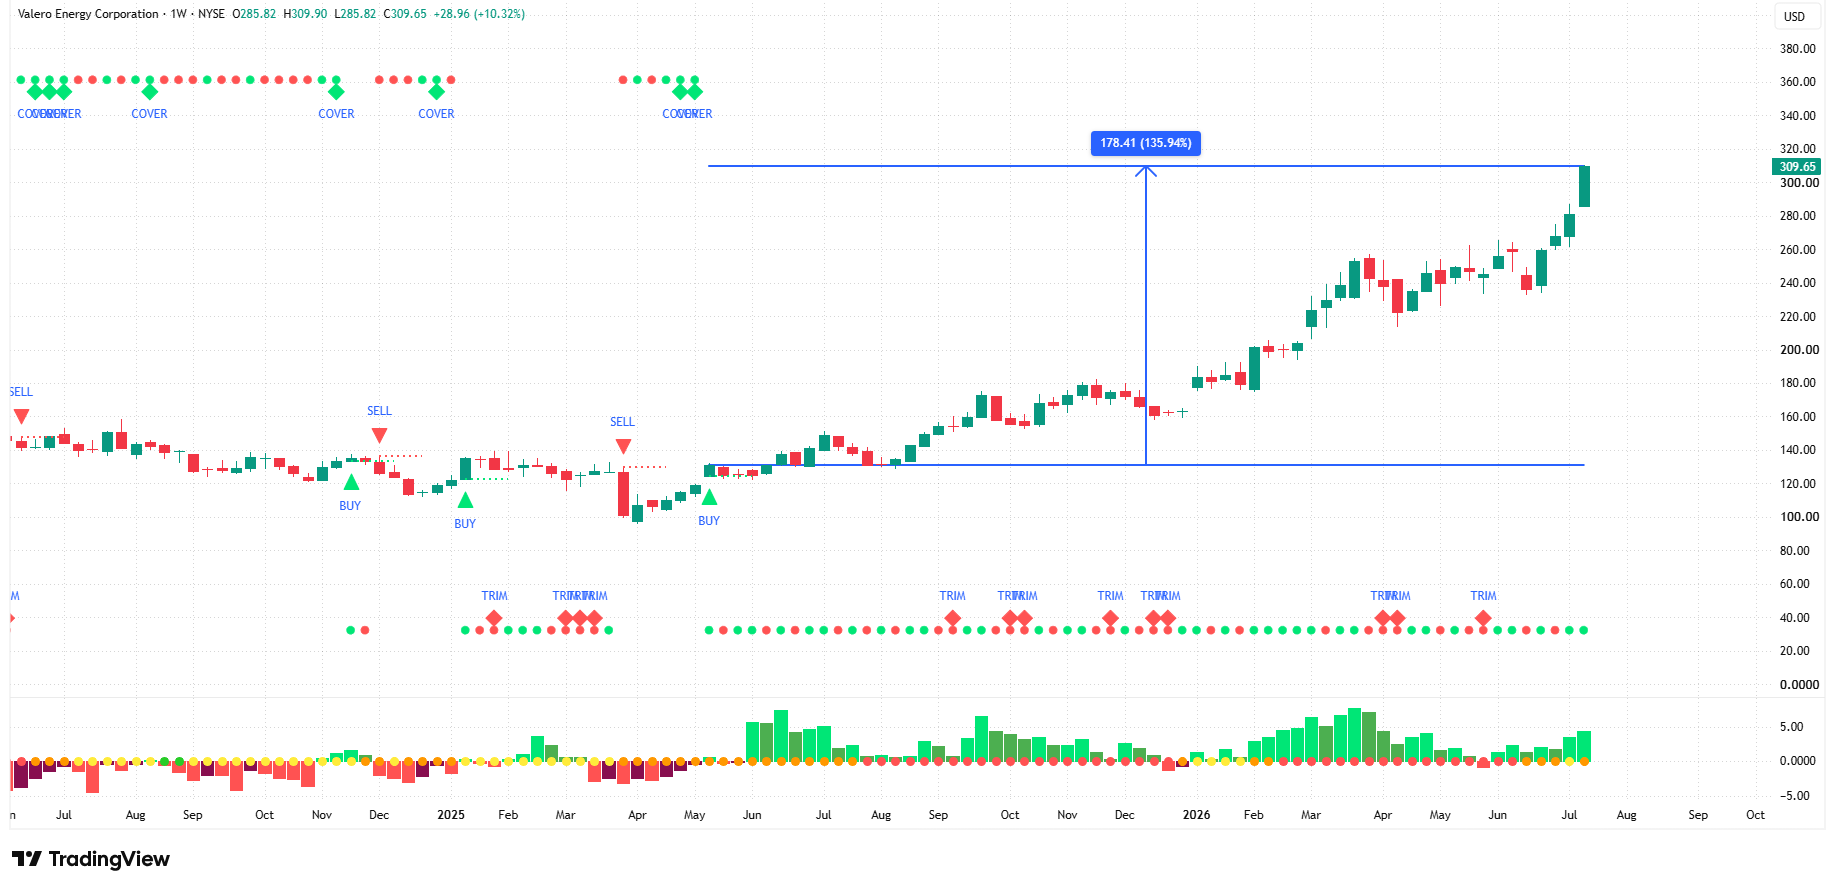
Valero Energy Corporation (VLO) returned 10.32% last week.
Using the weekly chart, the SGR - Turn Signal initiated a “Buy” signal for VLO on May 16, 2025.
Since then, VLO has appreciated by 135.94%.
With the SGR - Turn Signal, you could have been in VLO more than a year before last week’s breakout.
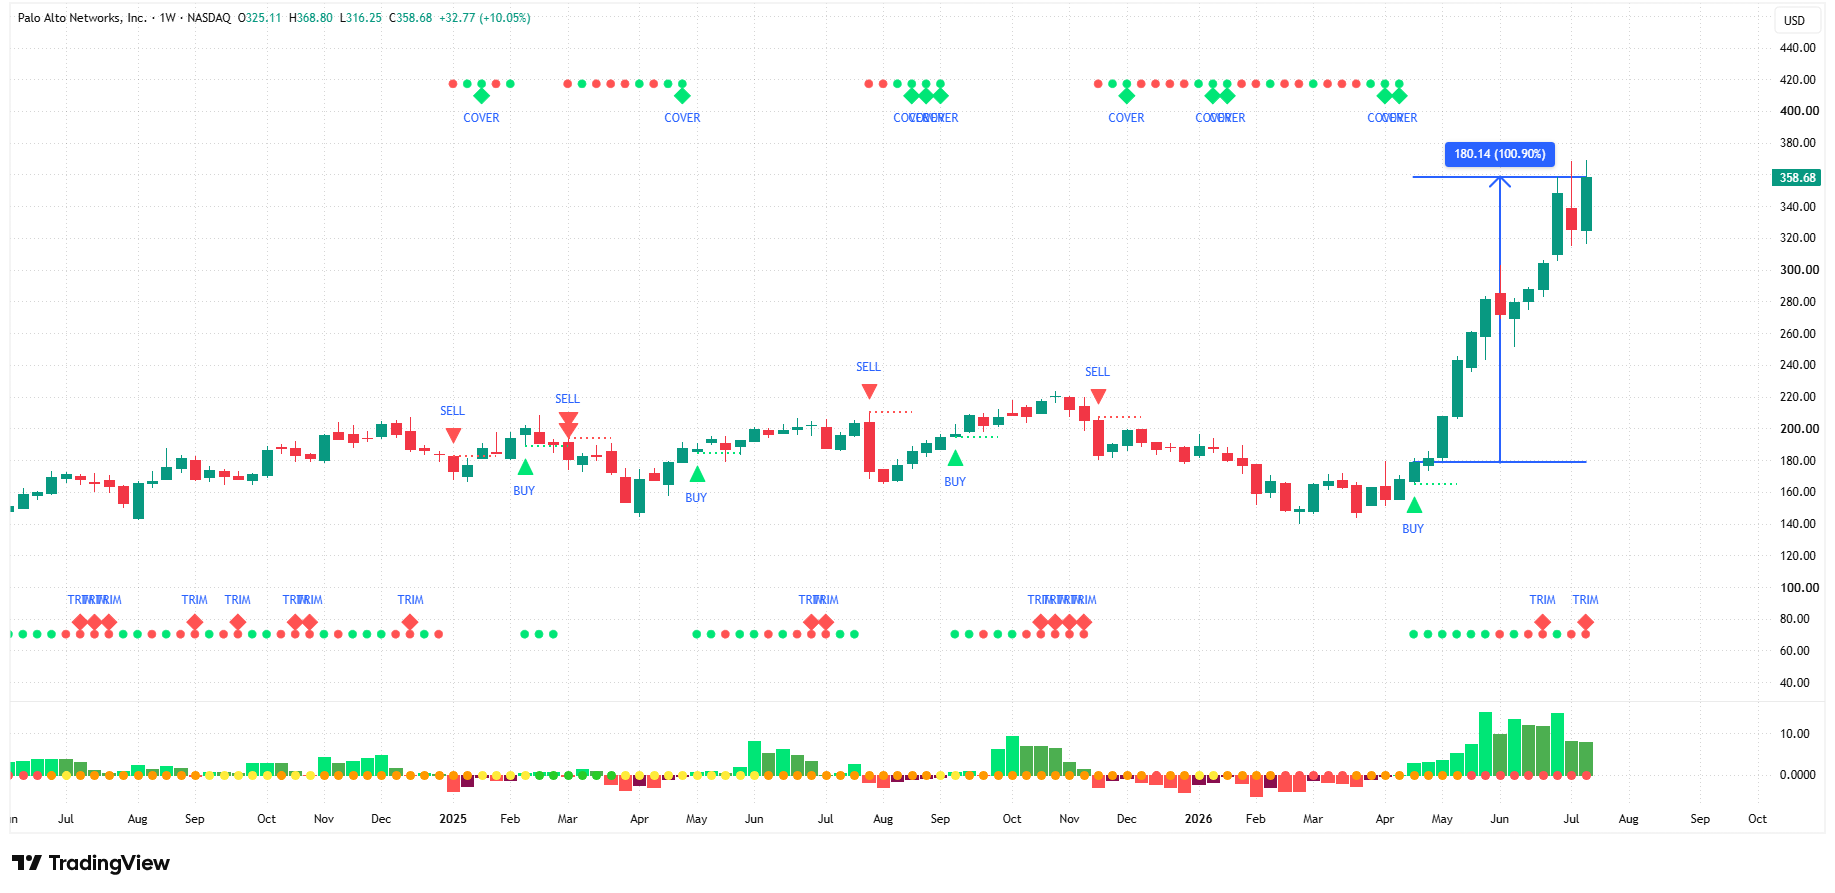
Palo Alto Networks, Inc. (PANW) returned 10.05% last week.
Using the weekly chart, the SGR - Turn Signal initiated a “Buy” signal for PANW on April 24, 2026.
Since then, PANW has appreciated by 100.90%.
With the SGR - Turn Signal, you could have been in PANW months before last week’s breakout.
Do you have a system in place to find these types of breakout opportunities each week?
If not, consider joining our FREE LIVE webinar this Thursday, July 23rd, at 7:00 pm (ET), where you can learn more about the SGR - Turn Signal and how to get access to it.
Can’t join live? No worries, the presentation and recording will be provided to all who register.
👉 Click here to grab your seat: Webinar Registration
Each week, we break down the S&P 500 using our proprietary systematic process, which we call “The Market Map.”
The Market Map is an analysis of market structure. Understanding market structure can provide clues as to where the market may be heading next.
To do this, we use multi-timeframe analysis. We start by analyzing the bigger picture (weekly chart) and then look for confirming evidence by shifting to a lower time frame (4-hour chart).
Weekly Chart
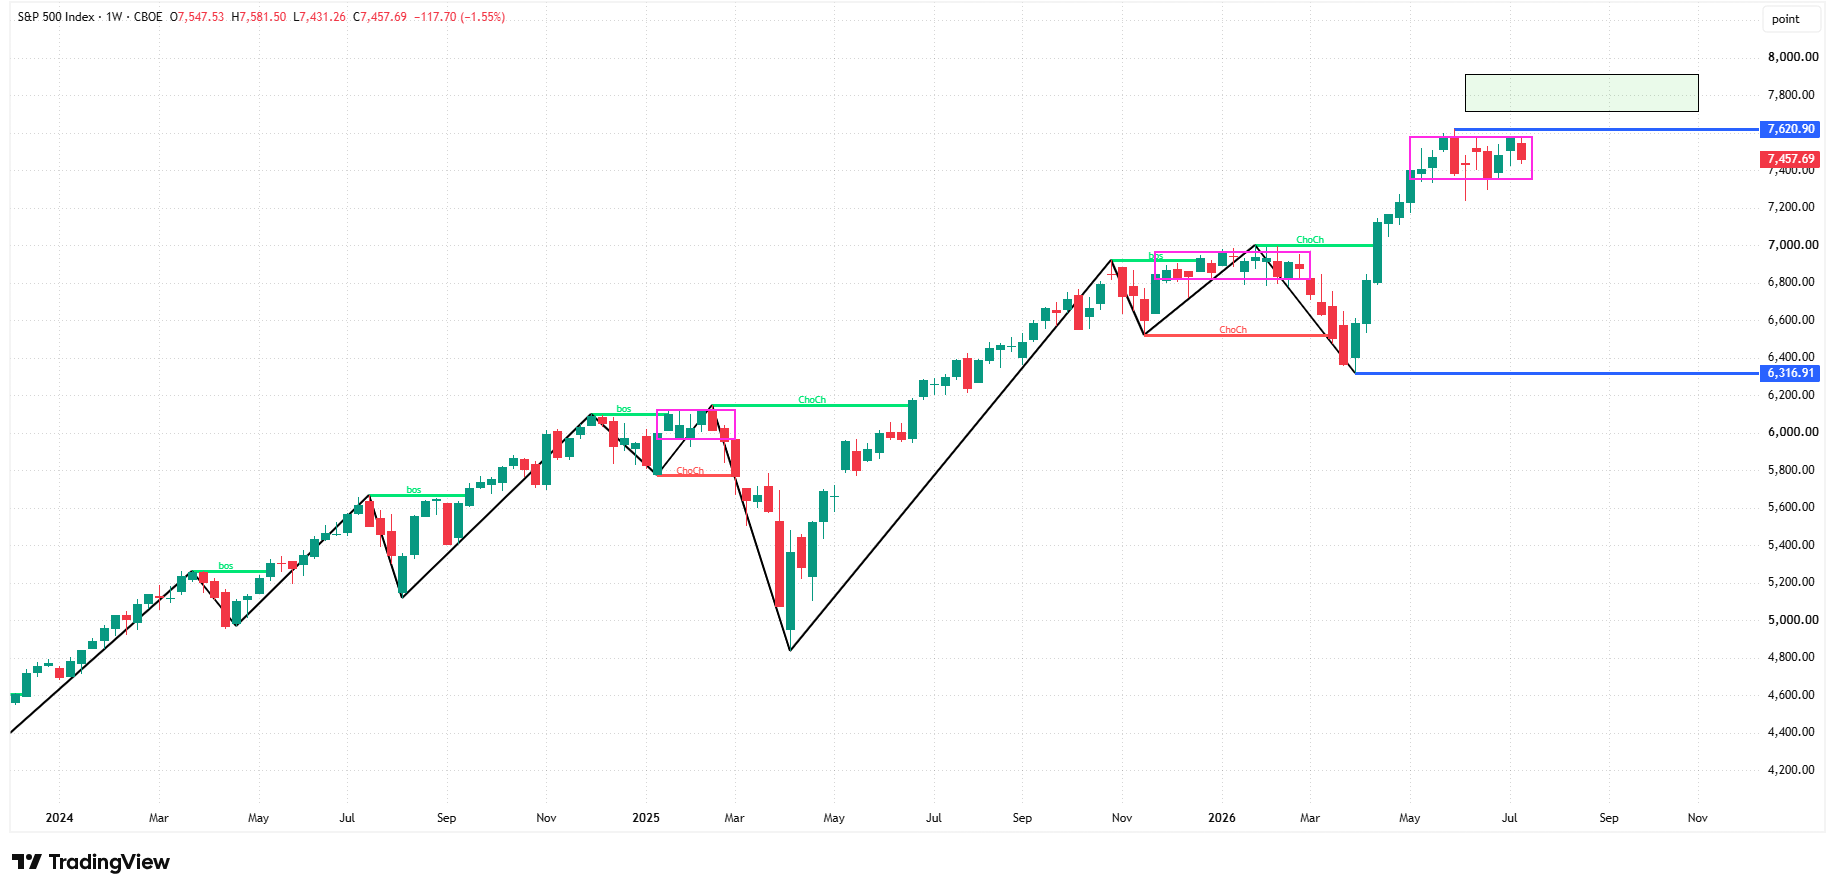
The S&P 500 has remained in a tight range for the last 10 weeks (see pink box).
This has happened a couple of other times over the past year or two, and they tend to end with a move lower.
This sideways actions doesn’t negate the fact that the S&P 500 remains in a bullish structure on the weekly chart, but if you’re going to do it (i.e., break higher), just do it already.
The key level we want to watch is 7,621.
A break of this level will likely push the S&P 500 to the price target (7,700 - 7,900) I have been highlighting for several weeks now.
4-Hour Chart
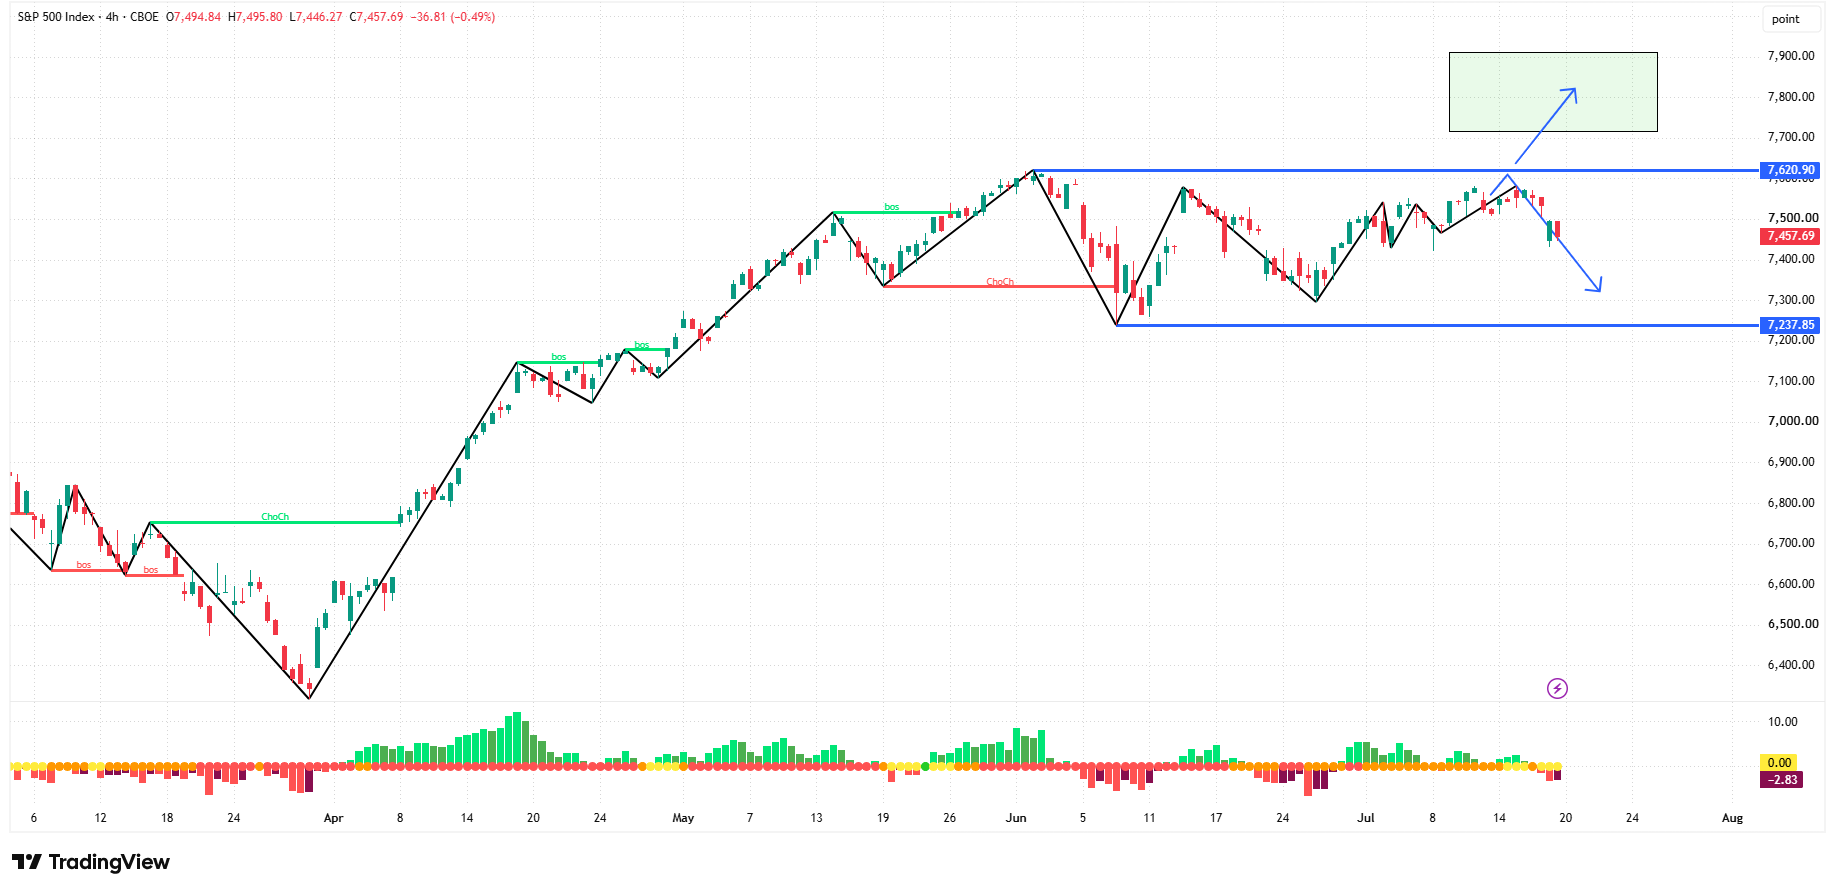
You’ll recall from last week that I presented two blue arrows as possible paths the S&P 500 could take in the coming days/week.
Well, so far, it appears to have chosen the lower path.
The 4-hour chart remains in a bearish structure, which, as I’ve pointed out for weeks, creates a conflict for the weekly chart.
The bulls should keep an eye on a break above 7,621.
The bears should keep an eye on a break below 7,238.
Summary
The market feels heavy, and I’m worried that it hasn’t been able to break out of the pink box noted above.
Net/net, I’m not convinced this is a time for adding risk; in fact, it seems like a time to do the opposite.
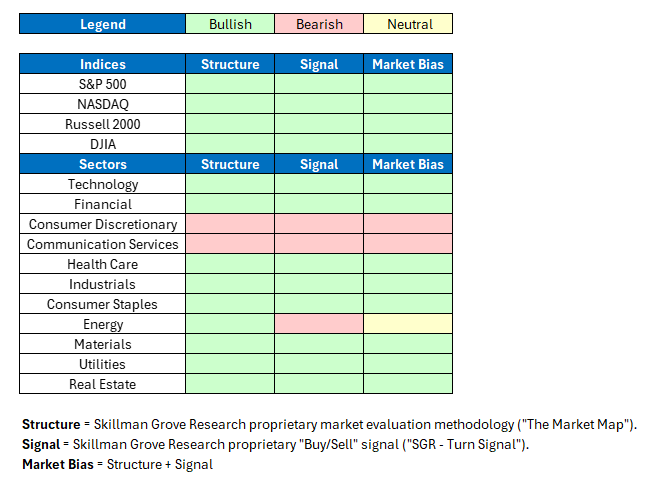
When we combine our structural analysis (“The Market Map”) with our signal analysis (“SGR - Turn Signal”), we create what we call the “Market Bias.”
The Market Bias tells us the possible direction (bullish 🟢, bearish 🔴, or neutral 🟡) of each market over the short- to medium-term.
Note: We use the weekly chart for this analysis to smooth out the day-to-day price volatility.
Here’s a quick snapshot of our Market Bias analysis for the major US indices and sectors.
There were no changes on a week-over-week basis.
Would you like to see our Market Bias and the accompanying charts for additional asset classes so you can stay on the right side of the market?
If so, in our paid section below, we detail 30+ securities/charts each week.
The charts include various indices, equity sectors, US Treasuries, currencies, commodities, and fixed income.
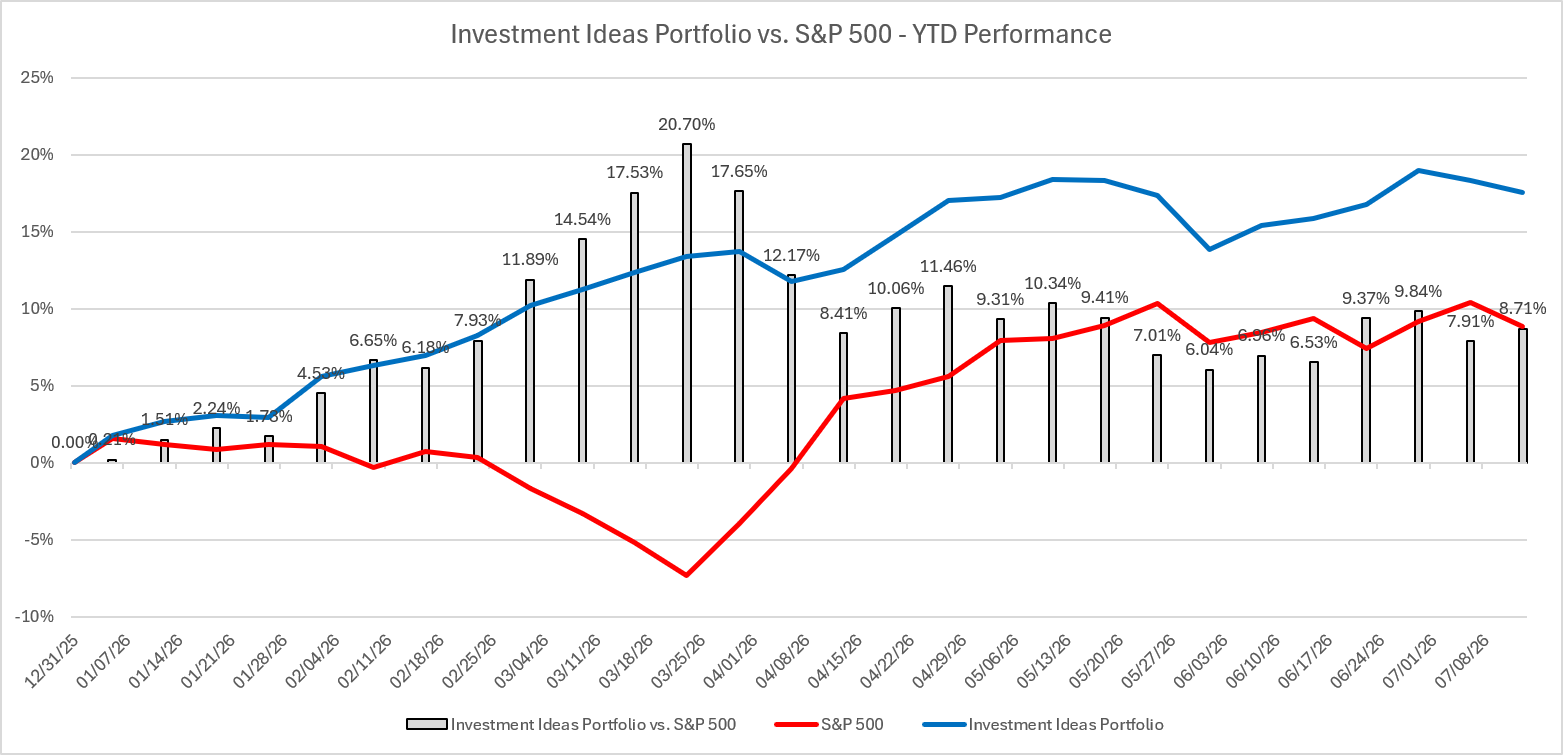
In addition to the 30+ securities/charts noted above, each week, we use our “Market Bias” methodology to sift through hundreds of securities to create a portfolio of our best “Investment Ideas”.
Year-to-date, our “Investment Ideas” portfolio has returned 17.56% and has outperformed the S&P 500 by 8.71%.
Would you like access to our “Investment Ideas” portfolio so you can see our buys and sells in real-time?
If so, consider becoming a paid subscriber by clicking the link below.
Comments
Nothing yet. Say the first thing.
Sign in to join the conversation.